Does Central Clearing A↵ect Price Stability?
Evidence from Nordic Equity Markets
⇤Albert J. Menkveld, Emiliano S. Pagnotta, and Marius A. Zoican† October 2015
⇤For helpful comments and conversations we thank Viral Acharya, Bruno Biais, Harjoat Bhamra, Darrell Duffie, Joel Hasbrouck,
Marcin Kacperczyk, Thorsten Koeppl, Evgenia Passari, Stijn Van Nieuwerburgh, and seminar participants at the New York University Stern School of Business, the Duisenberg School of Finance, the 2014 European Meeting of the Econometric Society, and the 2014 Eastern Finance Association. We also thank EMCF for providing data support. Special thanks also to Henrik Hausman, Arnoud Siegmann, and Andras Vajlok for useful discussions on the Nordics markets. Menkveld gratefully acknowledges NWO for a VIDI grant.
†Albert Menkveld is affiliated with VU University Amsterdam and the Tinbergen Institute. Emiliano Pagnotta is affiliated with
Imperial College London. Marius Zoican is affiliated with the Paris Dauphine University. Albert Menkveld can be contacted at
[email protected]. Emiliano Pagnotta can be contacted [email protected]. Marius Zoican can be contacted at
Does Central Clearing A↵ect Price Stability?
Evidence from Nordic Equity Markets
Abstract
We provide evidence of the e↵ects of introducing a central clearing counterparty (CCP) on price stability by adopting as an experimental construct the 2009 clearing reform in three Nordic equity markets. We find that the daily price volatility of the a↵ected equities experience an economically significant decline of 8.8% relative to pre-reform levels. The decrease in volatility is more pronounced for stocks with a higher margin cost impact, consistent with the predictions of dynamic asset pricing models. We also find that the reform induces a sharp decline of 9.8% in trade volume but no deterioration in market quality as captured by trading costs and information measures. Overall, our results suggest that the adoption of central clearing enhances price stability. Our results also suggest an important coordination role for policy in implementing clearing reforms, since investors failed to voluntarily clear trades in the CCP when given the option.
Keywords: Central clearing, price stability, equity volatility, margin requirement, counterparty risk, liquidity.
1 Introduction
A central element of any financial market is its clearing system, which turns promises into actual transfers of assets between investors. In the aftermath of the 2007–2008 global financial crisis, a growing consensus has emerged on the fragility of bilateral clearing designs and on the benefits of a central clearing counterparty (CCP). Both the Dodd–Frank Act in the United States and the European Union regulation on derivatives, central counterparties, and trade repositories (European Market Infrastructure Regulation, or EMIR), for example, mandate the central clearing of large classes of derivatives products.1 The arguments in favor of the
macro benefits of a CCP for the financial system are well recognized in the literature and include reducing counterparty default probabilities and lowering financial distress contagion and the frequency of crises, all factors that are generally associated with rather infrequent tail risks.2 It is less clear, however, what the micro
consequences are for the stability of asset prices at higher frequencies, such as a day or a month, that are more closely related to the typical investor decision making horizon. Our study provides new evidence on this crucial issue by examining the impact of a central clearing reform on key factors that a↵ect price stability, such as volatility, trading activity, and market liquidity.
The simplest way to study the e↵ects of clearing regimes on a given dimension of price stability would be to compare, say, two equity markets with di↵erent clearing systems. However, endogeneity issues related to the system’s adoption itself would make such a direct test unreliable. One would then wish for a plausible source of exogenous variation, such as a clearing regime reform to identify its causal e↵ects, but such reforms are infrequent and, more importantly, also subject to empirical challenges. For example, clearing reforms may take place simultaneously with other significant market design changes. An important example is the creation of the Chicago Board Options Exchange in 1973, when the clearinghouse and the exchange were created simultaneously.3 Moreover, the transition from bilateral to CCP clearing typically has one or more
of the following features: (i) It is voluntary, (ii) it involves a relatively small proportion of assets within an asset class, (iii) it involves multiple clearing systems coexisting for extended periods, and (iv) in the case of
1Regulations in the United States and Europe reflect the spirit of the communiqué of the G20 Summit in Pittsburgh in September
2009, which states that “all standardized OTC derivative contracts should be traded on exchanges or electronic trading platforms, where appropriate, and cleared through central counterparties.”
2SeeAllen and Gale(2007) for a historical account of financial crises over the last two centuries.
3More recently, certain classes of derivatives, such as interest rate swaps (IRS) and credit default swaps (CDSs), began clearing
in CCPs and trading in electronic trading venues (swap executions facilities, or SEFs) while they traded in a decentralized fashion before.
derivatives products, it may involve changes in the contract itself and/or the trading mechanism (e.g., the process of futurization to begin trading on exchanges). Under such circumstances, issues such as selection bias,4loss of identification power, and the confounding e↵ect of CCP competition are important concerns.
We address these challenges by using as an experimental construct the 2009 introduction of a CCP for equities in Denmark, Finland, and Sweden (the Nordics, hereafter). Equities in these Nordic countries were traditionally cleared bilaterally through a given local central securities depository (CSD). In October 2009, however, stocks in these markets started clearing centrally through the clearinghouse European Multilateral Clearing Facility (EMCF). This setting has several attractive features. First, the endogeneity of timing concern is mitigated in this case by the fact that the chief trigger of the reform was not a domestic development but the global crisis of 2007–2008. Second, focusing on equities eliminates a number of pressing concerns that would arise with derivatives related to simultaneous changes in transparency standards and/or contract specifics.5Third, the regime change is unusually “clean”: These markets transitioned from a purely bilateral
system to central clearing with a single clearinghouse, eliminating concerns related to competition between CCPs. Also desirable is the fact that the event is fairly recent, especially given the major transformations (technological, regulatory, etc.) that financial markets have experienced over the last three decades which may have influenced the quantitative e↵ects we seek to identify.
A defining feature of the reform we study is that the transition to central clearing was only optional in a first stage, becoming mandatory for all traders in a second stage. From a statistical point of view, the compulsory nature of the reform eliminates selection bias concerns on the investor side. Moreover, it allows us to investigate how investors and financial institutions behave in light of the incentives provided by alternative clearing systems. A first contribution of our study is then to o↵er evidence on the issue of whether market participants perceive the benefits of central clearing to be greater than its costs. In short, we find that traders in Nordic markets did not voluntarily clear their trades through the CCP: Less than 1% of the volume was cleared through the EMCF by September of 2009 (one month before the mandatory phase).
4For example, a CCP may a↵ect market liquidity for an asset, but liquidity determines whether a product is suitable for central
clearing. For a CCP to manage the default of its clearing members, it must be able to liquidate, hedge, or close out the defaulting positions. The degree of market liquidity will a↵ect the CCP’s ability to efficiently liquidate positions in the market.
5In contrast to the reform considered in this paper, the introduction of CCP services in the U.S. swap market is taking place
contemporaneously with several other key changes mandated by the Dodd–Frank Act: (i) ex post price transparency through swap data repositories, (ii) the standardization of products that were previously customized, (iii) electronic trading and ex ante price transparency through SEFs, and (iv) clearing house competition and the di↵erentiation of clearing protocols.
We find this lack of voluntary participation to be consistent across the three a↵ected countries, as well as across di↵erent market capitalizations. This suggests that in cases where central clearing is arguably socially efficient, economic agents may fail to internalize some of the social benefits, thus creating a key coordination role for policy in implementing clearing reforms.6
To analyze the e↵ect of the mandatory clearing transition we consider a quasi-experimental di↵erence-in-di↵erences approach. Centrally cleared Nordic stocks are matched with European equities that did not experience changes in clearing systems using propensity scores over multiple stock characteristics. Our sample contains 115 Nordic stocks that began clearing at the CCP in 2009. We consider an event window that begins with the mandatory implementation of central clearing in October of 2009 and, to avoid overweighting transient e↵ects, extends up to December of 2010.
We investigate first the e↵ect of the clearing reform on return volatility. In the general equilibrium world of Arrow and Debreu, there is no role for central counterparties, since all agents keep their promises. In real financial markets, however, default risk plays an important role (Dubey, Geanakoplos, and Shubik,2005). Since default risk cannot be fully diversified away, a clearing regime change a↵ecting default probabilities should also impact the behavior of asset prices and that of volatility in particular. Di↵erent clearing regimes are, in turn, associated with di↵erent risk management and margining protocols that can further a↵ect price volatility. For example, if a central clearing regime increases margin requirements in an economy with heterogeneous agents, everything else being constant, volatility would decrease (e.g.,Chabakauri,2013;
Bhamra and Uppal,2014;Rytchkov,2014). As we discuss in Section2, however, the exact relation between margins and volatility is still a subject of debate. Clearing systems contain additional design aspects and, to the best of our knowledge, there is no equilibrium framework in which each of these aspects can be directly linked to price volatility. We hypothesize that for asset classes such as equities, where counterparty risk is mitigated by the short length of time between the execution and settlement of a transaction, central clearing reduces volatility due to stringent collateral requirements.
The evidence in our study is broadly consistent with this hypothesis. Following the implementation of mandatory clearing, the average daily volatility of centrally cleared Nordic stocks decreased by 20 basis
6Of course, our paper cannot answer the question of whether central clearing is socially efficient. This would require identifying
elusive quantities such as the impact on the probability of a crisis and the expected loss during a crisis. The evidence on investor behavior during the voluntary phase simply suggests that central clearing was not perceived as privately optimal. However, this finding is still consistent with a situation in which central clearing is both privately and socially suboptimal.
points. This change is economically significant, since it implies a 8.77% decline from pre-reform levels. A similar decline of 10.16% is observed when an intra-day price range measure ofAlizadeh, Brandt, and Diebold(2002) is used to measure price dispersion. Consistent with our finding that traders do not clear voluntarily, we find no evidence of a volatility decline during the voluntary phase of the clearing reform from February to October of 2009.
Having analyzed the total e↵ect of the clearing reform on volatility, we next explore further whether the increase in margins and collateral costs associated with the reform is a plausible economic channel that may drive this strong negative response. To accomplish this, we analyze the cross-sectional behavior of the a↵ected stocks. Margins are not set on a stock-by-stock basis by the EMCF but, rather, are based on a portfolio approach.7 Therefore, we develop an empirical measure that closely approximates the EMCF’s
proprietary margin algorithm and aims to capture the incremental e↵ect on margins of holding a given stock. The cross-sectional analysis shows that the volatility decline is more pronounced for securities with higher pre-reform average margins: A one standard deviation increase in the margin measure is associated with a further 6.6% decline in volatility.
Price stability also depends on market liquidity and, therefore, we next analyze empirically whether the clearing reform a↵ects key liquidity measures. It is not obvious how central clearing will impact market liquidity. Stricter risk management safeguards can, on the one hand, negatively a↵ect the funding costs of liquidity providers and thus impair liquidity (e.g.,Gromb and Vayanos,2002;Brunnermeier and Pedersen
(2008)). On the other hand, increased operational efficiencies at CCPs, such as multilateral netting and lower counterparty risks, may increase participation in centrally cleared markets and thereby increase liquidity. We find that the reform causes an economically significant decline of 9.8% in trade volume for the a↵ected stocks. We do not find, however, a significant e↵ect on trading costs as measured by quoted bid–ask spreads, Amihud’s (2002) illiquidity measure, ILLIQ, or the Pastor–Stambaugh (2003) measure. Our finding that trading volume decreases, but not trading costs, suggests that the funding liquidity shock may have a↵ected buy-side traders more than market makers.
Stable prices are, of course, of little social value if they fail to reflect information available to traders.
7The EMCF computes margin requirements for a given investor using a portfolio risk approach, a procedure that is standard in
modern clearing houses and typically based on the SPAN methodology developed by the Chicago Mercantile Exchange (CME). For this reason, in Section5we consider an empirical measure that captures individual securities’ marginal e↵ect on total margin requirements.
It has been suggested that informed traders may be particularly a↵ected by an increase in funding costs (e.g.,
Yuan,2005), with potential negative e↵ects on market quality. To gain further insight in this regard, we explore the e↵ect of the reform on market efficiency and price informativeness. We find that information in prices does not deteriorate after central clearing is implemented. Taken together with the negative e↵ect on trade volume, this finding suggests that the reform a↵ected liquidity trading and informed trading evenly. In other words, the e↵ect on market quality measures does not allow one to conclude that central clearing disproportionately a↵ects a particular group of traders.
We conduct several robustness tests to ensure that the results reflect the e↵ect of the clearing reform, which are described in Section7. Importantly, we consider a second control group, the Nordic control, based on a set of Nordic equities that continued clearing bilaterally throughout the sample period. This group constitutes a natural control group, although stock matching is more difficult since these securities typically correspond to smaller, more illiquid firms. The decline in the volatility of stocks that began clearing centrally is also observed when using this alternative control group.
The remainder of this paper is organized as follows. Section3introduces the empirical hypotheses. Section3describes the specifics of the clearing reform and analyzes trading behavior during the voluntary clearing period. Section4describes the data sources and the empirical methodology. Section5analyzes the e↵ect of the reform on volatility. The e↵ects on trading activity, market liquidity, and price informativeness are discussed in Section6. Section7presents robustness tests, and Section8concludes the paper.
Literature Review. This paper is related to several strands of literature, both theoretical and empirical. We concentrate on the empirical work in this section and analyze the theoretical relations that motivate our tests in more detail in Section2.
First, our paper is related to the literature that studies the impact of clearing systems on asset markets.
Loon and Zhong(2014) investigate the impact of central clearing on counterparty risk and liquidity in the CDS market. They find evidence that counterparty risk, as captured by di↵erences in CDS spreads, decreases and that liquidity increases.8 Besides the fact that these authors analyze a di↵erent asset class, it is important
8Slive, Witmer, and Woodman(2012) also analyze the impact of the clearing reform on the CDS market but finds little evidence
on a reduction of quoted bid-ask spreads. It is important to note bothLoon and Zhong(2014) andSlive, Witmer, and Woodman(2012) rely on indicative bid-ask spreads. Entities posting these spreads do not have an obligation to transact at these prices and usually negotiate prices and terms (including collateral required) depending on the specific counterparty with whom they are transacting.
to keep in mind that, in the reform they study, central clearing is voluntary. In our study, however, the clearing reform is only voluntary for a limited period of time. We document very low participation levels in the CCP during such a voluntary phase. Of course, investors will decide to clear only those trades for which they perceive a benefit in doing so. This suggests that analyses of voluntary central clearing reforms, as byLoon and Zhong(2014), may overestimate the positive e↵ects of a CCP introduction. Also closely related are the studies byCase, Hughson, Reed, Weidenmier, and Wong(2013) andBernstein, Hughson, and Weidenmier(2014). These authors look at a clearing reform a↵ecting the NYSE in 1892 and find that bid–ask spreads decrease post reform and that, consistent with our findings, volatility decreases as well. There are, however, important di↵erences between these studies and ours. First, in contrast to modern CCPs, the NYSE clearinghouse in 1892 only had a netting role and did not set additional collateral requirements. More broadly, it is difficult to extrapolate the impact of central clearing reforms during the 19th century to present times given that the related trading environment and economic institutions have significantly changed since then. Milestones such as the creation of the U.S. Securities and Exchange Commission, the Security Exchange Act of 1934, the Federal Reserve Board, and Regulation T, for instance, made broker defaults in equity markets rare in recent times, though they were common in the 1890s.
Our finding on the lack of voluntary clearing is consistent with the idea that market participants perceive the CCP costs to be higher than its benefits. This suggests that, in cases where a CCP is indeed socially desirable, an important coordination issue may arise. The fact that the perceived net private benefits of a CCP are low is consistent with the adverse selection argument against a CCP (Pirrong,2011a). Loss mutualization homogenizes the underlying credit risk of all the CCP members. The most creditworthy market participants may see fewer advantages of their stronger credit quality with CCP clearing. Furthermore, agents may fear the spiraling e↵ect of margin increases during a downfall and the associated increase in systemic failures. The analyses of ,Acharya and Bisin(2011),Koeppl(2013), andBiais et al.(2014), for example, stress some of these concerns.
Our analysis highlights the role of collateral costs in understanding the e↵ect of a clearing reform. We are not aware of theoretical models that predict the e↵ect of central clearing on the general properties of asset prices. There are, on the other hand, several theoretical contributions to our understanding of the
relation between margins, collateral cost, and volatility. As we will discuss in Section2, there is no final consensus on this issue. The empirical evidence on the e↵ect of margins is equally mixed. Hardouvelis (1990;
1992;2002) finds that higher collateral dampens price movements.Hsieh and Miller(1990), among others, find no relation between margins and volatility. Although volatility decreases post reform in our study, it is important to consider that direct comparison with these papers is not straightforward. Our focus is on changes in clearing procedures, which involve, in turn, changes in risk management systems such as the adoption of initial margin, as opposed to pure changes in margin requirements (e.g., modifications to Regulation T required ratios).
Our results also contribute to the current discussion on the optimal way of clearing OTC derivatives,9
which, for the most part, lacks reliable evidence. Although there are important di↵erences between securities and derivatives, the nature of, first, the counterparty credit risk that arises prior to settlement and, second, industry standards for risk management such as portfolio margining is essentially the same for both asset classes (Bliss and Steigerwald,2006). Of course, the relative importance of each of these factors is likely to di↵er across di↵erent asset classes and, consequently, one needs to consider those characteristics when extrapolating our results. Since we study equities, the relative impact of a reduction in counterparty risk is naturally lower than in the case of derivatives (e.g., due to the length of time between the execution of a transaction and settlement). This observation and the fact that trading is anonymous in electronic equity markets motivate our emphasis on funding costs. Furthermore, counterparty risk is not necessarily the dominant underlying force for all derivatives. An interesting finding ofArora, Gandhi, and Longsta↵(2012) is that the magnitude of counterparty risk pricing in CDS markets, a canonical example of a counterparty risk-sensitive market, is vanishingly small.
2 Hypotheses
Motivated by the characteristics of the clearing reform and building upon insights from the literature review, we provide in this section an overview of our research questions and hypotheses. Our goal is to present a
9For example,Duffie and Zhu(2011) highlight that netting inefficiencies may occur with multiple CCPs,Santos and Scheinkman
(2001) analyze whether competition leads to a deterioration of required credit standards for clearing members andKoeppl, Monnet, and Temzelides(2012) show the conditions under which a central clearing house is socially superior to bilateral clearing.
brief account of the specific arguments and observations related to each hypothesis.
H 1. Market participants find it privately optimal to clear through the CCP, implying low coordination costs for joint migration from bilateral clearing. Consequently, the central clearing volume is high during the voluntary phase.
The rationale of a clearing system reform generally relies on its benefits for the financial system and the economy. As will be discussed in Section3.1, however, central clearing can impose higher costs than bilateral clearing. If investors perceive the private benefit of central clearing to be higher than its cost, one would expect high levels of participation during the voluntary phase. If, on the other hand, traders perceive the costs of central clearing to be excessive and/or issues such as adverse selection and the reliability of the clearinghouse itself are important concerns (e.g.,Pirrong,2011b), one would observe low voluntarily participation and the possibility of a large-scale coordination issue. We empirically study voluntary participation in Section3.2. H 2. Central clearing reduces return volatility.
In equilibrium asset pricing models with heterogeneous agents (e.g.,Cochrane, Longsta↵, and Santa-Clara,2007;Garleanu and Pedersen,2011;Chabakauri,2013; Bhamra and Uppal,2009;2014;Rytchkov,
2014), risk sharing makes returns more volatile than fundamentals (e.g., dividends). To the best of our knowledge, the literature does not explicitly address the link between counterparty risk and asset volatility. Intuitively, one would expect lower default probabilities to be associated with more stable prices. The link between margins and volatility is clearer: Binding margin constraints reduce the di↵erence in the portfolios that the two groups hold in equilibrium, thereby curbing the additional volatility produced by dynamic trading. For example, when agents di↵er in risk preferences, the more risk-tolerant investors borrow from the more risk-averse investors thereby increasing exposure to risky assets. Margin constraints may force the risk-tolerant group to reduce exposure in the risky asset and thus reduce risk–sharing-related volatility. Because the considered clearing reform increased margins, as will be discussed in Section3, one would then expect a decline in price volatility. The exact relationship between margins and volatility is, however, still a subject of debate.Chowdhry and Nanda(1998) point out that high margins promote stability, since they limit leverage and fluctuations in collateral value.Kupiec and Sharpe(1991) analyze a model with two overlapping
generations in which risk aversion is heterogeneous within and changing across generations. They show that the e↵ect of margins on volatility depends critically on the structure assumed for heterogeneity: Aggregate risk aversion changes due to either variations in the proportion of risk-tolerant agents or variations in their risk aversion. The state of the world in which margins are binding is sensitive to the source of aggregate risk aversion change. Introducing margin requirements reduces volatility when risk aversion itself, rather than the fraction of risk-averse agents, is time varying.10 Brunnermeier and Pedersen(2008) andPirrong(2011a)
argue that, as long as margins are rigid, that is, not contingent on fundamental value shocks alone, higher margins exacerbate price movements. In other words, to the extent that capital constraints are more likely to bind in downturns, they might lead to fire sales, which, in turn, set o↵ a negative spiral.
H 3. The price volatility reaction is stronger for securities with high margin cost.
As outlined above, margin requirement changes associated with a CCP are a potential source of volatility movement. Following this argument, one would naturally expect securities with higher marginal impact on margin costs to experience greater changes in volatility. If, for example, higher margins reduce price volatility, such a decline will be more pronounced for securities with high margins. Moreover, this initial change can lead to amplification e↵ects, given that more highly volatile securities are those that require more collateral in the first place (e.g.,Gromb and Vayanos,2015).
H 4. Trading activity and market liquidity are a↵ected by the introduction of the CCP.
It is not obvious whether central clearing will enhance or impair market liquidity. Changes in risk management safeguards, such as collateral and/or margin requirements or clearing fees, can negatively a↵ect the funding liquidity constraints of market makers and other participants that provide liquidity to the market (e.g.,Gromb and Vayanos,2002andBrunnermeier and Pedersen(2008)). Furthermore, margins may increase after a price shock, inducing traders who cannot meet the margin requirements to liquidate their positions and creating a negative liquidity spiral. On the other hand, increased operational efficiencies at CCPs such as multilateral netting, combined with the CCPs’ ability to mitigate counterparty risk and equalize that
10Similarly,Wang(2013) argues that the e↵ect of margins on volatility depends on whether it is binding for liquidity demanders
risk across market participants may increase participation in centrally cleared markets and thereby increase liquidity.11
H 5. The CCP reform negatively a↵ects arbitrageurs and informed speculators, hurting market efficiency and information transmission into prices.
Among the considerations in assessing the e↵ect of the clearing reform is the issue of which type of trader is more likely to be a↵ected. Arbitrageurs are a↵ected by funding constraints, which bind more frequently under tighter margin rules and may impair market efficiency and the law of one price (e.g.,Liu and Longsta↵,2004;Garleanu and Pedersen,2011; see also the references inVayanos and Gromb(2010)). Funding constraints can, of course, a↵ect other market participants. If, for example, high margin requirements discourage liquidity traders but not informed traders, the e↵ect will be to increase price informativeness. If such a connection were reversed, price informativeness would be impaired. In the model ofYuan(2005), for example, funding constraints interact with asymmetric information. Informed investors facing borrowing constraints are less able to transmit information due to exposure to, say, negative shocks to prices that make such constraints bind. When a small negative shock occurs, for example, uninformed investors face uncertainty as to whether informed investors are restricted in transmitting information to prices, thus demanding a large information disadvantage premium and exacerbating the price decline. Similar interactions impairing information transmission in borrowing-constrained environments are present inAlbagli(2011) and
Cespa and Vives(2015).
3 The Clearing Reform
We summarize in Section3.1the main features of the transition to central clearing in the Nordics, as well as a detailed account of the timeline of the implementation. In Section3.2, we analyze central clearing during the voluntary phase of the reform (H1).
11Conversely, as argued byFontaine et al.(2012), central clearing may instead reduce liquidity if some market participants are
3.1 Institutional Background
To mitigate default risk and help enforce promises, a CCP generally combines the following provisions: margining, novation, a default fund, and the mutualization of loses. All of these features are present in the reform considered in this paper. Next, let us next briefly discuss the addition of these provisions and how they impacted the pre-reform clearing system.
All CCPs adopt some form of margin-based risk management based on a legally enforceable and explicit margining system. Bilateral margin arrangements, on the other hand, tend to be relatively customized and may not require the posting of the full margin. In principle, collateral could increase or decrease with the move to central clearing. This will depend on the margining policy of the CCP and the margining rules applying to non-cleared trades, as well as the netting efficiency of central clearing, which is a function of the number of CCPs a participant clears his or her trades through (Duffie and Zhu, 2011). In cases where participants clear all their trades through a single CCP, netting efficiency is enhanced and collateral requirements could, in principle, decrease. Generally, however, CCPs tend to have higher margin requirements than bilateral clearing arrangements for the following reasons. First, the majority of bilateral arrangements provide only for the exchange of the variation margin, covering fluctuations in the value of the asset or underlying contract (Gregory,2014). Centrally cleared markets also require initial margin, covering the potential cost of replacing the underlying contracts in case the original counterparty defaults. Although it reduces counterparty risk, an initial margin is expensive. Second, collateral liquidity requirements typically increase with central clearing: Bilateral arrangements typically allow margins to be posted in relatively illiquid assets. Third, CCPs set margins solely based on the risks of the transactions held in each member’s portfolio. The initial margin typically does not depend on the credit quality of the institution posting it. Bilateral margin arrangements, on the other hand, usually depend on credit quality and are open to dispute.
Equities in Denmark, Finland and Sweden were traditionally settled bilaterally by a given national CSD. The CSDs were owned by local banks and most large domestic banks were members as well. Local members o↵ered indirect access to some small domestic and foreign banks. The system worked quite efficiently, though non-members paid higher fees compared to those set post reform. A few defaults were observed in the recent history before the reform. The most recent local bank failure occurred in 1991. More recent failures include Lehman Brothers and the three largest Icelandic banks (Glitnir, Kaupthing, and Landsbanki) in 2008. Table1
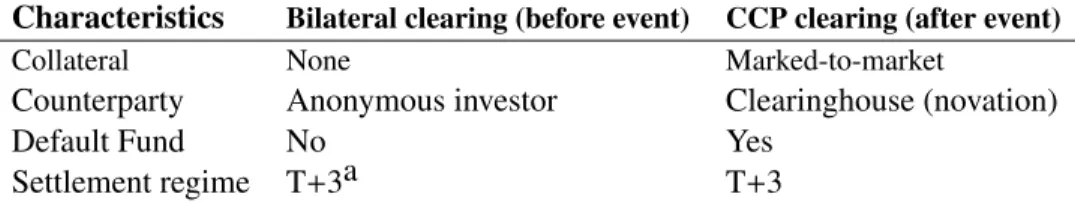
Table 1: Bilateral and CCP clearing in Nordic equity markets
Characteristics Bilateral clearing (before event) CCP clearing (after event)
Collateral None Marked-to-market
Counterparty Anonymous investor Clearinghouse (novation)
Default Fund No Yes
Settlement regime T+3a T+3
a: Danish and Finnish markets operated with a T+2.5 settlement cycle.
summarizes the main features of the bilateral system. Prior to the reform, the post-trade process was based on “trust”: There was no default fund and banks did not post collateral with the CSD. Thus, collateral costs for
firms trading these securities increased with the reform.12In all cases, cash was used to settle.
In the aftermath of the international financial crisis, bilateral clearing was called into question by a significant portion of the international community, catalyzing the reform in the Nordics. The introduction of the EMCF as the single clearinghouse represented the most important clearing reform in the history of these economies. As a CCP, the EMCF began acting as the counterparty for both buyers and sellers of securities. Importantly, the EMCF also required that all clearing members post collateral based on their yet-to-settle trade portfolio. Collateral requirements were marked to market and revised daily. To hedge against extreme tail events, members were also required to contribute to a default fund.13
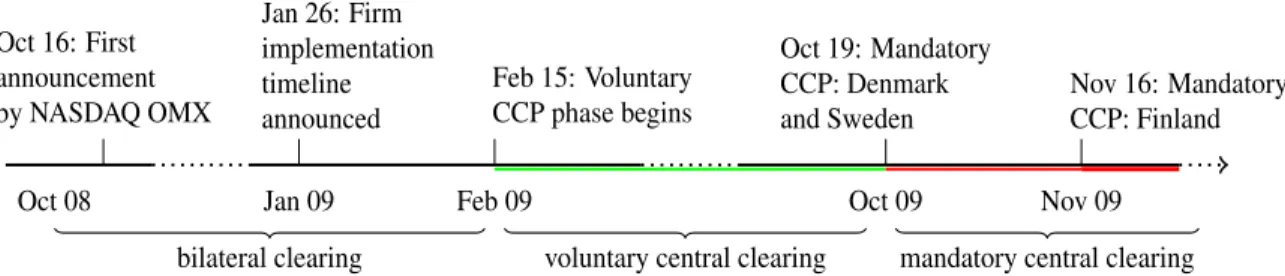
Timeline of the reform. On October 16, 2008, NASDAQ OMX, the dominant incumbent stock market, first announced a plan to introduce CCP services through the European clearinghouse EMCF.14A memorandum
of understanding was signed with this clearinghouse, stating counterparty risk reduction as the first sought after benefit of the reform. NASDAQ OMX announced that outsourcing CCP services to the EMCF was made contingent, among other technical aspects, on the completion of an equity stake in the clearinghouse.
12Although the systems in these three countries shared most of their features, the specific rules were not identical. In particular,
the delivery system was T + 3 in Sweden and T + 2.5 in Denmark and Finland. The expression T + j denotes that settlement (the delivery of securities to net buyers and payments of money to net sellers) takes place j days after the trade day T.
13Based on the 2009 EMCF Rulebook, the contributions that clearing members are required to make to the clearing house default
fund are (i) base deposits of Euro 1,000,000 for a direct clearing participant and EUR 3,000,000 for a general clearing participant and (ii) a percentage (nearly 15%) of a moving average of the end-of-day aggregate margin. In addition to changes in risk management costs, investors may face di↵erent operational costs after a clearing reform. We focus on risk management costs since, according to local experts, operational costs were relatively small before the reform. One exception is the case of foreign banks that were not direct clearing members and thus faced higher clearing costs. However, as the Appendix shows, most global financial institutions actively operating in the Nordics were clearing members.
14A small and nascent exchange, Chi-X, began trading and clearing through the EMCF a limited number of Nordic stocks earlier
The contingent aspect introduced some degree of uncertainty into the e↵ective implementation of the reform. The initial timeline specified January 2009 as the target month for a voluntary CCP clearing program and June 2009 as the target month for mandatory CCP clearing. In January 2009, however, these dates were changed to February and October 2009. Mandatory CCP clearing e↵ectively began on October 19, 2009 in Sweden and Denmark and on November 16, 2009, in Finland.15 The timeline of events is summarized in
Figure1. Oct 16: First announcement by NASDAQ OMX Jan 26: Firm implementation timeline announced Feb 15: Voluntary CCP phase begins Oct 19: Mandatory CCP: Denmark
and Sweden Nov 16: MandatoryCCP: Finland
Oct 08 Jan 09 Feb 09 Oct 09 Nov 09
bilateral clearing voluntary central clearing mandatory central clearing Figure 1: Timeline of the clearing reform.
3.2 Do Traders Clear Voluntarily?
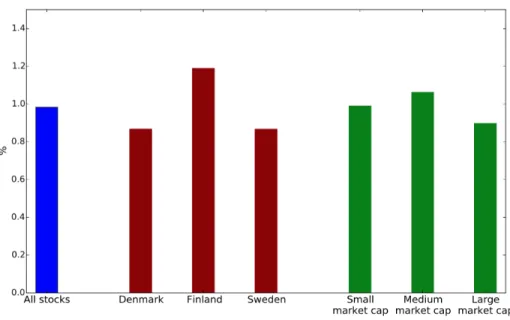
A key feature of the central clearing reform in this paper is period in which traders participation is strictly voluntary. This allows us to empirically study H1and gain insight on whether central clearing is perceived as privately optimal by traders and financial institutions. To this end, we use a proprietary data set provided by the EMCF that consists of detailed information on individual trades by clearing members. Figure2shows the proportion of centrally cleared trades between September 1, 2009, and October 8, 2009, the month prior to the mandatory phase.16 The volume cleared through the EMCF was 50.42 million shares out of a total of
5.12 billion shares traded. Consequently, less than 1% of the NASDAQ OMX volume was centrally cleared voluntarily. Moreover, 111 out of 187 stocks had no trades cleared by the clearinghouse. Figure2also shows
15A pilot implementation involving the mandatory clearing of nine mid-cap stocks (three Danish, three Finnish, and three Swedish
stocks) started on October 9, 2009. Conversations with local experts indicated that the later implementation for Finnish stocks was not related to price or volatility responses considerations, the focus of the empirical tests in the paper. Instead, it was due to concerns of the Finnish dealers’ association regarding operational risks associated with the new clearing protocols.
16The interim period between voluntary and mandatory central clearing would, according to the CCP, allow all clearing members
to ready their systems for the migration. We concentrate on the last month of the voluntary phase, as opposed to the entire eight-month period, to avoid reflecting operational delays (e.g., firms’ internal technology compliance) as much as possible. Focusing on the month prior to the deadline also helps reducing concerns about potential “wait-and-see” delays in case firms questioned the credibility of the announced timeline.
Figure 2: Centrally cleared volume as a fraction of total traded volume during the voluntary clearing phase.
no significant di↵erences for each of the three a↵ected countries. In all three cases, the participation of central clearing stayed below 1.2%. Moreover, participation levels are consistently low across stocks, regardless of their market cap. For all a↵ected securities, centrally cleared volumes ranged between 0.11% and 2.81%. These figures lead us to conclude that investors perceive the cost of central clearing to be higher than the associated private benefit.
The weak incentives to voluntarily participate in the equity clearinghouse are consistent with previous observations in derivative markets. The Chicago Board of Trade, for example, did not have a CCP function for 30 years until 1925 and adopted one partly in response to government pressure. The London Metal Exchange did not have a CCP until 1986 and also responded to regulatory pressure in adopting one. Similarly, the majority of over-the-counter (OTC) derivatives did not move to central clearing by means of market forces. While LCH.Clearnet has been clearing OTC derivatives (mainly IRSs) since 1999, the majority of OTC products have remained out of clearinghouses. By the end of 2010, the year when Dodd–Frank Act was approved by U.S. Congress, less than 10% of CDSs and almost no OTC foreign exchange derivatives were cleared through CCPs.
related to the consequences on asset prices volatility? Or liquidity? Or a more general phenomenon? To shed light on this issue, the following sections investigate the e↵ects of the clearing reform on price stability and market quality measures by exploiting the mandatory nature of the second phase of the clearing reform.
4 Data and Empirical Design
4.1 Data and Sample Selection
To compute our volatility and liquidity measures, we use data from Thomson Reuters Tick History and Datastream. The data set consists of daily trade information for composite index stocks in the 20 largest European countries by gross domestic product (including the three “treated” Nordic countries). For European securities not denominated in euros, we use monthly bilateral exchange rates from the European Central Bank.17 The sample period ranges from January 2008 to December 2010. In choosing our estimation window,
a trade-o↵ exists between having, on the one hand, enough observations and, on the other hand, avoiding contaminating factors such as additional policy interventions, which may bias the results over a longer sample. More specifically, our sample begins shortly after the implementation of Markets in Financial Instruments Directive 1 in November 2007. We also consider the fact that the share of high-frequency trading activity in the Nordic markets increased significantly in 2011 (from around 8% to 16%). To avoid potential bias due to the latter, we do not include 2011 in our estimation sample.
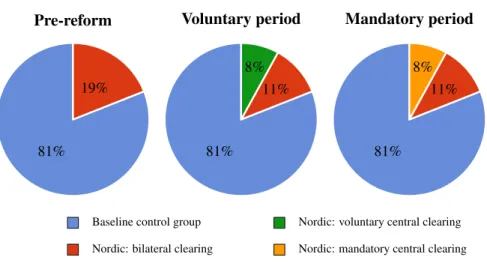
Figure3illustrates the composition of our sample, which contains three groups of stocks. First, the sample contains 129 Nordic stocks a↵ected by the clearing reform (the treated group hereafter). Second, 1271 European equities that did not experience simultaneous changes in their clearing systems are the baseline control group. Third, there is a group of 177 Nordic stocks that continued to clear bilaterally and did not transition to central clearing (the Nordic control group). These stocks were exempted and hand-picked by the local brokerage community to hedge against unforeseen problems associated with the migration to central clearing by keeping the old infrastructure active. The exempted stocks are, however, typically smaller, less actively traded stocks. Although, in principle, the una↵ected Nordic stocks represent a natural control group, their characteristics pose some challenges to the matching procedure due to the lack of common support
17These currencies are the Swedish/Danish/Norwegian krona, Swiss franc, British pound, Hungarian forint, Romanian leu, Polish
of some matching variables. Therefore, these stocks serve as an additional control group as opposed to the baseline control group (we discuss this group further in Section7).
The construction of the baseline control group is as follows. We consider all European equities that are part of major indexes as the universe of potential matches. We see European stocks as a natural starting point, since they are listed and trade in markets with economic institutions that are very similar to those in the Nordics and are also exposed to several common shocks, such as changes in European Union regulation, shocks to capital flows, and/or terms of trade. Each stock that satisfies this qualitative restriction becomes a potential match for a treated stock. The considered matching criteria include pre-reform values of market capitalization, quoted bid–ask spreads, turnover ratios, price-to-book ratios, and the stock beta, which is computed through a single-factor model using the STOXX Global 1800 index.18 The propensity score
algorithm thus selects 822 stocks (64.7%) from the control pool that are e↵ectively matched to the treated group.
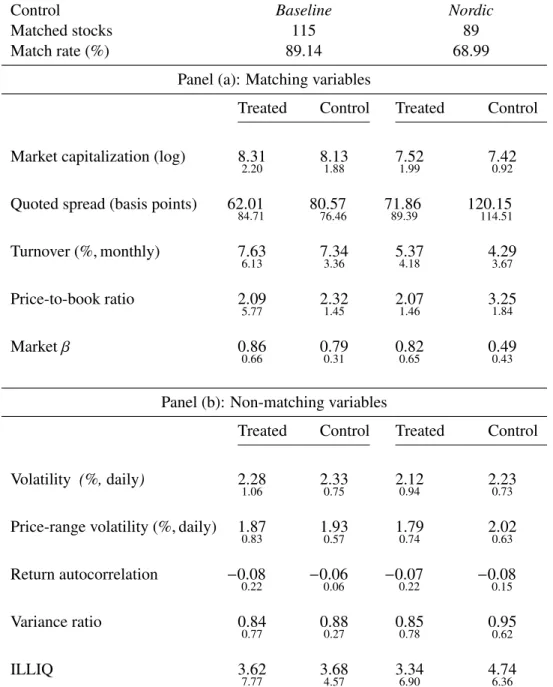
[ insert Table2here ]
Table2 displays the descriptive statistics for our sample. Panel A shows the mean and standard deviation values of matching variables for both the baseline and Nordic control groups. The baseline control group displays a relatively high matching rate of 89.1% (115 out of 129 treated stocks are successfully matched). The number of matched stocks with the Nordic control group is lower, at 89, for a matching rate of approximately 69%. The lower matching rate for the Nordic group indicates potential lack of common support in one or more matching variables among the groups. Stocks in the Nordic control group display, on average, lower market capitalizations and higher illiquidity levels, as reflected in higher values of the quoted spread and lower values of turnover. They also display lower betas. We therefore exploit the stocks as an additional control (the Nordic control group) pool only in our robustness tests in Section7.
4.2 Empirical Methodology
Matching Procedure. To match treated and control stocks, we use caliper propensity score matching. This method allows for one-to-many matching and yields more stable propensity scores than nearest-neighbor
18The e↵ect of mandatory clearing on the measures of price volatility is robust to replacing the global market index with a
Figure 3: Composition of the Sample
Pre-reform Voluntary period Mandatory period
Baseline control group Nordic: bilateral clearing
Nordic: voluntary central clearing Nordic: mandatory central clearing 81% 19% 81% 11% 8% 81% 11% 8%
matching, especially when changing the set of covariates in the probit regression. The first step in the matching procedure is to estimate a probit model where the dependent dummy variable takes the value one for treated stocks, an event that occurs with probability igiven by
i = 0+ 1LogMarketCapi+ 2QuotedSpreadi+ 3Turnoveri+ 4 i+ 5Price-to-Booki ,
where (·) is the normal cumulative distribution function. The fitted value ˆiis stock i’s propensity score.
We remove from the sample treated stocks with a score larger than the maximum score across control stocks, as well as control stocks with a score lower than the minimum score across treated stocks. Therefore, the treated and the control groups have common support.
Each treated stock is assigned a set of control stocks. The maximum distance between the scores of the treated and control stocks is given by the caliper size . Therefore, each treated stock i is matched with the set n
j, such that ˆi ˆj o. We followAustin(2011) and select = 0.2 ˆi; that is, the treated and matched
stocks should not be further apart than 20% of the standard deviation of fitted scores.
Di↵erence-in-Di↵erences Specification. For each treated stock i, month t, and variable of interest Y, the di↵erence between the treated and the control is
Yit=Yit 1
Ni
X
j
where Niis the number of matched controls for treated stock i. The impact of the clearing reform on trading
variable Y is captured by the coefficient ✓M in the following regression equation:
Yit= ✓⇥ dccp+ i+errorit, (1)
where i captures fixed e↵ects and dccp is a dummy variable taking the value one for October 2009, the
mandatory CCP implementation month.
The model in equation (1) is estimated by ordinary least squares and standard errors are computed employing the double-clustering methodology proposed byPetersen(2008). This procedure allows residuals of di↵erent stocks to be correlated on a particular date and the residuals of any security to be correlated across all dates in the sample. Residuals of di↵erent stocks on di↵erent dates are assumed to be uncorrelated. This approach yields more conservative test results than standard robust alternatives such as Huber–White and Newey–West estimators.
5 Price Volatility
This section discusses the empirical results on volatility tests, corresponding to H2and H3.
5.1 Impact on Price Volatility
We begin the analysis by studying the impact of central clearing on price volatility, measured as the square root of the monthly average of daily squared returns. To substantiate the relation between the reform and price stability, we also consider as a second metric the monthly average of the price range volatility measure ofAlizadeh et al.(2002), which is given by 1
2pln(2)ln
⇣Highi⌧
Lowi⌧
⌘
, where Highi⌧and Lowi⌧ are the highest and
lowest trade prices for stock i on day ⌧, respectively.
Figure4displays the evolution of the volatility di↵erences between treated and matched control stocks for the sample period. Relative to the control group, both volatility metrics decrease for treated Nordic stocks around the CCP implementation month. There is no indication of reversal in the months that follow the implementation. As discussed in Section7, there is no evidence of such a decrease for the Nordic stocks that continued to clear bilaterally.
[ insert Figure4here ]
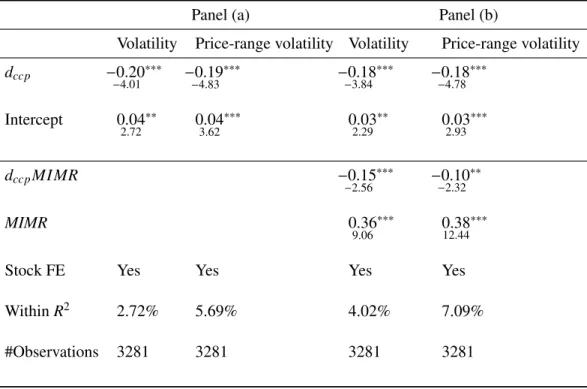
Panel A of Table3reports the estimation results for our regression model in equation (1). Following the mandatory CCP reform, the daily volatility of treated stocks declines by 20 basis points relative to the control group. The decline in volatility is economically significant: It represents a 8.77% decrease relative to a pre-reform average of 2.28 percentage points. The sign and magnitude of the e↵ect are robust across the two volatility measures.
[ insert Table3here ]
5.2 Margins and Cross-Sectional Heterogeneity
In this section, we investigate the empirical relation between margins and the impact on price volatility (H3). In this regard, it is important to consider that the CCP requires margins that are based on a member’s (yet-to-settle) trade portfolio, not on an individual security basis, which makes the calculation of a stock-specific margin proxy non-trivial. The margining technology that the EMCF uses, the in-house correlation haircut model (CoH), is similar in spirit to the now standard SPAN methodology of the CME but remains proprietary and mostly opaque. The most detailed public description of the in-house correlation model available is by the Dutch Central Bank (De Nederlandsche Bank, 2011), which states that the computation of the margin requirement for a given investor (i) takes into account the correlation between the various products that are part of the investor portfolio, (ii) determines the risk factors that have the greatest impact on the portfolio, (iii) shifts these components to find the worst-case scenario (maximum loss), and (iv) attributes back the contribution per product in the determined worst case.
Given the margining system, we develop a methodology for computing empirical measures of the marginal impact on the margin requirements for each security. The natural first step in developing a stock-specific margin requirement measure is to consider a representative investor who trades the market portfolio. The “maximum loss” that this investor’s portfolio is subject to is taken to be proportional to the standard deviation of the portfolio return. The margin requirement for individual securities is computed by changing portfolio weights marginally to capture each security’s marginal risk contribution. Formally, let the market portfolio contain I securities with weights given by the column vector n. We assume that the return of each
security can be represented by the sum of a single market return process and an uncorrelated idiosyncratic component. The variance matrix of returns, ⌃, then has generic elements given by ii = 2i 2M+ i and i j = i j 2M, where i represents the idiosyncratic variance component of the securities’ returns. The
variance of the market portfolio can be written as nT⌃n, and the marginal impact of security i on total portfolio
risk is given by @ @ni p nT⌃n = ni ii+ P j,inj i j p nT⌃n . (2)
We then define security i0s marginal impact on margin requirements (MIMR) by re-expressing the left-hand
side of equation (2) using the expressions for iiand i j above and multiplying by a scaling constant:19
MIMRi ⌘ constant ⇥ M i+ni i M
!
. (3)
Intuitively, as the individual weight of each security in the portfolio approaches zero, margins are only a↵ected by the systematic components of securities returns.20 The risk measure in equation (3) finds a natural
empirical counterpart by replacing each term on the right-hand side with the corresponding estimate.21 The
cross-sectional margin measure is computed using pre-reform data to address endogeneity concerns, i.e., that MIMRiitself is a↵ected by the CCP reform.
The single-index model we consider here represents a simple first-order approximation to the margin algorithm used by the CCP. To verify the accuracy of the proxy, for each trader and day in the sample period, the CCP computed the amount of additional margin that a trader had to post if a security position was changed marginally. These incremental (actual) margins were averaged across days and traders and the overall average
19The scaling constant value that we consider is seven. This value is mentioned by Fortis (the EMCF’s main owner at the time) in
its 2009 annual report.
20Indeed, the first component of MIMR is much larger than the second in our sample. The empirical mean of MIMR across all
securities is 7.49 cents per euro position, while the first component of the above sum has a mean of 7.42 cents per euro position. The relative contribution of the second term ranges from virtually zero to a maximum of 18% of MIMR, with a mean and a median around 0.5%.
21The total margin in real markets is the sum of two components: an initial margin and a variation margin. The initial margin
helps the CCP to hedge against future price changes. The variation margin reflects realized profits or losses on a yet-to-settle portfolio. The proxy MIMR replicates the initial margin component, since the variation margin is on aggregate equal to zero. As an illustration, consider a single-security example where clearing member XYZ buys one unit of a stock at $100. The following day, the security price drops to $90 and XYZ buys one more unit. Suppose volatility is 3% and the CCP uses seven standard deviations to insure itself. Thus, XYZ needs to post an initial margin of 2 ⇥ $90 ⇥ (7 ⇥ 0.03) initial margin, plus $100 $90 = $10 variation margin, adding to $47.8. Intuitively, this amount represents the ‘replacement value’ for the CCP. That is, if the CCP took over the XYZ’s commitment, it would spend $190 to buy two units, which would then be resold at an unknown future value (potentially seven standard deviations lower).
was given to us to compare with our empirical proxy. The resulting distributions are shown in Figure5. We note that the distribution implied by MIMR does a remarkably good job approximating that generated using the EMCF’s proprietary algorithm (Spearman rank correlation of 0.83).
To assess the cross-sectional impact of the clearing reform, we augment our basic regression design as follows:
Yit= ✓1dM+ ✓2MIMRidM+ ✓3MIMRi+ i+errorit. (4)
The coefficient ✓2captures the cross-sectional heterogeneity related to MIMR. We expect this coefficient to
be negative according to H3. Panel B of Table3reports the estimation results. We note that stocks with higher MIMR values display a stronger volatility decline than securities with a lower margin impact. Controlling for pair fixed e↵ects, a one standard deviation increase in the value of MIMR induces an additional average volatility drop of 15 basis points.
6 Impact on Liquidity and Information Measures
This section discusses the empirical results related to trading activity, liquidity, and information (H4and H5). The general result is that the CCP reform reduced trading volume meaningfully, but it did not impair market quality as captured by standard measures of liquidity and informational efficiency.
6.1 Impact on Trading Activity and Trading Costs
We evaluate whether the implementation of mandatory clearing a↵ects market liquidity. We consider standard low-frequency measures of liquidity.22 In particular, we compute the trading turnover as a direct measure of
trading activity and three measures of trading costs: quoted spreads at the closing, Amihud’s (2002) ILLIQ, and the Pastor–Stambaugh (2003) liquidity measure. Turnover is computed as the ratio of month t’s traded volume to the market capitalization of stock i. The quoted spread represents the monthly average of the bid–ask spread computed at the closing. The ILLIQ measure is normalized as byAcharya and Pedersen
22We do not consider high-frequency measures of liquidity due to both the long-term nature of the analysis, spanning over two
years of European stock data, and data limitations. For example, in contrast to the United States, there is no consolidated tape in European markets that allows for consistent calculations of high-frequency liquidity measures over an extended period.
(2005).23 The Pastor–Stambaugh liquidity measure for stock i in month t is the ordinary least squares estimate
of i,tin the following regression
Returnei,d+1,t= ✓i,t+ i,tReturni,d,t+ i,tsgn⇣Returnei,d,t⌘Volumei,d,t+errori,d,t,
where Returni,d,t is the return on stock i on day d in month t, ReturnS TOXX,d,t is the STOXX Global 1800
return on day d in month t, Returne
i,d,t=Returni,d,t ReturnS TOXX,d,t, and Volumei,d,tis the euro volume for
stock i on day d in month t.
[ insert Table4here ]
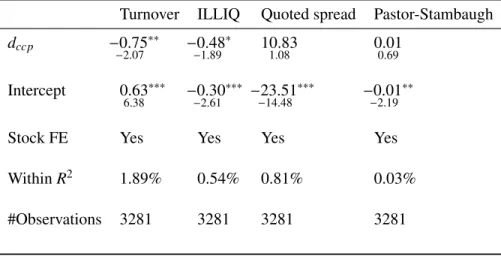
Table4displays the estimation results, where the corresponding liquidity measure acts as the dependent variable in regression (1). Following the adoption of central clearing, turnover in Nordic stocks shows a significant decline of 75 basis points. This e↵ect is economically significant, since it represents a decline of 9.8% relative to the pre-event average. However, there is no systematic evidence of significant changes in trading costs. Although we observe a marginally significant improvement in the level of ILLIQ, changes in bid–ask spreads and the Pastor–Stambaugh measure are not significantly di↵erent from zero.
6.2 Impact on Information Measures
Is the decline in volatility and trading activity mainly due to informed traders? This could happen if, for example, higher funding costs acted negatively on information acquisition incentives. If that were the case, one would expect to observe less informative prices (Grossman and Stiglitz,1980). Additionally, lower trading volumes may signal lower liquidity and negatively impact the marginal value of information for speculators (Holmström and Tirole,1993).
Following the intuitions above, we analyze whether the clearing reform a↵ected information in prices in two di↵erent ways. First, we study whether there was any e↵ect on “pricing errors,” that is, transitory shocks to prices. We analyze both return autocorrelations and variance ratios. We compute return autocorrelation as the monthly average of the daily (one-lag) autocorrelations of stock returns. The variance ratio (e.g.,
23The normalized value of ILLIQ equals min{0.25 + 0.30ILLIQ
i,tPt 1M ,30} for each month t and stock i, where PMt 1is the ratio of
Hasbrouck,1988) is computed as the ratio between the weekly variance and five times the daily variance of a given stock in a given month. Naturally, the variance ratio is smaller than one if prices exhibit short-term reversals.
Second, we study whether prices became more, or less revealing of fundamental information. To measure price informativeness, we followDurnev et al.(2004) andFernandes and Ferreira(2009), among others, and construct a statistic based on firm-specific return variation relative to market-wide variation. In particular, we compute log✓ 2ie
2 i 2ie
◆
for each stock i, where 2
i is the variance of stock i’s return and 2ieis the
variance of the residuals of a single-factor market model, using the STOXX Global 1800 index as the market portfolio. Note that the measure is equivalent to a logistic transformation of 1 R2
i.
[ insert Table5here ]
Table5displays the empirical results. Contrary to the predicted deterioration in information measures, we note that the reform does not have a significant e↵ect on return autocorrelation or the variance ratio (although there is a marginally significant decline in the latter)24and that there is small positive e↵ect on the
price informativeness statistic. The change in this statistic from -0.23 before the event to -0.23+0.18=-0.05 after the event implies that the R2declined from 0.56 to 0.51, a reduction of almost 10%.
6.3 How Does Central Clearing A↵ect Traders?
Our empirical results show that trading volume decreased significantly due to the implementation of central clearing in the Nordics. We find that total trade volume decreased by 11%. An interesting issue is whether this decline in trading activity a↵ects certain traders more than others. Data limitations do not allow us to observe directly what specific fraction of this change is attributable to changes in liquidity demand or supply. The fact that trading costs do not change significantly suggests, however, that the competitive structure of the market making sector was not altered. Market makers are thus likely to realize similar profits per trade but, everything else being constant, experience a drop in total activity of nearly 1/10. Let us consider liquidity demanders next. Theoretical models of trading activity predict that a decline in liquidity trading results in
24Return autocorrelation is naturally related to price reversals, which can also be seen as a measure of asset liquidity (e.g., Vayanos and Wang,2013b). In this regard, the absence of a significant e↵ect on this measure is consistent with the findings on bid–ask spreads and ILLIQ in Section6.1.
an increase of illiquidity that is reflected in higher values of price impact measures, such as Kyle’s or in larger price reversals (Vayanos and Wang,2013a). We do not observe deterioration in the value of these measures, suggesting that liquidity traders are not disproportionally a↵ected by the clearing reform. This view is reinforced by the finding that, in an environment with lower trading activity, price informativeness and efficiency are not significantly a↵ected, which suggests that the e↵ects of the clearing reform are evenly distributed across both liquidity and informed traders.
In interpreting these results, we believe it is important to consider both the direct and indirect e↵ects of the clearing reform. On the one hand, tighter funding constraints may be responsible for the decline in total trading activity. On the other hand, the causal negative e↵ect on volatility may operate as an indirect factor that enhances market liquidity (e.g.,Grossman and Miller,1988). The combination of tighter funding constraints and lower volatility may therefore account for the lack of directional e↵ects on trading costs measures. Disentangling the relative importance of direct and indirect factors influencing trading activity remains an interesting issue for future research.
7 Robustness Analysis
This section examines several robustness tests. We begin by exploiting the sample of Nordic stocks that did not experience a change in clearing protocols during the sample period, as described in Section3. We use these stocks as an additional control group in Section7.1. Section7.2studies whether systematic factors are responsible for the decline in volatility. Section7.3investigates the hypothesis that volatility in Nordic equities reacts di↵erently to financial shocks relative to other European equities. Sections7.4and7.5discuss, respectively, whether a macro shock in the Nordics or an industry-specific event may be driving the drop in return volatility.
7.1 Nordic Control Group
We consider in this section a set of 177 Nordic stocks that continued to clear bilaterally after October 2009 as a second control group. In principle, these stocks represent an ideal control group for our analysis. However, as can be observed in Table2, this group contains equities that were more illiquid and displayed smaller
market capitalization at the time of the reform.25 This fact makes matching with large-cap stocks more
difficult and thus limits the power of the propensity score matching procedure and represents the main reason why we do not consider these stocks in Section5. Therefore, our goal in using this group is not to quantify the exact e↵ect of the clearing reform on volatility but, rather, to gain additional insight on whether the qualitative e↵ects are similar.
Table6displays the results of our robustness volatility tests. This table is equivalent to Table3except that we employ a di↵erent control group. We observe a highly significant negative e↵ect on volatility. Relative to pre-reform levels, the decline amounts to 6.1% for volatility and 13% in the case of the price range metric. These results are consistent with those obtained with the baseline control group and provide further support to H2. As in Section5and consistent with H3, there is an additional volatility decline for those stocks with a high MIMR value.
[ insert Table6here ]
7.2 Are Systematic Factors Responsible for the Decline in Volatility?
To further assess whether Nordic stock markets are special, we analyze the e↵ects on volatility separating its systemic and idiosyncratic components. In particular, the hypothesis we consider is whether changes in the way in which these markets relate to a global market factor are entirely responsible for the reform causal e↵ect on volatility. With this goal, we exploit our baseline di↵erence-in-di↵erences model considering both stock single-market factor betas and the idiosyncratic volatility components as dependent variables. As in previous sections, we use the STOXX Global 1800 index as the market factor.
[ insert Table7here ]
Table7displays the results. We observe that, against the considered hypothesis, both the systemic and idiosyncratic volatility components decrease significantly. Panel B of Table7also displays the results for an augmented model incorporating the MIMR variable. Although interaction between this variable and the reform period dummy has negative coefficients, as one would expect, these coefficients are not significant at the 10% level.
25The average market capitalization of a stock in the Nordic control group is EUR 399 million, 12 times smaller than the average
7.3 Do Nordic Countries React Di↵erently to Crises?
Given the period in which the event takes place, one may be concerned that the introduction of the CCP occurs contemporaneously with the international financial crisis. At the most fundamental level, we address this issue by taking a di↵erence-in-di↵erences approach and thus removing common time e↵ects. However, the question remains whether the countries that undertook the reform reacted to external shocks in a di↵erent fashion. This would be especially worrisome if, following negative external shocks, volatility in the Nordic markets had a systematic tendency to decline more sharply than in the control group. A further indication against this possibility is the fact that, as discussed earlier, volatility does not decrease prior to the mandatory phase of the reform that begins in October 2009. If a crisis had a distinctive tendency to depress volatility in the Nordics, one would expect such a decline to occur during the earlier voluntary phase as well.
To further address this possibility, we search for additional negative global financial shocks and contrast stock volatility responses in both the Nordic countries and the other countries in which the stocks in the control group are listed. In e↵ect, we study the response of Nordic markets to a “placebo” treatment. We identify two recent financial shocks. The first event begins on June 15, 2011, when Moody’s downgraded three important French banks (BNP Paribas, Crédit Agricole, and Societé Générale). The second begins on August 6 of the same year, when the U.S. sovereign bonds lost their AAA rating at Standard & Poor’s. The results of the placebo analysis are displayed in Table8. We note that there is no abnormal negative e↵ect that is observed in the Nordic markets for either financial shock. Although we cannot fully rule out the alternative hypothesis considered here, our placebo analysis provides evidence against it.
[ insert Table8here ]
7.4 Does a Macro Event in the Nordics Drive the Asset Prices Results?
An additional concern is whether a region-specific macro event during the event period might have led to a significant price volatility decline in the Nordics. We investigate this possibility using the macroeconomic reports of the Nordic central banks; the LexisNexis Academic News service for English news on Sweden, Denmark, and Finland; as well as the Bloomberg News & Research service. In short, we find no evidence
of significant macro events that might a↵ect the Nordics but not our control group sample.26 The most
significant events correspond to interest rate cuts by central banks. For example, in line with the European Central Bank and the U.S. Federal Reserve, the Swedish Central Bank cut the interest rate from 3.75% to 0.5% between December 2008 and April 2009. We do not observe distinctive behavior in Nordic volatility following such events.
7.5 Does an Industry E↵ect Drive the Asset Prices Results?
Yet another concern is whether a given industry in the Nordic economies experienced a large non–clearing-related shock during the event period, which may drive the results. To explore this possibility, we assign one of the 10 Datastream industry codes to the treated stocks in our sample. We then run a regression such as that in equation (1) but using industry dummies that interact with the event dummy. Table9displays significantly negative e↵ect on stock volatility during the event period for seven out of 10 of the considered industries: basic materials, industrial, consumer cyclicals, consumer non-cyclicals, financials, technology, and utility stocks. We therefore find no evidence that an idiosyncratic single-sector shock drives our main results.
[ insert Table9here ]
8 Concluding Remarks
To the best of our knowledge, this paper provides the first empirical analysis of how a switch from bilateral clearing to a CCP a↵ects price stability. The evidence in this paper suggests that, besides its e↵ects on systemic risk, central clearing can enhance price stability in an economically significant fashion. Central clearing is not a panacea: We document that volume declined post reform, and we do not find market quality improvements in trading costs or information measures.
Although some of the specifics of the Nordics’ experience may di↵er from those of other clearing reforms, we believe that our findings can be useful in understanding the potential consequences of instituting
26The main regional risk factor is the larger than average exposure to Baltic and Icelandic assets on the part of Swedish and
Danish banks. The crisis in the Baltics thus led to losses and credit rating downgrades for banks such as Swedbank and SEB. The crisis, however, had “little impact on solvency” according to Standard & Poor’s (“Baltic storms threaten to undermine Swedish lenders,” Financial Times, April 23, 2009).