HAL Id: tel-00811520
https://tel.archives-ouvertes.fr/tel-00811520
Submitted on 10 Apr 2013
HAL is a multi-disciplinary open access archive for the deposit and dissemination of sci-entific research documents, whether they are pub-lished or not. The documents may come from teaching and research institutions in France or abroad, or from public or private research centers.
L’archive ouverte pluridisciplinaire HAL, est destinée au dépôt et à la diffusion de documents scientifiques de niveau recherche, publiés ou non, émanant des établissements d’enseignement et de recherche français ou étrangers, des laboratoires publics ou privés.
Theoretical and experimental studies of electromagnetic
resonances in the ionospheric cavities of planets and
satellites; instrument and mission perspectives
Fernando dos Santos Simoes
To cite this version:
Fernando dos Santos Simoes. Theoretical and experimental studies of electromagnetic resonances in the ionospheric cavities of planets and satellites; instrument and mission perspectives. Instrumentation and Methods for Astrophysic [astro-ph.IM]. Université Pierre et Marie Curie - Paris VI, 2007. English. �NNT : 2007PA066424�. �tel-00811520�
THESE DE DOCTORAT DE
L’UNIVERSITE PIERRE ET MARIE CURIE
Spécialité
Physique, ED 389Présentée par
M. Fernando António DOS SANTOS SIMÕES
Pour obtenir le grade de
DOCTEUR de L’UNIVERSITÉ PIERRE ET MARIE CURIE
Résonances des cavités ionosphériques des planètes et de
leurs satellites: progrès et perspectives instrumentales
Soutenue le 7 de Décembre de 2007 devant le jury composé de:
Mme. Laurence REZEAU (Présidente)
M. François LEFEUVRE (Rapporteur)
M. Christian MAZELLE (Rapporteur)
M. Michel HAMELIN (Directeur de thèse)
M. Christian BÉGHIN (Examinateur)
M. Jean-Jacques BERTHELIER (Examinateur)
M. Réjean GRARD (Examinateur)
Este trabalho é dedicado a todos os homens e mulheres que têm dentro de si uma vontade insaciável de conhecer, de olhar o infinito e tentar transpô-lo. Esta tese é um tributo a todos os que procuram, sabiamente, chegar sempre mais alto e promovem o conhecimento científico como um extraordinário legado da humanidade.
Acknowledgments
This thesis covers several topics of research and, consequently, many people from various disciplines have made it possible, sometimes anonymously.
I express first my thanks to all men and women who have worked for the Cassini-Huygens programme during the last three decades and have contributed to the success of this remarkable mission, which will remain a major legacy to planetary scientists for many years to come.
I am grateful to the members of the HASI-PWA-Team for inviting me to participate in the PWA data analysis and to contribute to unveiling the mysteries of Titan.
I thank CETP-IPSL (Saint Maur, France) and RSSD/ESA-ESTEC (Noordwijk, The Netherlands) that provided outstanding environments to conduct my research.
I thank my supervisor, Michel Hamelin, for his wise coordination and for creating excellent research conditions. A have appreciated very much his friendship and support, especially when my numerical models were not converging.
I thank all my CETP colleagues; with a special mention for two of them. I am particularly indebted to Alain Péan for his hardware and software expertise, when additional memory or faster computers were required. I have also appreciated having fruitful discussions with Jean-Jacques Berthelier who had always a clever suggestion every time I was faced with a problem.
I thank Christian Béghin of LPCE for his sagacity and his friendly cooperation, and for showing me how analytical and numerical models can be complementary.
The subsurface permittivity probe was initially developed at RSSD, ESA-ESTEC, and I want to show my gratitude to those who have contributed to such an achievement. I thank Gerhard Schwehm, head of Planetary Missions Division, for hosting my activities; Jean-Pierre Lebreton for his continuous encouragements and for helping me to obtain the funds required for my research; Agustin Chicarro and Roland Trautner for their efficient supervision; Jo Heida and Bart Butler for their help regarding electronics design and assembling; and Lambert Schipperheijn for mechanical parts manufacturing. I thank Bernd Lehmann and César Gómez Fernández of the Mechanical Systems Laboratory, at ESA-ESTEC, for helping me with instrument calibration and testing. I must emphasize that several of my objectives have been achieved only because they believed that such accomplishments were possible. Several ideas were extensively discussed with these people, in particular Roland Trautner; hence the subsurface permittivity probe is also theirs.
Last, but not least, I thank Réjean Grard, who has been involved in several aspects of this thesis, from its inception at ESTEC, until its completion at CETP.
Finally, I wish to thank my family and friends for their unconditional support, mainly when they felt that I was living on another planet than Earth.
This research was sponsored by the following institutions: Fundação para a Ciência e a Tecnologia and Agência de Inovação, (Portugal); European Space Agency, European Space Research and Technology Centre, (The Netherlands); Centre National d’Études Spatiales (France). I also thank the International Space Science Institute (Switzerland) for hosting and supporting several team meetings.
Résume
L’étude des ondes d’extrêmement basses fréquences dans les cavités ionosphériques des planètes et satellites dotés d’atmosphère suit une approche similaire à celle suivie pour la Terre. Elle contribue à la caractérisation du circuit électrique atmosphérique, des sources d’énergie associées et des limites interne et externe des cavités. Un modèle numérique à éléments finis a été développé et appliqué à ces corps planétaires en vue d’étudier en particulier les résonances de Schumann. Les paramètres du modèle sont : (a) la géométrie de la cavité, (b) les caractéristiques de l’ionosphère, (c) la réfractivité de l’atmosphère neutre et (d) la permittivité complexe de la proche sub-surface. La simulation donne la fréquence propre et le facteur Q de la résonance ainsi que la distribution spatiale du champ électrique dans la cavité. Les cavités de Vénus et Titan sont étudiées dans le détail. La première est très asymétrique et un dédoublement de la fréquence de résonance est prédit. La seconde a été explorée par la sonde Huygens et, additionnellement la faible conductivité du sol de Titan ouvre la porte à l’étude de la sub-surface. La pertinence d’un modèle de la cavité de Titan a été testée par rapport aux mesures in situ de l’instrument Permittivity, Waves and Altimetry (PWA) à bord de la sonde Huygens. L’instrument PWA a mesuré les profils de conductivité électronique et ioniques grâce aux techniques d’impédance mutuelle (MI) et de relaxation, et a identifié une couche conductrice à une altitude d’environ 60 km. Après atterrissage, la constante diélectrique et la conductivité locales du sol mesurées par la sonde MI sont respectivement ~2 et ~ 10-10-10-9 Sm-1. Aucune évidence d’éclair ou de coup de tonnerre n’a été enregistrée, mais un fort signal à 36 Hz a été reçu pendant toute la descente. Cette émission à bande étroite n’est probablement pas un artefact. On a montré par modélisation avec des paramètres appropriés que le signal peut être une résonance naturelle. L’expérience acquise est appliquée à la conception de nouveaux instruments, ARES et SP2, pour étudier l’atmosphère et le sol de la planète Mars dans le cadre du projet ExoMars et pour d’autres corps lors de futurs projets spatiaux. On propose de tirer profit des caractéristiques polaires de l’eau et d’appliquer la technique MI à la détection de la glace dans le régolithe martien.
Mots clés
Sciences planétaires; mission Cassini-Huygens; ondes électromagnétiques; résonance de Schumann; électricité atmosphérique; instrumentation spatiale
Theoretical and experimental studies of electromagnetic
resonances in the ionospheric cavities of planets and
satellites; instrument and mission perspectives
Abstract
The study of extremely low frequency electromagnetic wave propagation in the ionospheric cavities of celestial bodies in the Solar System follows an approach similar to that developed for Earth. It contributes to the characterization of the atmospheric electric circuit and associated energy sources, and to the identification of the inner and outer cavity boundaries. A wave propagation finite element model is developed and applied to all planets and satellites surrounded by an atmosphere, with the aim of studying, in particular, the Schumann resonance phenomenon. The input parameters of the model are: (a) the geometry of the cavity, (b) the ionized atmosphere characteristics, (c) the neutral atmosphere refractivity and (d) the top subsurface complex permittivity. The simulation yields the eigenfrequency and Q-factors of the resonance and the distribution of the electric field in the cavity. The cavities of Venus and Titan are studied in more detail. The former is highly asymmetric and a significant splitting of the eigenfrequency is predicted. The latter has been explored by the Huygens Probe and, additionally, the low conductivity of Titan’s soil opens the door to subsurface investigations. The validity of a model of Titan’s cavity is scrutinized against the in situ measurements performed by the Permittivity, Waves and Altimetry (PWA) analyzer, onboard the Huygens Probe. The PWA instrument measured the ion and electron conductivity profiles using the Mutual Impedance (MI) and relaxation technique, and identified a conductive layer at an altitude of about 60 km; the relative permittivity and conductivity of the surface measured by the MI probe at the landing site are ~2 and ~10-10-10-9 Sm-1, respectively. No evidence of any lightning event or thunder clapping was found; but strong electric signal at around 36 Hz was observed throughout the descent. This narrow band emission is probably not an artefact. Modelling the cavity with an appropriate set of input parameters indicates that this signal is possibly a natural resonance of the cavity. The acquired experience is then applied to the design of novel electrical probes, ARES and SP2, to study the atmosphere and the ground of the planet Mars, in the forthcoming ExoMars mission, and of other celestial bodies in future space missions. It is proposed to take advantage of the polar characteristics of the water molecule and to apply the MI technique to the detection of subsurface ice in the Martian regolith.
Keywords
Planetary sciences; Cassini-Huygens mission; electromagnetic waves; Schumann resonance; atmospheric electricity; space instrumentation
Contents
1. Introduction ..….………... 1
2. Wave Propagation and Resonances in Ionospheric Cavities ...………. 9
2.1. The Resonant Cavity ...………... 9
2.1.1. Basic Description …...………... 9
2.1.2. General Formalism ………... 11
2.2. Energy Sources and Global Circuit ……… 13
3. Numerical Model for Ionospheric Planetary Cavities ……….. 19
3.1. Numerical Tool ………... 19
3.1.1. The 2D axisymmetric Approximation ……….. 19
3.1.2. The 3D Model ………... 20
3.1.3. Boundary and Continuity Conditions ………... 21
3.1.4. Eigenfrequency Analysis ……….. 22
3.1.5. Time harmonic Propagation Analysis ……….. 22
3.1.6. Accuracy and Numerical Solvers ………. 22
3.2. Cavity Parameterization ………. 23 3.2.1. Parameter Description ……….. 24 3.2.2. Cavity Description ……… 27 3.2.2.1. Venus ……….. 27 3.2.2.2. Earth ………... 28 3.2.2.3. Mars ……… 28 3.2.2.4. Jupiter ………. 29 3.2.2.5. Io and Europa ………. 29 3.2.2.6. Saturn ……….. 30 3.2.2.7. Uranus ………. 30 3.2.2.8. Neptune ………... 31 3.3. Results ……… 31
4. Titan Electromagnetic Environment Characterization ………. 33
4.1. The Cassini-Huygens Mission ……… 33
4.2. The Permittivity, Waves and Altimetry Analyzer ……….. 35
4.2.1. Instrument Configuration ………. 35
4.2.2. Relaxation Probe ……….. 37
4.2.3. Mutual Impedance Probe ……….. 38
4.2.4. Dipole Antenna ... 39 4.2.5. Acoustic Sensor ... 40 4.2.6. Radar ... 41 4.3. Experimental Results ……….. 41 4.3.1. Data Synopsis ………... 41 4.3.2. Relaxation Data ……… 43 4.3.3. Radar Data ……… 44
4.3.4. Extremely Low Frequency Spectra ……….. 45
4.3.5. Very Low Frequency Spectra ………... 48
4.3.6. Mutual Impedance Data ………... 49
4.3.7. Lightning Data ……….. 51
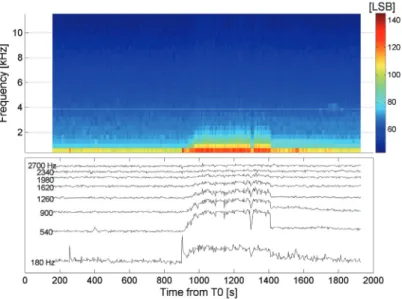
4.3.8 Acoustic Spectra ……… 51
5. Prospective Space Instrumentation and Missions ……… 63
5.1. Planetary Surfaces Dielectric Properties Measurement ………. 63
5.2. Dielectric Properties of Water, Ice, and Soils ……… 64
5.2.1. Polarization Mechanisms and Effects ……….. 64
5.2.1.1. Polarization Theory ……… 64
5.2.1.2. Frequency Effects ………... 65
5.2.1.3. Temperature Effects ………... 67
5.2.1.4. Composition Effects ………... 67
5.2.2. Water Dielectric Properties ……….. 70
5.2.3. Ice Dielectric Properties ………... 71
5.2.4. Water and Ice Dielectric Signatures in Soils ……… 72
5.3. Subsurface Permittivity Probe ……… 73
5.3.1. General Description ……….. 73 5.3.2. Electrodes ………. 74 5.3.3. Electronics ……… 76 5.3.4. Signal Processing ……….. 77 5.3.5. Operation …………...………... 77 5.4. Laboratory Experiments ………. 78
5.4.1. Experimental Setup and Instrument Calibration ……….. 78
5.4.2. Soil Analogues Testing ………. 80
5.4.3. Results ……….. 80
5.4.3.1. Gravimetric Water Content ………...……… 80
5.4.3.2. Stratigraphic Measurements ………...…………... 85 5.5. Probe Modelling ………. 87 5.6. Future Missions ……….. 92 6. Conclusions ……….. 93 7. References ……… 97 8. Appendix Paper 1 - Fulchignoni et al. – Nature (2005) ………. 109
Paper 2 - Simões et al. – COMSOL Conference (2005) ………... 119
Paper 3 - Grard et al. – Planetary and Space Science (2006) ……… 125
Paper 4 - Simões et al. – Planetary and Space Science (2007a) ……… 141
Paper 5 - Béghin et al. – Icarus (2007) ……….. 155
Paper 6 - Hamelin et al. – Planetary and Space Science (2007) ……… 173
Paper 7 - Simões et al. – To be submitted (2007d) ………... 189
Paper 8 - Simões and Hamelin – COMSOL Conference (2006) ………... 203
Paper 9 - Simões et al. – Icarus (2007b) ……… 213
Paper 10 - Simões et al. – Submitted to Journal of Geophysical Research (2007c) . 227 Paper 11 - Trautner and Simões – ESA SP-518 (2002) ……… 251
Paper 12 - Hamelin et al. – ESA SP-543 (2004) ………... 257
Paper 13 - Trautner et al. – ESA SP-543 (2004) ………... 263
Paper 14 - Simões et al. – ESA SP-543 (2004a) ………... 269
Paper 15 - Simões et al. LPSC Conference (2004b) ………. 277
List of Tables
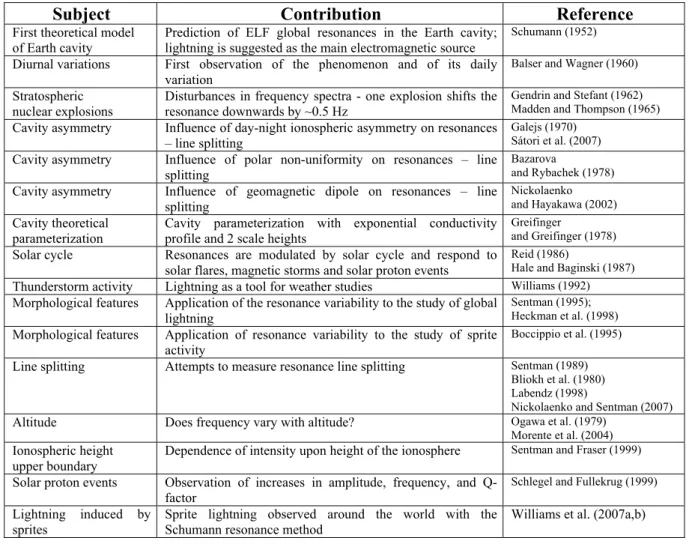
Table 1 - List of relevant achievements using the Schumann resonance ……….. 14
Table 2 - Electromagnetic sources of planetary cavities ………... 15
Table 3 - Lightning typical characteristics ………. 17
Table 4 - Eigenfrequencies of the cavities of Earth and Titan ………... 23
Table 5 - Refractivity of gases in the ELF range .……….. 26
Table 6 - Complex eigenfrequencies of planetary cavities ……… 32
Table 7 - The PWA operation modes ……… 37
Table 8 - The ELF and VLF spectra parameters as function of operation mode ……... 40
Table 9 - List of the RP plateaus identified during the descent ………. 44
Table 10 - Conductivity of pure water as function of temperature and pressure ……... 70
Table 11 - Static dielectric constant of pure water as function of temperature ………. 70
Table 12 - Real and imaginary components of the dielectric constant of pure water … 71 Table 13 - Static dielectric constant of pure ice I as function of temperature ………... 72
Table 14 - Static dielectric constant of pure ice with different crystal lattices ……….. 72
Table 15 - Conductivity of Earth rocks and soils ……….. 73
Table 16 - List of the SP2 instrument main characteristics ………... 74
Table 17 – Permittivity and chemical composition of the JSC Mars-1 simulant …….. 81
List of Figures
Figure 1 – Illustration of atmospheric electricity phenomena on Earth ….………...…. 16
Figure 2 - Global lightning distribution obtained by satellite ……… 16
Figure 3 - Models of general characteristics of lightning strokes ……….. 17
Figure 4 – Spherical cavity configurations used in the simulations ……….. 20
Figure 5 - Sketch of the model used for calculating the Schumann resonance ………. 24
Figure 6 - Conductivity and permittivity profiles of the atmosphere of Venus ………. 28
Figure 7 - Electric field amplitude as a function of altitude in a lossless cavity ……... 31
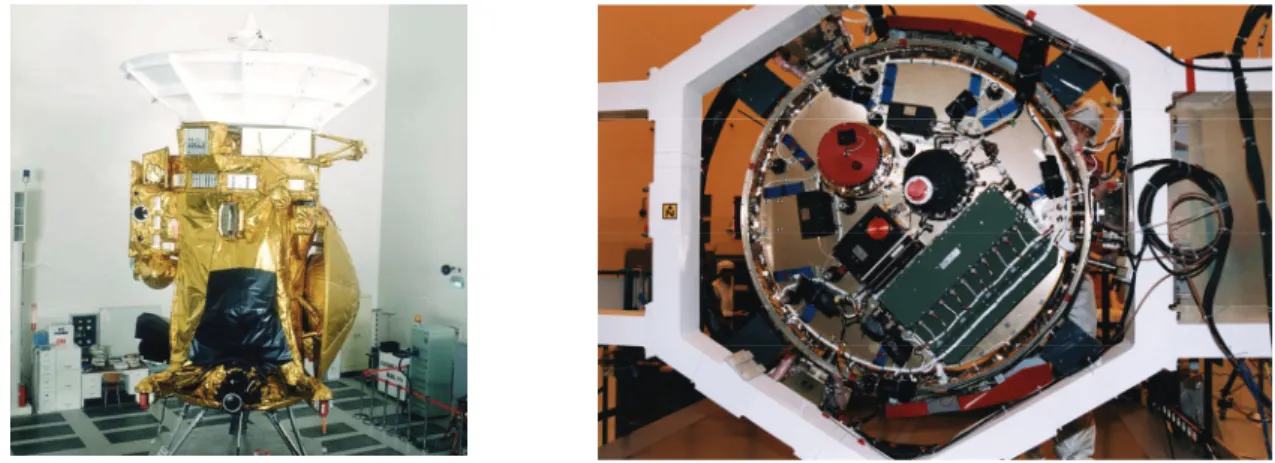
Figure 8 - The Cassini Orbiter and the Huygens Probe ………. 33
Figure 9 - Sketch of the descent sequence of the Huygens Probe upon Titan ………... 35
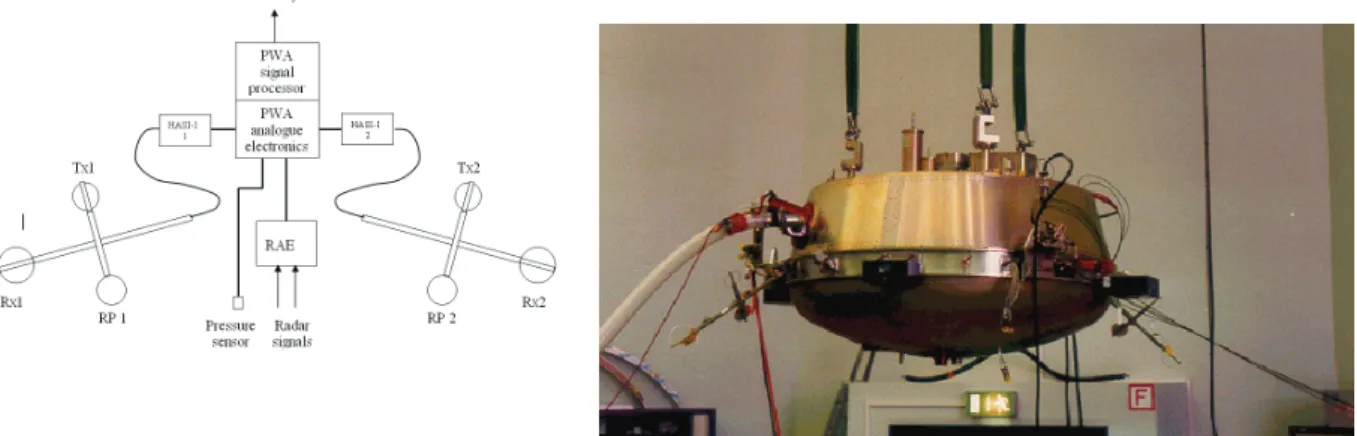
Figure 10 - Sketch of PWA sensors and Huygens Probe in deployed configuration … 36 Figure 11 - General view of the Huygens Probe and parachute bridles ……… 40
Figure 12 - The synopsis of PWA data ……….. 42
Figure 13 - Relaxation carpets of the RP2 electrode ………. 43
Figure 14 - Relaxation curves of RP2 due to negative charge carriers ……….. 43
Figure 15 - Atmospheric backscatter distance and Probe altitude measured by PWA .. 45
Figure 16 - Spectral representation of the surface roughness at particular altitude …... 45
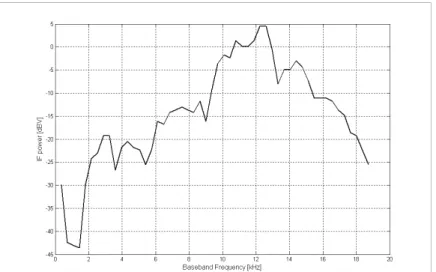
Figure 17 - Electric signal measured with the PWA receivers in the ELF range …….. 46
Figure 18 - Mean electric field measured by PWA in the ELF range ………... 46
Figure 19 - Variation of the peak signal frequency during the descent ………. 48
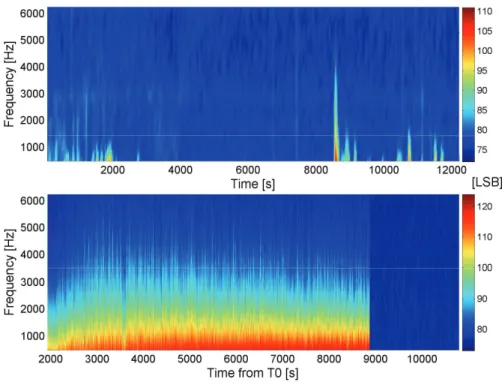
Figure 20 - Electric signal in the VLF range between 140 and 60 km ……….. 49
Figure 21 - Electric signal in the VLF range below 60 km and on the surface ………. 49
Figure 22 - Mutual impedance measured during the descent and on the surface …….. 50
Figure 23 - Mutual impedance amplitude and phase measured on the surface ………. 50
Figure 24 - Electric field measurements during the Trapani balloon campaign ……… 51
Figure 25 - Impulsive event measured by PWA in the VLF range at 46 km ... 51
Figure 26 - Dynamic spectra measured with the acoustic transducer ……… 52
Figure 27 - Electron conductivity profile below 100 km ………... 53
Figure 28 - Electron density profile between 40 and 100 km ……… 53
Figure 29 - ELF spectrograms obtained by spraying aerosols on the PWA antenna … 55 Figure 30 - Profiles of several Huygens sensors in the range 140-60 km ………. 55
Figure 31 - The 36 Hz signal and electric field theoretical profile below 140 km …… 56
Figure 32 - The 36 Hz signal and electric field theoretical profile below 60 km …….. 57
Figure 33 - Profiles of ACP current and VLF spectral lines in the range 60-140 km ... 58
Figure 34 - Profiles of ACP current and ELF-VLF spectral lines below 60 km ……... 58
Figure 35 - Synopsis of several instruments onboard Huygens I ……….. 59
Figure 36 - Synopsis of several instruments onboard Huygens II ………. 59
Figure 37 - Synopsis of several instruments onboard Huygens III ……… 60
Figure 38 - Synopsis of several instruments onboard Huygens IV ………... 60
Figure 39 - Schematic representation of the different polarization mechanisms ……... 65
Figure 40 - Several polarization mechanisms as function of frequency ……… 66
Figure 41 - The Maxwell-Wagner and Counter-ion polarization effects ……….. 69
Figure 42 - The diffuse electrical double-layer model for particle charging …………. 69
Figure 43 - The SP2 prototype ………... 74
Figure 44 - Cross section of the multilayer configuration of the SP2 electrodes …….. 75
Figure 45 - Wiring cross section in the multilayer configuration of the electrodes ….. 75
Figure 47 - The SP2 electronics block-diagram ……… 76 Figure 48 - Sketch of the experimental setup of the prototype and capacitor cell ……. 78 Figure 49 - Apparatus of the plate capacitor technique ………. 79 Figure 50 - Apparatus of the SP2 prototype ……….. 79 Figure 51 - Dielectric properties of dry soil as functions of frequency and porosity … 83 Figure 52 - Dielectric properties of soil as functions of water content at T=-55°C ….. 83 Figure 53 - Dielectric properties of soil as functions of water content at T=-25°C ….. 83 Figure 54 - Permittivity of soil as function of water contents and temperature ……… 84 Figure 55 - Soil loss tangent as function of water content, frequency, and temperature 84 Figure 56 - Sketch of the stratified medium used to produce the 2D electric maps ….. 85 Figure 57 - 2D electric maps of the stratified medium at 16 Hz ……… 86 Figure 58 - 2D electric maps of the stratified medium at 1024 Hz ……… 86 Figure 59 - 3D finite element model of the SP2 architecture ……… 88 Figure 60 – Numerical modelling of potential distribution in stratified medium …….. 88 Figure 61 - Potential distribution of a dipole laying on a stratified medium …………. 90 Figure 62 - Potential distribution of a dipole laying on a heterogeneous medium …… 91
1. Introduction
The propagation of electromagnetic waves in the atmosphere of Earth has been extensively studied, in a wide spectral range, for scientific and technological purposes. This work is devoted to phenomena that fall within the Extremely Low Frequency (ELF, range 3 Hz - 3 kHz) and Very Low Frequency (VLF, 3-30 kHz) ranges, where the wavelengths are commensurate with planetary sizes. The propagation of ELF waves within the cavity formed by two highly conductive, concentric, spherical shells, such as the boundaries formed by the surface and the ionosphere of Earth, was first studied by Schumann (1952); the associated resonance phenomena were subsequently observed by Balser and Wagner (1960). Resonances in the Earth cavity are closely related with lightning activity and contain information about the global electric circuit of the cavity; their characterization contributes not only to our understanding of wave propagation but also to the study of the physical and chemical processes that take place in the atmosphere and lower ionosphere. Atmospheric ion chemistry processes are closely linked with the distribution of the energy sources, the interactions with the solar wind, the conditions for wave propagation, and the global dynamics of the gaseous envelope. Lightning plays a peculiar role because it is the major source of electromagnetic energy in the Earth cavity. In this thesis, we develop a generalized approach to the resonances of planetary cavities that involves the characteristics of the ionosphere, the atmosphere, the surface, and the interior of the planets and their moons.
Schumann resonance studies are currently, conducted in three major fields of research, specifically climate change, high altitude atmospheric electricity, and space weather. The connection between Schumann resonances, lightning, and thunderstorm activity at global scale presents a reliable method to monitoring climate variability and space weather (Williams, 1992; Williams and Sátori, 2007). Correlation between Schumann resonance measurements onboard stratospheric balloons and Earth observations from satellites, namely TARANIS (Blanc et al., 2007), reveals a promising approach for the investigation of high altitude discharging events, such as sprites (Williams et al., 2007a).
An approach similar to that used for Earth can be applied to the planets, from Venus to Neptune, and their moons that are surrounded by an atmosphere. A special attention is devoted to Titan and the in situ measurements performed by the Huygens Probe. Titan, the largest satellite of Saturn, is a remarkable object; it is the sole moon of the Solar System with a thick atmosphere, which might resemble that of the primordial Earth, several billion years ago. Voyager flybys, in the early eighties, revealed an atmosphere composed of nitrogen with a small amount of methane, and permeated with haze that impaired the observation of the surface. It is known that N2-CH4 mixtures can produce complex organic radicals when
subjected to high voltage electric discharges (e.g., Raulin and Owen, 2002). The observation of possible prebiotic conditions on Titan was therefore one of the major objectives of Cassini-Huygens, a mission dedicated to the Kronian system: Saturn, its rings and its moons (Matson et al., 2002; Lebreton et al., 2002). The spacecraft included a probe, Huygens, to perform in situ measurements of the composition and electrification of the atmosphere, possibly down to the surface of Titan.
The Cassini-Huygens mission is an international collaboration, where the National Aeronautics and Space Administration (NASA) provides the Cassini Orbiter, which carries a large set of remote sensing instruments, and the European Space Agency (ESA) supplies the Huygens Probe that includes several instruments entirely devoted to the in situ observation of Titan. The Permittivity, Waves and Altimetry (PWA) analyzer, a subsystem of the Huygens Atmospheric Structure Instrument (HASI), is part of the Huygens payload and is dedicated to atmospheric electricity and surface dielectric measurements (Grard et al., 1995; Fulchignoni et al., 2002). PWA comprises the following elements: (a) a Mutual Impedance Probe (MIP) for atmospheric and surface permittivity studies; (b) a Relaxation Probe (RP) for atmospheric ion and electron conductivity measurements; (c) a receiver to observe lighting activity, and ELF and VLF waves; (d) an acoustic transducer for thunder-clap detection; (e) a radar module to not only assist descent operations but also perform atmospheric backscatter and surface topography investigations; (f) a set of electrodes that form the electric field antenna, and the MIP and RP sensors. The PWA complex forms a comprehensive set of detectors that can significantly contribute to the characterization of the electric environment of Titan, in particular assessing the conditions for ELF wave propagation.
The mutual impedance probe technique has been introduced in geophysics at the beginning of the 20th century for measuring the ground conductivity (Wenner, 1915). The mutual impedance is the ratio of the voltage measured by a receiving dipole to the current injected into the medium through an adjacent transmitting dipole. This technique was transposed to space plasmas by Storey et al. (1969) and applied in many ionospheric and magnetospheric experiments; Grard (1990) extended the concept to study the dielectric properties of planetary surfaces. A MIP was included in the Huygens Probe to measure the dielectric properties of the atmosphere and surface of Titan; it is also part of the payload of Philae, the Rosetta Lander, en route to the comet Churyumov-Gerasimenko. As for future planetary missions, the instrument has been recommended for the ExoMars project, in a new configuration and with improved capabilities. The later instrument is comprehensively described in this thesis and typifies a new generation of space tools based upon the mutual impedance technique. These new developments are particularly useful for assessing the dielectric properties of a planetary surface, which is essential to ascertain the location of the inner boundary of a resonating cavity.
The understanding of wave propagation on Titan requires information about a number of cavity parameters, such as the atmospheric conductivity profile, the source of electromagnetic energy, and the boundary conditions. Prior to the Huygens Probe descent upon Titan, the cavity parameterization relied exclusively on modelling, with the exception of the upper boundary whose conductivity could be estimated from the Voyager data. Unlike the cavity of Earth, where most parameters and wave propagation conditions are known with a fair accuracy, those of other celestial bodies are mostly theoretical. Therefore, the PWA data set brings an essential improvement to the Titan cavity models and a contribution to comparative planetology.
The scientific rationale of this thesis is manifold; the work consists of: (a) a presentation of the PWA data analysis results; (b) a development of a wave propagation numerical model for the cavity of Titan; (c) a generalization of this numerical model and its application to other planetary cavities using specific parameterization; (d) a set of recommendation for the
development of instrumentation suitable for atmospheric and surface studies of planets and satellites. The data analysis of the PWA instrument is mainly focused on the electron conductivity profile of the atmosphere, the calibration of the ELF spectra, and the evaluation of surface dielectric properties. The numerical model to study wave propagation is based on several tools available in the COMSOL Multiphysics software, which uses the finite element method to solve specific equations. The algorithm is generalized and applied to other cavities, namely those of Venus, Mars, Jupiter and its moons Io and Europa, Saturn, Uranus, and Neptune. Possible instruments for measuring the electric properties of the atmosphere and surface of planets are described; a new technique to study the Martian regolith subsurface was proposed for the ExoMars mission. The instrument, known as the Subsurface Permittivity Probe (SP2), is based on the mutual impedance principle and benefits from the heritage of the Huygens and Rosetta missions.
The introduction concludes with a brief description of the publications closely related to this work. The structure of the thesis is the following:
Chapter 2 reviews the theory of wave propagation and resonance phenomena in planetary cavities. The description of the Earth cavity, energy sources and global electric circuit is followed by a presentation of the scientific purpose for studying other planetary cavities. Chapter 3 reports a generalized numerical model that can be applied to any cavity configuration. The parameterization and numerical tools that make use of the finite element method are first described. The results, namely the lowest eigenfrequencies and Q-factors, are then presented for several planetary cavities.
Chapter 4 is dedicated to Titan. Following a recapitulation of the Cassini-Huygens mission, and a description of the Probe, we depict in more detail the PWA analyzer and the measurements performed in the atmosphere and on the surface of Titan. The experimental results are included in the model and provide new constraints for the cavity. The numerical output from the simulation consists of eigenfrequencies, ELF spectra, and electric field profiles. The results are briefly discussed in the light of our current knowledge of the electric environment of Titan. The ELF signal measured during the descent is also presented.
Chapter 5 is dedicated to prospective and future missions. The heritage and scientific objectives of the SP2 instrument proposed as a contribution to subsurface studies for the ExoMars mission are briefly presented. A full technical description of SP2 is not the aim of this work; only the most important features of the instrument are given.
Chapter 6, finally, summarizes the progress achieved about the characterization of planetary cavities, with a particular emphasis on Titan’s, presents a synopsis of possible electric measurements in the atmosphere and on the surface of celestial bodies, and discusses the advances that can be expected from an instrument such as SP2.
The full articles, reports, and proceedings directly related with this thesis and including contributions of its author are added as appendices, with one exception, Simões (2004), because of its length (abstract only). A comprehensive bibliography listing all other relevant works is also included.
The appendices are sorted by topic (Titan, Planetary Cavities, Instrumentation), and are summarized hereunder.
Titan:
• [Paper 1] Fulchignoni et al. (2005) present the first observations made with HASI and PWA, and provide a preliminary description of the environment of Titan from the in situ measurements performed during the descent of Huygens. The temperature and density are both higher than expected in the upper part of the atmosphere; a lower ionospheric layer is seen between 140 km and 40 km, with a peak in electrical conductivity near 60 km; the temperature on the surface is 93.65±0.25 K, and the pressure 1467±1 hPa; the surface permittivity is about 2; a narrow line is observed in the ELF spectrum at around 36 Hz from an altitude of 140 km down to the surface. The amplitude of this line is enhanced approximately one minute after the deployment of the stabilizer parachute, at an altitude of ~110 km.
• [Paper 2] Simões et al. (2005) apply the finite element method to estimate the influence of the Huygens vessel upon the mutual impedance and electric field measurements. The calibration of the PWA data requires indeed an accurate determination of the effective length of the dipole antenna. The manuscript presents a simple approach, using Poisson and Laplace equations, to calibrate several of the sensors. The self and mutual capacitances of the Huygens vessel and of the electrodes, for example, are calculated as required for the calibration of the MIP data. • [Paper 3] Grard et al. (2006) report the PWA measurements with further detail and
provide a first overview of the electric properties and related physical characteristics of the atmosphere and surface of Titan. The electron conductivity profile shows a peak at an altitude about 60 km. The electron conductivity is measured with two independent techniques: the shapes of the profiles are similar but the conductivities differ by one order of magnitude; the ion conductivity is measured with RP, but the relaxation curves deviate from an exponential law, due to the presence of segments with constant potentials (plateaus). The RP voltage profiles show that the time constants relative to the negative and positive charges are minimal at 64 and 77 km, respectively. The narrow line at 36 Hz may not be due to a malfunction of the instrument. The surface conductivity is of the order of 4 × 10⁻¹⁰ Sm-1. The performance of the mutual impedance during the first phase of the descent is not well understood. The ELF and VLF spectrograms show an enhancement of the signal at altitude lower than 22 km. The PWA data do not reveal any significant signal in the acoustic and lightning modes that can be assigned to natural phenomena.
• [Paper 4] Simões et al. (2007a) present a new numerical model of electromagnetic wave propagation in the cavity of Titan and discuss the constraints introduced by the PWA results. The analytical, semi-analytical, and numerical models of the Earth cavity are first discussed. The parameters that characterize the cavity are then introduced and the finite element model is described. The experimental and modelling results are finally compared. The major conclusions are: (a) The 36 Hz signal might be consistent with the second harmonic of the cavity resonance frequency; (b) A 90° angular separation between the electromagnetic source and the Huygens Probe might explain the predominance of the second harmonic over the fundamental resonance signal; (c) The surface of Titan cannot be considered as the inner boundary of the cavity; a subsurface ocean may instead play that role, and it is possible, in principle to
investigate the electric properties of this subsurface material because of the low surface reflectivity.
• [Paper 5] Béghin et al. (2007) study the ELF spectra and present several scenarios to explain the natural or artefact nature of the 36 Hz signal. Each hypothesis is then assessed with reference to the whole data set, laboratory tests on a mock-up, theoretical models, and numerical simulations. Artefacts include aerodynamic effects, boom and parachute vibrations, and instrument interferences. A natural source is more difficult to identify; several hypotheses are nevertheless offered: lightning activity, local corona discharges, atmospheric triboelectricity, and interactions with the magnetosphere of Saturn. The most likely scenario in each category is boom vibration or interaction with the magnetosphere of Saturn.
• [Paper 6] Hamelin et al. (2007) present an analysis of the calibrated MIP data and derive the electron conductivity and density profiles of the atmosphere of Titan. Calibrated amplitudes and phases of the signal are derived from theoretical and numerical models of PWA circuitry and Huygens vessel geometrical configuration. The effects of vertical motion and temperature are also included. The peculiar performance of the instrument in the altitude range 100-140 km is scrutinized. The major results are summarized in the following. The maximum electron conductivity is about 3×10⁻⁹ Sm-1 at 63 km, corresponding to an electron density of 650 cm-3. The conductivity and electron density are significantly reduced in the altitude range from 80 up to at least 140 km. The ionized layer shows relatively steep boundaries; the scale heights are small compared with theoretical predictions. These features are probably resulting from electron attachment on aerosols.
• [Paper 7] Simões et al. (2007d) present an analysis of the MIP surface mode and derive constraints on surface composition. Several scenarios are discussed to explain the first measurements performed immediately after surface impact and the sudden transition observed 12 min after touchdown. The topics developed in this article are the following: the mutual impedance technique and instrument characteristics; data calibration; boom configuration after landing and Huygens attitude; surface dielectric properties for various rest positions, at five frequencies in the VLF range; comparison with radar measurements and constraints on soil composition at the landing site.
Planetary Cavities:
• [Paper 8] Simões and Hamelin (2006) discuss the propagation of low frequency electromagnetic waves in large cavities using the COMSOL Multiphysics tools. This work partly addresses the accuracy of the theoretical models used for Earth cavity and the generalization to other planetary environments. A special attention is devoted to Titan and to the corrections associated with the relatively large separation between the inner and outer shells. Analytical, semi-analytical, and numerical approaches are compared. The application of the time harmonic and eigenfrequency modes to the computation of eigenfrequencies, Q-factors, and electric field profiles, is discussed. The respective merits of 2D axisymmetric and 3D geometries are discussed, regarding accuracy and memory optimization.
• [Paper 9] Simões et al. (2007b) apply a model similar to that used for the cavity of Titan, to study the electromagnetic environment of other celestial bodies. The finite
element model is solved for the cavities of Venus, Mars, Jupiter and its moons Io and Europa, Saturn, Uranus, and Neptune. Complex eigenfrequencies and Q-factors are computed and are discussed in a preliminary comparative planetology study. It is concluded that the cavity of Venus exhibit lower losses than that of Earth and that ELF waves in the Martian atmosphere suffer higher attenuation; waves in the cavities of Io and Europa are evanescent, because a significant electron density extends down to the surface and prevents their propagation; the water content of the gaseous envelope of Uranus and Neptune can be estimated by measuring the Schumann resonances, which are strongly influenced by the conductivity profile.
• [Paper 10] Simões et al. (2007c) improve the existing models of the Venus cavity. They include corrections for the day-night asymmetry and atmospheric refractivity, and calculate the eigenfrequencies and field profiles. The model is validated against the VLF data collected by Venera 11 and 12. This study shows that the day-night asymmetry may split the Schumann frequency by as much as 1 Hz; and that the atmospheric refractivity introduces a maximum in the electric field, at an altitude of about 32 km. The profile predicted in the VLF range is fairly consistent with those recorded during the Venera descents, though local features, likely due to turbulence, are not reproduced.
Instrumentation:
• [Paper 11] Trautner and Simões (2002) describe an instrument based on the MIP technique to study the Martian regolith. The sensor consists of an array of several transmitting and receiving dipoles attached to a penetrator. Using a standard finite difference method to solve Laplace equation, they compute the potential distribution in the vicinity of the atmosphere-soil interface and in stratified media, such as those produced by water ice deposits. The spatial range and resolution are commensurate with the separation between the electrodes.
• [Paper 12] Hamelin et al. (2004) compare the performance of several MIP instruments proposed for the Cassini-Huygens, Rosetta, Netlander, BepiColombo, and ExoMars missions. They describe other configurations suitable for the study of the Martian regolith at shallow depths and the detection of water ice.
• [Paper 13] Trautner et al. (2004) present a preliminary concept for measuring the dielectric properties of planetary subsurface materials in the VLF range. They describe the technique and a specific architecture for subsurface applications, namely water ice detection and stratification characterization.
• [Paper 14] Simões et al. (2004a) study the dielectric properties of JSC-Mars 1, a Martian soil analogue, in the range 20 Hz-10 kHz. Laboratory measurements on Martian soil simulant JSC Mars-1 are described, which is used to support the calibration of instruments for planetary missions, namely SP2.
• [Paper 15] Simões et al. (2004b) study the dielectric properties of JSC-Mars 1, a Martian soil analogue, in the range 20 Hz-10 kHz. The measurements are made under controlled laboratory conditions to study the variation of the permittivity as a function of several parameters, porosity, gravimetric water content, frequency, and
temperature. It is possible to measure gravimetric ice contents of the order of 1%, due to the peculiar dielectric signature of the water molecule.
• [Paper 16] Simões (2004) proposes to mount a MIP on a mole, to detect water/ice in planetary regoliths at shallow depths. The report recapitulates the various stages of the study, from proof of concept to laboratory experiments and initial scientific calibration. The list of the topics covered in this work is the following: scientific rationale; water/ice dielectric properties, mechanical structure, electronics, data acquisition, control and signal processing, prototype development; hardware and software testing, instrument calibration; laboratory testing in controlled environments, instrument performance and study of Martian analogue materials. It appears possible, with less than 100 g and 1 W, to develop a MIP to measure water/ice in the Martian regolith and study the stratification at shallow depths. The gravimetric water/ice content detection threshold is ~1%, and interfaces and heterogeneities can be identified within a range of ~10 cm with a resolution of ~1 cm.
2. Wave Propagation and Resonances in Ionospheric Cavities
2.1 . The Resonant Cavity
2.1.1. Basic Description
Earth can be regarded as a nearly conducting sphere, wrapped in a thin dielectric atmosphere that extends up to the ionosphere, whose conductivity is also substantial. Hence, the surface and ionosphere of Earth form a cavity where electromagnetic waves propagate. This phenomenon was first studied by Schumann (1952) and an historical perspective is presented by Besser (2007). When a cavity is excited with broadband electromagnetic sources, a resonant state can develop provided the average equatorial circumference is approximately equal to an integral number of wavelengths of the electromagnetic waves. This phenomenon is known as the Schumann resonance and was first observed by Balser and Wagner (1960); it provides information about thunderstorm and lightning activity at Earth and acts, for example, as a “global tropical thermometer” (Williams, 1992). In certain conditions, the same theory can be used to study other planetary cavities; we shall apply it to rocky planets, icy moons, and the gaseous giants.
Neglecting curvature and equating the circumference to an integer number of wavelengths, the resonant angular frequency of a thin void cavity is written
R c m
m =
ω , (01)
where m is an integer that identifies the eigenmode, c the velocity of light in the medium and R the average radius of the cavity. Including a 3D spherical correction yields (Schumann, 1952) R c m m m = ( +1) ω . (02)
The first few Schumann resonances, or longitudinal modes, have frequencies that fall within the ELF range for most celestial objects, including Earth.
In addition to the longitudinal modes that are functions of the cavity radius, there exist local transverse modes along the radial direction. When the shells that form the cavity are perfect electric conductors, the transverse mode requires that the electric field be zero at the
boundaries. A resonance develops whenever the separation between the shells, generally the height of the ionosphere, h, is an integer number, p, of half-wavelengths,
h c p
p π
ω = . (03)
The value p=0 is associated with a possible electrostatic field between the ionosphere and the surface; on Earth, the lowest modes (p>0) lie in the VLF range. The longitudinal and transverse eigenfrequencies of same order (m=p) differ by more than two orders of magnitude for most bodies (h/R~0.01). However, the ratio between ionospheric height and cavity radius is relatively large on Titan (h/R~0.2) because, there, the cavity inner radius is small and the separation between the boundaries is large. Detection of the transverse resonance is more difficult than the longitudinal one due to its local nature and to the variability of the ionosphere.
These estimates give the order of magnitude of the resonances, but more accurate results require the solution of Maxwell equations with suitable boundary conditions. We shall follow the approach described by Nickolaenko and Hayakawa (2002) for the analysis of ELF wave propagation in the Earth cavity. In a first approximation, the longitudinal and transverse modes of propagation are decoupled and Equations (02-03) are obtained. A general solution, taking into account the coupling between longitudinal and transverse modes, leads to the relation (Nickolaenko and Hayakawa, 2002)
2 ) 1 ( ⎟ ⎠ ⎞ ⎜ ⎝ ⎛ + + = h R p m m R c mp π ω . (04)
The cavity of Earth, however, is not perfect and the models must take into account medium losses, which contribute to the dissipation of the energy supplied by the excitation sources. Wave attenuation in the cavity is generally caused by losses not only in the medium but also on the boundaries. Whereas the former is related with atmospheric conductivity, the later depends on wave reflectivity efficiency. Thus, it is useful to define two physical parameters, the skin depth and the quality factor of the cavity.
The skin depth is given by (Balanis, 1989) ω ωεσ ε μ δ 2 / 1 2 1 1 2 − ⎟ ⎟ ⎠ ⎞ ⎜ ⎜ ⎝ ⎛ − ⎟ ⎠ ⎞ ⎜ ⎝ ⎛ + = o o o h , (05)
where εo and μo are the permittivity and magnetic permeability of vacuum, ω the angular
frequency of the propagating wave, and σ the medium conductivity. For large conductivities,
o ωε σ >> , Equation (05) reduces to ωσ μ δ o h 2 = . (06)
The quality factor of the cavity, or Q-factor, is defined by m peak m m m m m I e R Q ≡ ωω ≈ωΔω ) ( 2 ) ( , (07)
where Re and Im are the real and imaginary parts of the complex eigenfrequency, ωmpeak the
peak power frequency of mode m, and Δωm the width of the line at half-power. Physically, the
Q-factor is the ratio of the energy stored in the field over the energy lost during one oscillation period. An expedient way of estimating the quality factor consists in using the ratio of the resonator thickness over the skin depth of the electric field, Q ∝ h/δh (Nickolaenko and
Hayakawa, 2002). Increasing the ionosphere height augments the quality factor; losses are more important when the boundary is poorly conducting and the skin depth large.
The surface of Earth is generally assumed to be a perfect electric conductor (PEC) because its conductivity is of the order of 0.01 and 1 Sm-1 (Lide et al., 2006) on land and sea, respectively, whereas that of Titan, for example, is closer to a good dielectric and has a conductivity in the order of 10-10 Sm-1 (Grard et al., 2006) [Paper 3]. The skin depth on the surface of Earth is ~1 km that is two orders of magnitude lower than the height of the ionosphere. Consequently, the inner boundary of the cavity is the surface.
A contrasting situation occurs on Titan, where δh>103 km, because the surface is a poor
reflector of ELF waves and cannot be considered as the inner boundary. The cavity is more intricate; ELF waves penetrate the soil and the surface is not a PEC (Simões et al., 2007a)
[Paper 4]. In this case, the inner boundary is located below the surface.
The cavities of the giant planets present additional constraints because their surface is not well defined (Simões et al., 2007b) [Paper 9]. The ionosphere, though sometimes fuzzy and dynamic, represents the outer boundary for all the cavities.
In a first approximation, the cavity generally consists of two concentric spherical shells, but this is not always the case. On Earth, three peculiarities contribute to alter the spherical symmetry of the cavity, namely the day-night asymmetry, the polar non-uniformity (latitude dependence of the conductivity profile), and the geomagnetic dipole (Galejs, 1972; Bazarova and Rybachek, 1978). This asymmetry is in principle responsible for a partial or total line splitting, i.e. the eigenmode degeneracy is removed (Bliokh et al., 1968). Recent observations have shown evidences of line splitting and amplitude variation due to cavity heterogeneity, namely the day-night asymmetry (Sátori et al., 2007; Nickolaenko and Sentman, 2007).
2.1.2. General Formalism
Following a simplified formulation of the Schumann resonance frequency and the description of typical cavities in the Solar System, we shall now describe the general formalism that leads to the eigenfrequencies and eigenfunctions of the cavity. A full treatment of the Schumann resonance in a planetary cavity requires the solution of Maxwell equations,
t ∂ ∂ − = × ∇ E B , (08) t ∂ ∂ + = × ∇ H σE D, (09) E D=εεo , B=μoH, (10)
where E and D are the electric and displacement fields, H and B the magnetic field strength and flux density, and ε the relative permittivity.
Taking into account the cavity characteristics and decoupling the electric and magnetic fields, Equations (08-10) can be solved in spherical coordinates (r, θ, ϕ), using the harmonic propagation approximation. One mode is characterized by Hr=0 and is called the transverse
magnetic (TM) wave, the other one by Er=0 and is known as the transverse electric (TE)
wave. Neglecting the asymmetry of the cavity, and consideringh/R<<1, the standard method of separation of variables yields (Bliokh et al., 1980)
(
)
(
( ))
0 ) ( 1 ) ( ) ( 1 2 2 2 2 2 2 2 = ℜ ⎪⎭ ⎪ ⎬ ⎫ ⎪⎩ ⎪ ⎨ ⎧ ⎟ ⎟ ⎠ ⎞ ⎜ ⎜ ⎝ ⎛ − + + − r r r dr d r r c r n n dr d ε ε ε ω , (11)where ℜ(r) is a radial function related to the electric and magnetic fields by the Debye potentials (Wait, 1962). This equation gives the eigenvalues of the longitudinal and transverse modes, assuming either dℜ(r)/dr=0 or ℜ(r)=0 at both boundaries, respectively. For a thin void cavity the eigenvalues are those given by Equations (02)-(03) and ℜ(r) is a linear combination of Hankel functions. However, the previous approximation is no longer valid when the thickness is commensurate with the cavity radius; the separation between the TM and TE modes gives inaccurate results and Equation (11) is inappropriate. When the cavity is not spherical and is significantly thick, or when the conductivity profile deviates from an exponential law, the analytical approximations are no longer valid and Equations (08-10) must be solved numerically.
Although some approximations are accurate enough for the Earth cavity, the analytical models are generally not applicable to other environments. These simplified approaches are nevertheless useful because they give an insight into the role played by physical parameters that control wave propagation.
The model of Greifinger and Greifinger (1978) is widely used for calculating the propagation constant; it assumes an exponential law for the conductivity profile. This assumption is acceptable for Earth, less suitable for Venus, and inaccurate for Titan. The model was first used in planar geometry and its generalization to spherical coordinates was introduced by Sentman (1990). Both planar and spherical models lead to equivalent results for thin cavities. We shall therefore recapitulate the results obtained in planar geometry when the atmospheric and ionospheric conductivity profiles follow the exponential law:
( )
⎟⎟ ⎠ ⎞ ⎜⎜ ⎝ ⎛ = h o g z z σ exp σ , (12)where z is the altitude, gh the scale height, and σo the conductivity at the surface. The
conductivity profile is characterized by two altitudes, ho and h1, usually known as height of
cut-off of the electric field and height of diffusion of the magnetic field, respectively. By definition, the height of cut-off for electric field is reached when σ=ωεo and is given by
( )
⎟⎟ ⎠ ⎞ ⎜⎜ ⎝ ⎛ = o o h o g h σ ωε ω ln . (13)( )
( )
⎟ ⎠ ⎞ ⎜ ⎝ ⎛ − = c g g h h1 ω o ω 2 hln 2 hω . (14)The ELF propagation constant, ν, is a function of frequency and is written (Greifinger and Greifinger, 1978)
(
)
( )
( )
2 / 2 / 1 1 1 2 π ω π ω ω ν ν o o ig h ig h R c − + ⎟ ⎠ ⎞ ⎜ ⎝ ⎛ = + . (15)The real and imaginary components of the propagation constant, νr and νi, can be derived from Equation (15), yielding when gh<<go andgh<<g1,
( )
( )
( )
ω ω ω ω ν 0 1 h h R c r = (16) and( )
( )
( )
⎟⎟ ⎠ ⎞ ⎜⎜ ⎝ ⎛ + = ω ω ωπ ω ν 1 1 4 h g h g c R o o i . (17)As already mentioned, Equations (16-17) are strictly valid in planar geometry but are still applicable in spherical coordinates provided the radius of curvature is much larger than the skin depth (Sentman, 1990).
The limitation of the exponential approximation for the conductivity profile is extensively covered in the literature, namely dependence upon latitude, day-night asymmetry, geomagnetic field, etc. These constraints are extremely limiting in analytical studies, but are not relevant in numerical models, which consider arbitrary conductivity profiles. The analytical results, though restricted to specific conductivity models, nevertheless provide information that supports the interpretation of the numerical results.
2.2. Energy Sources and Global Circuit
The development and maintenance of resonance phenomena in planetary cavities require suitable electromagnetic sources. On Earth, lightning is the most important excitation source for Schumann resonances; it has been extensively studied in relation with atmospheric electricity, weather phenomena, and hazard prevention. Most lightning discharges on Earth are produced by precipitating clouds that contain water in solid and liquid phases. The two major requirements for lightning generation are: (i) interaction between particles of different types or between particles of the same type, but with different thermodynamic properties; (ii) significant spatial separation of the oppositely charged particles by convection or gravitational forces. In terrestrial lightning, the cloud-to-ground discharges are the most studied because they are the strongest and easiest to detect. However, it is not certain this type of lightning events occurs in other planetary atmospheres.
On Earth, lightning-like discharges produced by dust are also possible, though they release less energy per stroke. Electrical sparks, hundreds of meters long, can be produced via charge generation and separation in volcano eruptions (Rakov and Uman, 2003). Turbulent meteorological phenomena associated with dust storms are also closely related with discharging processes. Magnetohydrodynamic waves have also been proposed as a complementary source to lightning for the Earth’s Schumann resonance (Abbas, 1968).
However, unlike the unambiguous lightning contribution, the role played by other sources requires further investigations.
Though not exhaustive, Table 1 summarizes some of the most important works dealing with observations, models, and global features of the Schumann resonance. Several advances in Earth cavity characterization can be applied to other planetary environments; this is one of the objectives of this thesis (Simões et al., 2007a; Simões et al., 2007b; Simões et al., 2007c)
[Papers 4, 9, and 10].
Subject Contribution Reference
First theoretical model
of Earth cavity Prediction of ELF global resonances in the Earth cavity; lightning is suggested as the main electromagnetic source
Schumann (1952)
Diurnal variations First observation of the phenomenon and of its daily variation
Balser and Wagner (1960)
Stratospheric
nuclear explosions Disturbances in frequency spectra - one explosion shifts the resonance downwards by ~0.5 Hz
Gendrin and Stefant (1962) Madden and Thompson (1965) Cavity asymmetry Influence of day-night ionospheric asymmetry on resonances
– line splitting
Galejs (1970) Sátori et al. (2007) Cavity asymmetry Influence of polar non-uniformity on resonances – line
splitting
Bazarova
and Rybachek (1978) Cavity asymmetry Influence of geomagnetic dipole on resonances – line
splitting
Nickolaenko and Hayakawa (2002) Cavity theoretical
parameterization Cavity parameterization with exponential conductivity profile and 2 scale heights
Greifinger
and Greifinger (1978) Solar cycle Resonances are modulated by solar cycle and respond to
solar flares, magnetic storms and solar proton events
Reid (1986)
Hale and Baginski (1987) Thunderstorm activity Lightning as a tool for weather studies Williams (1992) Morphological features Application of the resonance variability to the study of global
lightning
Sentman (1995); Heckman et al. (1998) Morphological features Application of resonance variability to the study of sprite
activity
Boccippio et al. (1995)
Line splitting Attempts to measure resonance line splitting Sentman (1989) Bliokh et al. (1980) Labendz (1998)
Nickolaenko and Sentman (2007) Altitude Does frequency vary with altitude? Ogawa et al. (1979)
Morente et al. (2004) Ionospheric height
upper boundary
Dependence of intensity upon height of the ionosphere Sentman and Fraser (1999) Solar proton events Observation of increases in amplitude, frequency, and
Q-factor
Schlegel and Fullekrug (1999)
Lightning induced by sprites
Sprite lightning observed around the world with the Schumann resonance method
Williams et al. (2007a,b)
Table 1: Contributions to the study of the Schumann resonance in the Earth cavity.
The upper atmospheres of planets and satellites are ionised, partly due to interactions with solar photons and cosmic rays. The lower atmosphere of Earth is poorly conductive and is permeated by a current system that is driven by active thunderstorm clouds which act as generators, with return currents in fair weather regions. The highly conductive ground and ionosphere form the boundaries of this global electric circuit.
The global electric circuit is the system that involves the surface, atmosphere, ionosphere, and magnetosphere of Earth, which form together, a global spherical capacitor. The global circuit is sustained by thunderstorms, which raise the potential difference between the inner and outer boundaries up to several hundred thousand volts, and drive vertical currents through the atmosphere. The electric field is larger near the Earth surface, where it reaches ~100 Vm-1 in fair weather conditions. Siingh et al. (2007) and Aplin (2006) present an overview of the atmospheric global electric circuit of Earth and electrification processes in the Solar System,
respectively, and discuss the various charging mechanisms that play a role in atmospheric electricity.
Table 2 lists the possible electromagnetic sources that might contribute to develop resonance states in planetary cavities. Three atmospheric phenomena lightning - corona discharge and triboelectricity – are possible candidates but only the most likely one is specified for each body. It is nevertheless important to mention that, in some cases, the given scenario is even somewhat uncertain, namely on Venus, Mars, and Titan.
Body Electromagnetic source Reference
Venus Possibly lightning Russel (1991); Strangeway (2004) Earth Lightning e.g. Nickolaenko and Hayakawa (2002) Mars Possibly dust devils / dust storms Farrell and Desch (2001); Aplin (2006) Jupiter Lightning Gurnett et al. (1979); Lanzerotti et al. (1996) Saturn Lightning Fischer et al. (2006)
Titan Possibly lightning / haze / magnetosphere Fischer et al. (2004); Béghin et al. (2007) [Paper 5] Uranus Likely lightning Zarka and Pedersen (1986)
Neptune Likely lightning Gurnett et al. (1990)
Table 2: Major energy sources in various cavities (Simões et al., 2007b) [Paper 9].
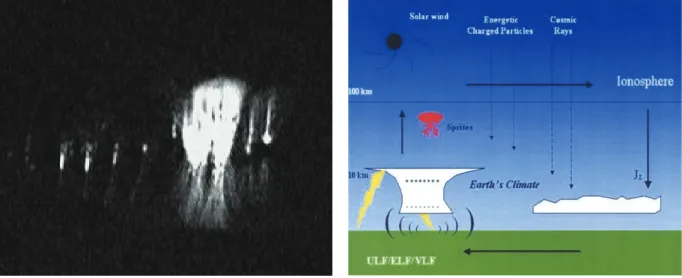
On Earth, according to Harrison and Carslaw (2003), current discharges triggered by lightning cause a weak electrification of stratified clouds and produce a vertical potential gradient in atmospheric layers near the surface. Horizontal currents flow on the highly conductive surface and in the ionosphere. Currents that flow from the ground to the clouds, and also from the top of the clouds to the ionosphere, close the circuit. Hence, several types of discharging processes are possible, high-energy cloud-to-ground strokes, intercloud and intracloud discharges, and upward currents flowing from thunderstorm clouds to the ionosphere (Wilson currents). Several types of transient luminous phenomena related to upward currents, towards the ionosphere, have been observed from Earth orbit, stratospheric balloons, airplanes, and ground observatories (Figure 1). For example, high altitude atmospheric phenomena such as blue jets, red sprites, and elves have been investigated. These intriguing atmospheric phenomena present interesting opportunities to broaden our knowledge of atmospheric electricity. It is expected that future space based instrumentation, namely TARANIS, a micro satellite project dedicated to the study of impulsive transfers of energy between the Earth atmosphere, the ionosphere, and the magnetosphere (Blanc et al., 2007), contribute to clarify the nature and working mechanisms of these interesting phenomena. Additionally, recent works have been merging Schumann resonances and sprites studied to understand their interrelation (Williams et al., 2007b). Although the number of transient luminous events detected per night by FORMOSAT2 is ~10 (F. Lefeuvre, personal communication), which is much lower than the lightning rate, several researchers suggest this type of discharges may influence the Schumann resonance spectrum (Williams et al., 2007c).
Although several discharging processes take place on Earth it is not clear whether these processes take place in other planetary environments. Varying cloud compositions or low surface conductivities change the global electric circuit properties, and any comparison between the planets must be done with caution. For example, lightning events have been detected on the giant planets but remain a controversial issue on Venus. Nevertheless, recent
Venus Express results, Russell et al. (2007) apparently solve the dispute; they have found evidences of lightning on Venus inferred from whistler-mode waves in the ionosphere.
Figure 1: Image of typical transient luminous events observed at Observatoire Midi-Pyrénées, France (left, courtesy of F. Lefeuvre) and sketch of the global electric discharges mechanisms (right, Rycroft and Fullekrug, 2004).
Lightning is the major excitation source in the Earth cavity and discharges between thunderclouds and the surface produce the most powerful strokes; they radiate strong radio noise bursts which cover the ELF-VLF frequency range up to the radio band. Temporal and spatial lightning distributions are functions of many parameters but the global stroke rate is the highest over continents, mainly tropical regions (Figure 2).
Figure 2: Satellite observation of global lightning distribution. (Credit: GSFC-NASA, National Space Science and Technology Centre Lightning Team).
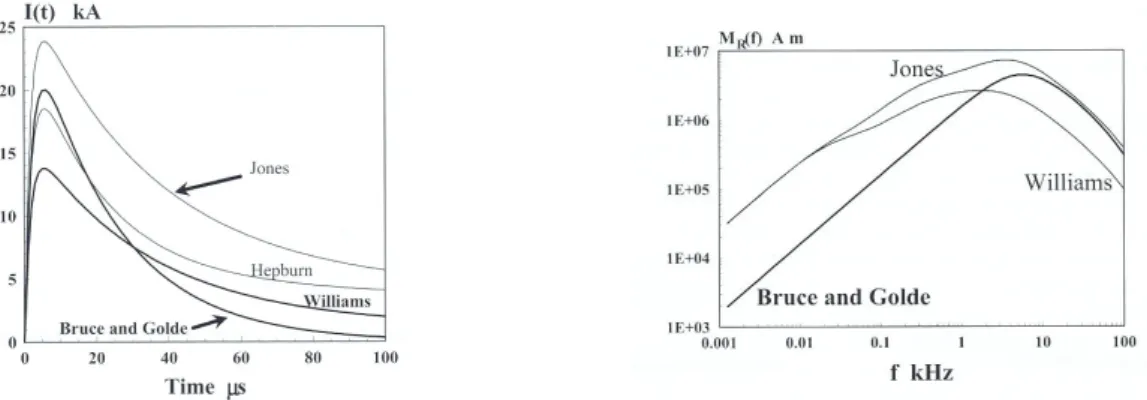
Table 3 lists the most representative characteristics of lightning events and Figure 3 shows their typical profiles vs. time and frequency.
flashes/km
2/y
In spite of significant advances about lightning characterization, most authors consider that the excitation source is a vertical dipole with arbitrary amplitude and a flat spectrum. We shall use a similar approach, though we also consider horizontal dipoles.
Parameter Characteristic Energy 109 J Leader duration 50 μs Pulse duration 100 ms Peak current 20 kA Global rate 60 s-1 Charge 10 C
Spatial distribution Tropical regions of Africa, America, Asia Daily distribution Maximum at about 18 h local time Radiation frequency distribution Broad peak centred in the kHz range
Table 3: Typical characteristics of lightning strokes, compiled from Rakow and Uman (2003).
Figure 3: Characteristics of lightning strokes derived from several models: impulsive current waveforms (left; units: [kA]) and spectra (right; units: [Am]), [ Nickolaenko and Hayakawa (2002)].
3. Numerical Model for Ionospheric Planetary Cavities
3.1. Numerical Tool
Calculating with accuracy the eigenfrequencies and eigenvalues of the cavity requires the utilization of numerical models, because the analytical approximations are inaccurate or not applicable at all due to the intricacy of the conductivity profiles. Thus, a numerical approach, based on the finite element method, might offer the most convenient solution to this problem. Equations (08-10) are solved in 3D geometry, or 2D axisymmetric geometry whenever applicable. Two types of algorithms are available: eigenfrequency and time-harmonic propagation analysis. Most of the numerical results presented in the thesis have been obtained with the COMSOL Multiphysics tools, which employ the finite element method with non structured meshes (Zimmerman, 2006). We shall not describe these tools in great detail, but we shall nevertheless discuss some relevant topics such as equations format, solver reliability, boundary conditions, and medium properties. The algorithms yield the complex eigenfrequencies, the electric and magnetic field profiles, and the ELF-VLF spectra. More specific tasks concern parametric studies as functions of frequency and medium properties. The medium properties are: (i) linear and isotropic in all cases; (ii) functions of radius for spherically symmetric cavities; (iii) functions of radius and angle for asymmetric cavities.
3.1.1. The 2D axisymmetric Approximation
A cavity consisting of concentric shells, where the medium properties are functions of radial distance only, can be solved in 2D axisymmetric configuration. This approach minimizes memory and time requirements and provides accurate solutions. There is no particular constraint regarding eigenfrequency analysis; the time-harmonic propagation studies require the utilization of a vertical dipole along the axis of symmetry (Simões and Hamelin, 2006) [Paper 8]. The eigenfrequency analysis does not require a very fine mesh, and the cavity is composed of about 5×10⁴ elements, which also provides a reasonable accuracy in the time harmonic propagation mode. Figure 4 shows a typical 2D axisymmetric geometry with a vertical dipole aligned with the axis of symmetry. Equations (08-10) can be simplified in 2D axisymmetric geometry (r, ϕ, z) when there is no variation with the angle ϕ. Considering E(r,z)=Er(r,z)êr+Eϕ(r,z)êϕ +Ez(r,z)êz and H(r,z)=Hr(r,z)êr+Hϕ(r,z)êϕ +Hz(r,z)êz,