EcoGRAFI
2nd International Conference on Bio-based Building Materials & 1st Conference on ECOlogical valorisation of GRAnular and FIbrous materials June 21th - 23th 2017
Clermont-Ferrand, France
PHYSICAL CHARACTERISATION OF HEMP SHIV: CELL WALL STRUCTURE
AND POROSITY
Y. Jiang1*, M.P. Ansell1, X. Jia2, A. Hussain1, M. Lawrence1
1 BRE Centre for Innovative Construction Materials, Department of Architecture and Civil
Engineering, University of Bath, BA2 7AY, UK
2 School of Chemical and Process Engineering, University of Leeds, LS2 9JT, UK
*Corresponding author; e-mail: [email protected]
Abstract
Hemp shiv has been widely used as a plant aggregate incorporated into natural building composites such as hemp-lime due to its low thermal conductivity and high moisture buffer value. The aim of this research is to study the intrinsic physical parameters such as the porosity and cell wall structure of hemp shiv, which are responsible for the favourable thermal and hygric properties of hemp shiv. Scanning electron microscope observations of hemp shiv revealed microstructural features. A computed tomography (CT) scan improved the vizualization of pore shape and pore connectivity in three dimensions. The vessels exhibit little variation in size and there is no clear pore arrangement with a diffuse-porous distribution. The vessels are mostly solitary although some small groups of adjacent vessels exhibit shared cell walls between them. The vessels are approximately 50 to 100 µm in diameter and are surrounded by relatively thick fibre cells. These thick-walled fibres are located between the vessels with a diameter ranging from 1µm to 2µm. The pore frequency of hemp shiv (generally only measured on diffuse-porous woods) is around 20.8 vessels/mm2. The porosity of hemp shiv has been studied by a
combination of mercury intrusion porosimetry (MIP) and CT scanning. Average accessible porosity of hemp shiv is 76.67 ± 2.03 % measured by MIP measurement and from 50% to 75% measured by CT, depending on the threshold and resolution.
Keywords:
Hemp shiv, Microstructure, SEM, Porosity, Pore distribution, CT scanner and MIP
1 INTRODUCTION
Bio-based insulation materials, such as hemp, flax and wheat straw offer a number of benefits in comparison with more established mineral and oil-based alternatives, such as mineral wool and PUR (polyurethane rigid foam) based products. Resourcing advantages include a renewable supply chain and significantly reduced carbon footprint through the photosynthetic carbon stored within plant based materials [Magniont 2012, Chabannes 2015]. Previous research on the physical properties of hemp-lime has highlighted that the material presents a good balance between low mass and heat storage capacity compared with classical insulation materials. Hemp shiv is the woody core extracted from the hemp stem as a co-product of the process of hemp fibre extraction. It is a cheap and low density material (bulk density: 80-160 kg/m3) with associated low thermal
conductivity (0.04-0.08 W/k.m) depending on the density and moisture level [Shea 2012, Collet 2014a, Barclay 2014, Mazhoud 2016, Collet 2014b, Walker 2014, Latif 2014]. Much of the existing characterization data for natural building materials relates to structural performance such as cell wall microstructure and porosity. Unlike traditional aggregates, owing to the
structure of the stem of the plant they are made from, such aggregates are generally malleable, elongated and highly porous with apparent low density. Hence, the characterization of these aggregates, which is crucial for a proper awareness of the quality of the materials in which they are incorporated, requires adaptations to be made to current techniques or the development of new characterization procedures. Apart from timber, hemp-lime is perhaps the most researched bio-based building material, but the characterization of the properties of this and other bio-based building materials is at an early stage. Studies are on-going into characterization and characterization techniques – led by a RILEM international committees on bio aggregate based building materials.
Recently, several studies have investigated the microstructure of hemp shiv. Magniont et al [2012] reported that hemp shiv was embedded into resin and polished and a cross section of hemp shiv was studied by SEM. They showed hemp shiv is mainly composed of conducting vessels. The diameter of the vessels usually ranges from 10 to 20 µm. In addition, larger vessels were also observed in longitudinal section. Lawrence et al [2012] found the microstructure of hemp shiv exhibited 50 µm pores connected to 10 µm
pores via 1 µm connecting pores. Dubois et al [2014] showed a section through one hemp shiv obtained by X-ray microtomography. The high total porosity of the vegetal particle can be clearly seen with the typical tubular structure of the mesoscopic pores. However, there is no one study which provides all the details of the cell wall microstructure of hemp shiv.
Porosity is quite a simple parameter to define, but is not so easy to quantify. The reason is that the void/space in hemp shiv can span from few nanometres to millimetres or larger. There is currently no one measurement method that can adequately cover this enormous range in scale. In addition, the porosity can be modified or changed by a variety of processes during the porosity measurement such as deformation, hydrothermal alteration and the production of secondary or fracture porosity. Finally, the pore shape and connection structure (open and closed) have a significant effect on the porosity results depending on the testing approach [Bismarck 2002, Brewer 2014, Chundawat 2011, Collet 2008, Donato 2012, Hamdi 2015, Jerram 2007]. Nguyen et al [2009] studied the inter porosity of hemp shiv using the pycnometer method, with toluene as the fluid filling. Pure hemp shiv aggregates possessed an inter porosity of 60% whilst fibrous hemp shiv had an inter porosity of 76.6%. Manger [1963] concluded that most of the total porosity measurements are variations on bulk volume/grain volume or bulk density/grain density approaches, and the apparent porosity measurements are made by absorption methods employing different fluids or gases. Anovitz et al. summarized 10 methods for measuring the porosity and pore size distribution (PSD) used on core or crushed rock materials (Fig. 1), revealing the range of pore sizes that each method is capable of measuring [Anovitz 2015]. It should be kept in mind that different techniques are based on different principles and have different capabilities for measurement. Depending on the natural properties of bio-aggregates, there is no best approach to determine their porosity. The combination of several techniques and comparison of results of pore structure investigations from different methods may give an insight into the complex pore system of bio-aggregates.
Fig. 1 Methods used to determine porosity and pore size distribution (PSD) [Anovitz 2015]
In this study, the hemp shiv was studied by SEM in three orthotropic directions, which are commonly defined as longitudinal (L), along the fibres; radial (R), perpendicular to the rings; and tangential (T), tangential to the rings. The porosity of hemp shiv has been fully studied and characterised by employing MIP and CT microtomography.
2 MATERIALS AND METHODS
The hemp shiv used in this study was obtained from the CAVAC Company (France), produced by a mechanical de-fibreing process. The particles of hemp shiv have a mean length of 7.6 mm and a mean width of 2.4 mm for Grade 8 shiv. For measurements performed in a dry state, the hemp shiv was dried in an oven at 60° until constant mass is reached (i.e. mass variation lower than 0.1% between two consecutive weighings for three consecutive weighings within a 24-hour period). Then, they were cooled to ambient temperature in a sealed container. The bulk density of hemp shiv is about 85-90 kg/m3.
A scanning electron microscope (JEOL SEM-6480LV, Tokyo, Japan) was used for microstructural analysis of the hemp shiv. All images were taken at an accelerating voltage of 10 kV. The sample surfaces were coated with a thin layer of gold using an HHV500 sputter coater (Crawley, UK) to provide electrical conductivity.
A CT scanner (Nikon XT H 225) was used to capture the 3D image of hemp shiv specimens. The scanning parameters were fixed at a voltage of 90 kV and current of 108 lA. The area of each pixel is 2.54 µm2.
The CT scan data were merged using the DigiUtility software (Structure Vision Ltd, UK). The value of white pixels is 0 which represents the pore (air) phase, while the value of blue pixels is 255 which represents the hemp shiv cell wall phase. By calculating the average fraction between the 0 and 255 of every column of the matrix, the average porosity of hemp shiv specimens could be defined. The Gaussian distribution was used to reduce noise and determine the threshold.
An Autopore Mercury Porosimeter (PASCAL, Thermo Scientific) was used to determine the porosity and pore size distribution of hemp shiv. The measurements were undertaken on four samples (between 0.15 – 0.2 g). PSD f(r) was determined using the Washburn equation. This relates the radius r of pores (assumed to be cylindrical) to the imposed pressure P as follows: P = (-2γcosθ)/r
where:
γ = Interfacial energy (surface tension) of mercury θ = contact angle of mercury with the material
Common values of γ and θ (which assume interfaces involving a gas or vapour phase) are 485 mJ/m2 and
140°. Whilst pores are rarely cylindrical, the Washburn equation is generally accepted as a practical method of analysing what are normally very complex pore systems [Washburn 1921]. The results were plotted in two graphical forms. In the first form, the cumulative pore volume was plotted against a logarithmically spaced abscissa, and in the second form the differential PSD based on the logarithmic differentiation dv/dlgR was calculated. The mercury in the porosimeter is intruded to the replicates at a speed 7-28 MPa/min. The test pressure ranges from 0.0001 MPa to 400 MPa. As a result, the ranges of the pore diameter on the cumulative curve and differential curve were 0.003 μm and 100 μm respectively. This wide range allows the detection of diverse shiv pore classes along the PSD curve.
3 RESULTS AND DISCUSSIONS
3.1 Microstructure of hemp shiv
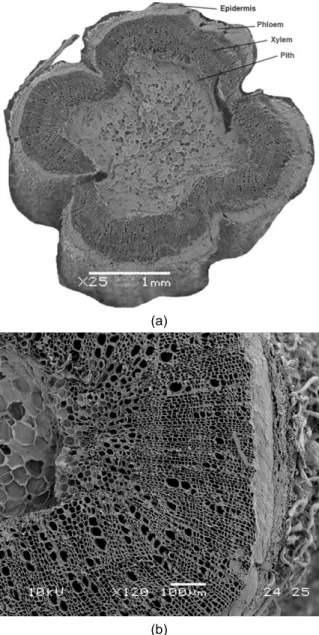
The different parts of the hemp stem have been identified as the epidermis layer, the phloem layer, the xylem layer and the pith layer from the outside to the centre of its cross section as shown in Fig. 2a. From the interior to the exterior of the hemp stem, the three zones of pith, vascular cambium and cortex are clearly visible. It can be seen that the fibre cross-section has an indented shape, similar to a four-leaf clover, which enhances the rigidity of the stem. At higher magnification (Fig. 2b), the radial arrangement of cells in the vascular cambium is visible. In the vascular cambium there is a subtle boundary between the cells in the outer secondary phloem and the inner secondary xylem. A closer view of the pith reveals the foam-like closed cell structure with some voids at the interfaces between cells. The external surface of the unretted hemp is covered in mechanical fibres (Fig. 2b), which are removed during the retting process and subsequently converted into yarns and woven fabrics. The vascular cambium contains a range of cell diameters the larger cells being termed vessels.
(a)
(b)
Fig. 2 Cross-section through hemp stem: (a) Magnification x25 and (b) Magnification x75
A longitudinal section through the hemp shiv (Fig. 3), produced by splitting, reveals the inner surface of
vessels containing perforations which allow movement of moisture from cell to cell along the stem. These perforations connect smaller cells with the vessels. Some radial structure is seen in the top left hand corner of the image and movement of moisture between radial and longitudinal calls can occur via pit openings.
Fig. 3 Longitudinal section through a hemp shiv revealing cell wall perforations
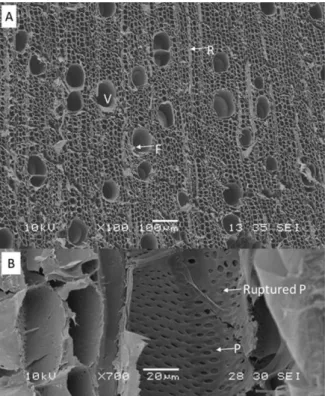
The detailed structure of a typical hemp shiv is presented in Fig. 4. The vessels exhibit little variation in size and no clear pore arrangement, which is a diffuse-porous distribution. The vessels are mostly solitary although some small groups of adjacent vessels exhibit shared cell walls between them. The vessels are approximately 50 to 100 µm in diameter and are surrounded by relatively thick fibre cells. Thick-walled fibres are located between the vessels with a diameter from 1 µm to 2 µm. The pore frequency of hemp shiv is around 20.8 vessels/mm2. There are no
tyloses or other contents in the vessels. The fibres are thick-walled and sparsely pitted and include fibre tracheid with bordered pits and libriform fibres with simple pits. It is possible to see examples of ray parenchyma within the diffuse-porous distribution. Radial cells run top to bottom with bridging fibril in the central vessel and multiseriate rays are seen in axial view on the cross-section surface. Fig 4B shows the ray parenchyma cells in radial longitudinal section, and pits can be seen in the secondary wall. The pit membranes are intact in the circular pits, but some of them have ruptured. Extensive intervessel pitting plates are seen between the vessel elements. Intervessel pits are 2 µm - 4 µm in horizontal diameter. Fig. 5 shows a clear interface (white dotted line) between zones with smaller (lower) and larger (upper) longitudinal cells. The large parenchyma cells seen in the upper section of Fig. 5A have an average diameter of approximately 5-10 µm, whereas the size of the parenchyma cells in the lower section of Fig. 5A is much smaller (approximately 1 µm - 5 µm). The parenchyma cells have two different shapes: the form of a pillow (rays) or a barrel (pith). Wall thickness varies from that of fibres to that of axial parenchyma. The diameters of fibre lumens range from being similar to fibres to as large as vessels. Nuclei and starch particles were not observed in these cells (Fig. 5B). Several bridging fibrils in vessels can be seen in Fig. 5B, 5C and 5D. The middle lamella and primary walls can be seen to be overlaid by a thick secondary wall. In this particular photograph the S3 layer appears to have been separated from the S2 layer when the transverse surface cut was made.
The warty layer can just be distinguished on the surface of the secondary wall. The secondary walls of vessels in hemp shiv are overlaid by a warty layer, which is denser in some areas. The vessel member walls are not always covered in pits. Some walls show prolific vessel to vessel pitting while others are completely devoid of pits. Multiseriate rays with horizontal resin canals and uniseriate rays can be seen in the tangential section of hemp shiv. Bordered pits and helical thickening can be seen within the tracheid cavities. Secondary walls are present and exhibit numerous simple pits. Cross-field pitting is seen in a radial longitudinal view of the vessel members of hemp shiv. The groups of pits on the walls of the vessel members complement the pits in the ray cells passing behind. The pores are arranged in radial files. The vessel members show helical thickening on their walls and profuse vessel to vessel pitting.
Fig. 4 Scanning electron micrograph of the porous hemp shiv, showing vessels with diameters from 50 to 100 µm on the transverse surface. Radial cells run top
to bottom with bridging fibril in the central vessel. Thick-walled fibres are located between the vessels
with a diameter from 1 µm to 2 µm. Transverse overview (A), with ray parenchyma (R), fibres (F) and
vessels (V). Radial longitudinal view (B), showing simple pits (P) and ruptured pit (Ruptured P)
The transverse view of hemp shiv illustrates the concentric bands of fibres alternating with vessels and axial parenchyma. A concentric band of vessels in hemp shiv can be seen in the tangential and transverse views. Small pores below 1 µm in size can been found between cell wall layers.
Fig. 5 Scanning electron micrograph of the porous hemp shiv, showing Interface between zones with smaller (lower) and larger (upper) longitudinal cells (A). A close-up view of the vessels shows a bridging fibril in the central vessel (B). The secondary walls of vessels
in hemp shiv overlaid by a warty layer (WL) and several fibrils in the vessels (C). Fibres (F), vessels (V), fibre wall (FW), fibre lumen (FL), simple pits (P),
warty layer (WL) and dotted line (interface)
3.2 Porosity and pore size distribution
Table 1 shows the total mercury intrusion volume, total porosity and median pore diameter of hemp shiv tested by the MIP measurement. The total intrusion volume of hemp shiv is on average 2.415 ± 0.104 mm3/g and the
total pore surface area is around 57.61 ± 7.44 m2/g.
The total accessible porosity of hemp shiv is in the range 76.67 ± 2.03 %. The common skeletal density of 1.47 g/cm3 for the hemp shiv cell wall has been used
to calculate the inaccessible porosity [Anovitz 2015]. The results shows that the inaccessible porosity is about 0.46 ± 0.18 %. It indicates that there is only a small proportion of tiny pores or closed pores, which cannot be accessed by mercury. A possible compression of the samples due to the applied high pressure during the MIP measurements would influence the measured pore volumes. Plotze et al. [2011] showed that some wood samples (white lauan, Afzelia, Macassar ebony, Gaboon, beech, False acacia, Ramin, and yew) have a very small sample compression <5% of the measured cumulative pore volume.
Tab. 1: Some porosity characteristics with ± standard errors of the hemp shiv as determined by mercury porosimetry in the pressure range of 0.0001–400 MPa.
Hemp shiv Total intrusion volume Total pore area Median pore diameter Porosity (Accessible) Porosity (Inaccessible) (g) (cm3/g) (m2/g) (µm) (%) (%) 0.1047 2.429 49.81 0.52 77.93 0.24 0.0174 2.369 66.45 0.57 73.45 0.46 0.0655 2.574 63.49 0.54 78.78 0.40 0.1089 2.289 50.69 0.42 76.51 0.75 2.415 ± 0.104 57.61 ± 7.44 0.51 ± 0.056 76.67 ± 2.03 0.46 ± 0.18
In the study described in this paper, varying amounts of hemp shiv, ranging from 0.0174 g to 0.1089 g, were used for porosity tests. No significant difference in porosity results was found for different amounts of sample (Table 1). A correlation between sample volume and total intrusion volume was not found. This indicates that the pore structure did not change during the MIP measurement. However, it is important to keep in mind that mercury porosimetry has limitations, such as the limitation of pore size (diameter between 3nm and 100 µm) and the possibility of compression or damage to the pore structure by the high pressure involved.
Fig. 6 shows cumulative pore volume and the pore size distribution curve of hemp shiv with various sample mass. Because of technical restrictions the measurement of the large tracheids larger than 100 µm is excluded. Those pores are on the one hand important openings for impregnation but on the other hand easily accessible already with low or no applied pressure. The pore sizes of hemp shiv show a bimodal pore size distribution with two clearly separated peaks. Fig. 6 illustrates that hemp shiv has a wide range of pore size distributions. The main pore radius ranges from 0.01 µm to 1 µm and the second pore radius peak is between 2 µm and 60 µm. A nanoporosity is observed for smaller pore accesses around 3 nm with a lower peak intensity. This could corresponding to the microvoids or cell wall capillaries. The results show good agreement with the results of SEM. All the samples show a very similar pore size distribution, although there are variations in peaks height between 3 nm and 20 nm.
Fig. 6 Cumulative pore volume and pore size distribution of hemp shiv with different sample mass
determined by mercury intrusion porosimetry
3.3 Microstructure and porosity of hemp shiv from CT measurement
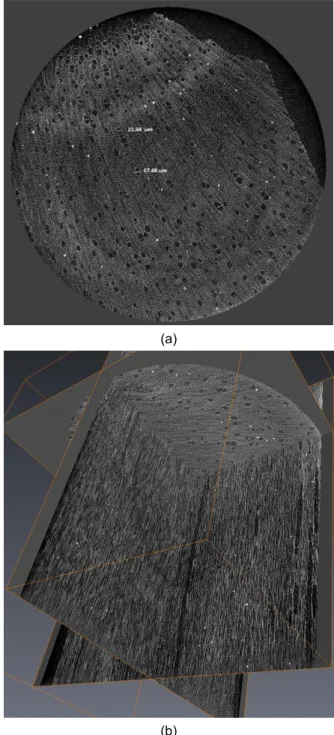
Fig. 7 shows reconstructed sections of hemp shiv from CT scanning. The microtomographic constructions clearly show a high level of anatomical details, revealing structure from larger vessels and ring boundaries down to ray cells and tracheids. Fig.7a is a cross section of hemp shiv, which clearly shows there are some macropores with sizes between 20 µm - 50 µm in the hemp shiv. The pore size and pore size distribution of CT data are in good agreement with that of SEM and MIP data. Fig. 7b shows the microstructure of the inside of hemp shiv. In indicates that a large number of vessels are distributed throughout the hemp structure. The vessels appear as large as approximately 150 µm in diameter. Some vessels tend to be distributed throughout the hemp shiv rather than preferentially occurring close to growth ring boundaries. Smaller hemp features such as tracheids and fibres are an order of magnitudes
microtomography to see them. The CT images give a skeletonized view of the hemp shiv structure showing the orientation and connectivity of the vessels and tracheids.
(a)
(b)
Fig. 7 CT scanning measurement data: volume rendering of a hemp shiv specimen cross section (a)
and internal structure (b)
The CT data have been lightly smoothed using median filtering with a kernel size of 3. The data are then thresholded by CL-Kittler method to produce binary images [Kittler 1986]. Then two global threshold values (T125 and T160) are selected manually based on the LA-Kriging method [Oh 1999]. Voxels with gray scale values smaller than T125 and greater than T160 are assigned to background and foreground classes, respectively. In the second stage, all unclassified voxels with gray intensity values between T125 and T160 are assigned to either the background or foreground class using the maximum likelihood estimate for each voxel independently on the basis of stationary spatial covariance of the image. The number
of voxels that differ between prefiltration and postfiltration stages are calculated. The resulting number is then normalized by the total number of voxels in the image. The macroscopic porosity can be calculated from binarised images. Fig. 8 shows the microstructure of hemp shiv by segmented CT Image with the global LA-Kriging method (threshold 125). The white areas represent air pores and the blue areas represent solid materials. In comparison with Fig 7, it is possible to segment pore space and the solid phase as shown in the Fig. 8 macroporous image. The average porosity of hemp shiv from CT scanning measurement is 50.9%, which is smaller than the results from MIP (76%). The reason is that the porosity from CT measurement only counts the large pores, which are greater than 2.54 µm. In addition, there are a certain number of voxels (23.1%) with gray intensity values between T125 and T160 which have been assigned to background, which has been considered to be solid cell wall.
Fig.8 CT image of hemp shiv. Image segmented with the global LA-Kriging method (threshold 125). White is
air pore and blue is solid. (a) Cross section and (b) Transverse section
4 SUMMARY
The scanning electron microscope observations of hemp shiv showed distinct microstructures. The vessels exhibit little variation in size and no clear pore arrangement, resulting in a diffuse-porous distribution. The vessels are mostly solitary although some small groups of adjacent vessels exhibit shared cell walls between them. The vessels are approximately 50 to 100 µm in diameter and are surrounded by relatively thick fibre cells. Thick-walled fibres are located between the vessels with a diameter from 1µm to 2µm. The pore frequency of hemp shiv (generally only measured on diffuse-porous woods) is around 20.8 vessels/mm2. CT tomography revealed more detail of
the pore shape and pore connection structures of hemp shiv. The average accessible porosity of hemp shiv is 76.67 ± 2.03 % by MIP measurement. The results indicated that the pore structure did not change during the MIP measurement. The average porosity of hemp shiv is from 50% to 75% by CT measurement depending on the threshold and resolutions. The relatively low porosity from CT results is related to the low resolution of the CT scanning image (each pixel is around 2.54 µm). The results presented above clear show that CT images can provide 3D data on hemp shiv microstructure of a sufficient quality for detailed analysis of vessel features, including object segmentation and porosity analysis. As the pore size in bio-aggregates can span from a few nanometers to millimeters, MIP and CT scanning can be used on bio-aggregates to determine their porosity. The combination of the two techniques and comparison of the results of pore structure from two methods provides an insight into the complex pore system of bio-aggregates in a wide range of pore size distributions.
5 ACKNOWLEDGMENTS
This work was supported by the ISOBIO project, which was funded by the European Union Horizon 2020 program.
6 REFERENCES
Anovitz, L.M.; Cole, D.R.; Characterization and analysis of porosity and pore structures. Rev Mineral Geochem. 2015, 80, 61-164.
Barclay, M.; Holcroft, N.; Shea, A.D.; Methods to determine whole building hygrothermal performance of hemp–lime buildings. Building and Environment. 2014, 80, 204-212.
Bismarck, A.; Aranberri‐Askargorta, I.; Springer, J.; Lampke, T. et al.; Surface characterization of flax, hemp and cellulose fibers; surface properties and the water uptake behavior. Polymer Composites. 2002, 23, 872-894.
Brewer, C.E.; Chuang, V.J.; Masiello, C.A.; Gonnermann, H.X. et al.; New approaches to measuring biochar density and porosity. Biomass and Bioenergy. 2014, 66, 176-185.
Chabannes, M.; Nozahic, V.; Amziane, S.; Design and multi-physical properties of a new insulating concrete using sunflower stem aggregates and eco-friendly binders. Materials and Structures. 2015, 48, 1815-1829.
Chundawat, S.P.; Donohoe, B.S.; Costa Sousa, L. da; Elder, T. et al.; Multi-scale visualization and
characterization of lignocellulosic plant cell wall deconstruction during thermochemical pretreatment. Energy & Environmental Science. 2011, 4, 973-984. Collet, F.; Bart, M.; Serres, L.; Miriel, J.; Porous structure and water vapour sorption of hemp-based materials. Construction and building materials. 2008, 22, 1271-1280.
Collet, F.; Pretot, S.; Experimental highlight of hygrothermal phenomena in hemp concrete wall. Building and Environment. 2014a, 82, 459-466. Collet, F.; Pretot, S.; Thermal conductivity of hemp concretes: Variation with formulation, density and water content. Construction and Building Materials. 2014b, 65, 612-619.
Donato, I.; Lazzara, G.; Porosity determination with helium pycnometry as a method to characterize waterlogged woods and the efficacy of the conservation treatments. Archaeometry. 2012, 54, 906-915.
Dubois, S.; Evrard, A.; Lebeau, F.; Modeling the hygrothermal behavior of biobased construction materials. Journal of building physics. 2014, 38, 2014, 191-213.
Hamdi, S.E.; Delisée, C.; Malvestio, J.; Da Silva, N. et al.; X-ray computed microtomography and 2D image analysis for morphological characterization of short lignocellulosic fibers raw materials: A benchmark survey’ Composites Part A: Applied Science and Manufacturing. 2015, 76, 1-9.
Jerram, D.A.; Higgins, M.D.; 3D analysis of rock textures: quantifying igneous microstructures. Elements. 2007, 3, 239-245.
Latif, E.; Tucker, S.; Ciupala, M.A.; Wijeyesekera, D.C. et al.; Hygric properties of hemp bio-insulations with differing compositions. Construction and Building Materials. 2014, 66, 702-711.
Lawrence, M.; Fodde, E.; Paine, K.; Walker, P.; Hygrothermal performance of an experimental hemp-lime building. Key Engineering Materials. 2012, 517, 413-421.
Kittler, J.; Illingworth, J.; Minimum error thresholding. Pattern Recognition. 1986, 19, 41-47.
Magniont, C.; Escadeillas, G.; Coutand M.; Oms-Multon, C.; Use of plant aggregates in building ecomaterials. European Journal of Environmental and Civil Engineering, 2012, 16, s17-s33.
Manger, G.E.; Porosity and bulk density of sedimentary rocks. USGPO, 1963.
Mazhoud, B.; Collet, F.; Pretot, S.; Chamoin, J.; Hygric and thermal properties of hemp-lime plasters. Building and Environment. 2016, 96, 206-216.
Nguyen, T.; Picandet, V.; Amziane, S.; Baley, C.; Influence of compactness and hemp hurd characteristics on the mechanical properties of lime and hemp concrete. European Journal of Environmental and Civil Engineering. 2009, 13:9, 1039-1050.
Oh, W.; Lindquist, W.B.; Image thresholding by indicator Kriging. IEEE Transactions on Pattern Analysis and Machine Intelligence. 1999, 21, 590-602. Plotze, M.; Niezmz, P.; Porosity and pore size distribution of different wood types as determined by mercury intrusion porosimetry. European Journal of Wood Products. 2011, 69, 649-657.
Shea, A.; Lawrence, M.; Walker, P.; Hygrothermal performance of an experimental hemp–lime building. Construction and Building Materials. 2012, 36, 270-275.
Washburn, E.W.; The dynamics of capillary flow. Physical Review. 1921, 273–283.
Walker, R.; Pavía, S.; Moisture transfer and thermal properties of hemp–lime concretes. Construction and Building Materials. 2014, 64, 270-276.
![Fig. 1 Methods used to determine porosity and pore size distribution (PSD) [Anovitz 2015]](https://thumb-eu.123doks.com/thumbv2/123doknet/14750121.579666/2.892.131.410.797.983/fig-methods-used-determine-porosity-pore-distribution-anovitz.webp)