HAL Id: hal-00318130
https://hal.archives-ouvertes.fr/hal-00318130
Submitted on 9 Aug 2006
HAL is a multi-disciplinary open access
archive for the deposit and dissemination of
sci-entific research documents, whether they are
pub-lished or not. The documents may come from
teaching and research institutions in France or
abroad, or from public or private research centers.
L’archive ouverte pluridisciplinaire HAL, est
destinée au dépôt et à la diffusion de documents
scientifiques de niveau recherche, publiés ou non,
émanant des établissements d’enseignement et de
recherche français ou étrangers, des laboratoires
publics ou privés.
Reconnection and energetic particles at the edge of the
exterior cusp
T. Asikainen, K. Mursula
To cite this version:
T. Asikainen, K. Mursula. Reconnection and energetic particles at the edge of the exterior cusp.
Annales Geophysicae, European Geosciences Union, 2006, 24 (7), pp.1949-1956. �hal-00318130�
Reconnection and energetic particles at the edge of the exterior cusp
T. Asikainen and K. MursulaDepartment of Physical Sciences, PoBox 3000, FIN-90014 University of Oulu, Finland
Received: 20 January 2006 – Revised: 10 May 2006 – Accepted: 24 May 2006 – Published: 9 August 2006
Abstract. In this paper we study flux transfer events (FTE) observed at the post-noon edge of the exterior cusp region by Cluster satellites. During the outbound dayside orbit on 2 February 2003, intense bursts of energetic particles were observed in close conjuction with magnetic field FTE signa-tures by the RAPID instrument onboard the Cluster 4. The pitch-angle distribution of the particles showed that the en-hancements consist of particles flowing antiparallel to the magnetosheath field lines away from the expected reconnec-tion site to the exterior cusp. At the same time Cluster 3 observed enhancements of energetic particles deeper in the exterior cusp with a delay of about 40 s to the Cluster 4 en-hancements. The estimated maximum energy gain per par-ticle by reconnection remains below 1 keV, thus clearly be-low the tens to hundreds of keV energy range observed by the RAPID instrument. These observations support the ear-lier statistical result of the magnetospheric origin of energetic particles in the exterior cusp. Reconnection near the exterior cusp partly releases the particles in the closed field lines of the adjacent HLPS region into the exterior cusp.
Keywords. Magnetospheric physics (Energetic particles, trapped; Magnetopause, cusp and boundary layers) – Space plasma physics (Magnetic reconnection)
1 Introduction
Recent satellite missions, in particular Polar and Cluster, have demonstrated the existence of energetic particles in the exterior cusp region (Chen et al., 1998; Asikainen and Mur-sula, 2005). While previously it was thought that the high-latitude regions near the topological cusp in the dayside mag-netosphere could not stably trap particles (Roederer, 1970) it was later discovered that the magnetic field geometry around the cusp can trap energetic particles (Sheldon et al., 1998). The energetic particles in the exterior cusp have been studied by a number of authors. Chen et al. (1998) and Fritz (2001) showed that energetic particles indeed appear in the
diamag-Correspondence to: T. Asikainen
netic cavity of the exterior cusp where the magnetic field is extremely variable and the field strength is greatly depleted due to the high density plasma. Chen et al. (1998) found that the power of magnetic fluctuations correlated with the flux of energetic particles, and proposed that the magnetic fluctu-ations accelerate a portion of thermal magnetosheath plasma to high energies in the cusp diamagnetic cavity.
We have recently presented a different mechanism to ex-plain the existence of energetic particles in the exterior cusp (Asikainen and Mursula, 2005). We performed a statistical analysis of energetic particle fluxes in the exterior cusp and the adjacent high-latitude dayside plasmasheet (HLPS) ob-served by Cluster satellites. Comparing particle fluxes in the two regions with geomagnetic activity and solar wind/IMF parameters we concluded that the majority of energetic parti-cles in both of these two regions originate in the Earth’s mag-netotail where they are accelerated by substorm processes. Energetic particles, especially electrons above 20 keV (all RAPID electrons) and protons above some 100 keV are transported from the HLPS to the exterior cusp mainly by direct diffusion. We also found evidence suggesting that reconnection is a key factor in transporting protons below 100 keV to the exterior cusp by controlling their release from the closed field lines.
In this paper we present a detailed case study of an exterior cusp pass by Cluster satellites. We will show that reconnec-tion can release significant amounts of trapped energetic par-ticles from the HLPS to the exterior cusp. The paper is organ-ised as follows. In Sect. 2 we briefly review the instrumen-tation used. Section 3 contains an overview of the studied cusp pass. Section 4 presents detailed observations of recon-nection at the exterior cusp and simultaneous enhancements of energetic particle fluxes. Observations are discussed in Sect. 5 and conclusions given in Sect. 6.
2 Instrumentation
In this work we use energetic particle data from the RAPID (Research with Adaptive Particle Imaging Detectors) in-struments on board the Cluster satellites (Wilken et al., 1997). The IES sensor of RAPID measures electrons in
1950 T. Asikainen and K. Mursula: Reconnection at the exterior cusp 20 21 22 23 00 01 02 03 04 05 06 0 50 100 150 200 B [nT] 20 21 22 23 00 01 02 03 04 05 06 10−4 10−2 100 102 n p [1/cm 3 ] 20 21 22 23 00 01 02 03 04 05 06 0 2 4 6 8x 10 5 H + flux [1/s sr cm 2 ] 20 21 22 23 00 01 02 03 04 05 06 0 1000 2000 3000 4000 e − flux [1/s sr cm 2 ] Time [UT]
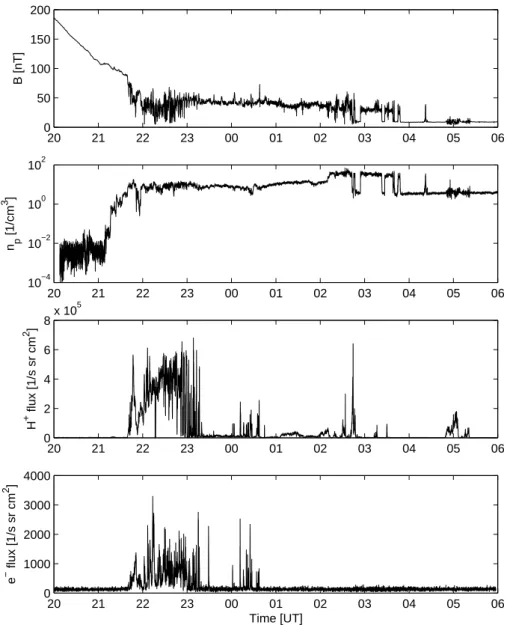
Fig. 1. Overview of Cluster 4 data on 2–3 February 2003. Panels from top to bottom depict the magnetic field intensity, plasma proton
density, and the total fluxes of energetic protons and electrons measured by the RAPID instrument.
the energy range 20–400 keV and the IIMS sensor protons, helium ions and heavier ions in the CNO (carbon, nitro-gen, oxygen) group. The energy range for protons and he-lium ions is 40 keV–4000 keV and for the heavier ions from 10 keV/nucleon to 1500 keV. Both sensors can measure the three-dimensional angular distribution of particles during the 4-s satellite rotation period. The azimuthal (spin) plane is divided into 16 sectors yielding an azimuthal resolution of 22.5◦. The polar resolution is 20◦for electrons and 15◦for ions. Moreover, we use magnetic field data of the FGM (Flux Gate Magnetometer) instrument (Balogh et al., 1997) and plasma density data of CIS instrument (R`eme et al., 1997) at 4-s resolution.
3 Overview
In this paper we study the pass of Cluster satellites through the exterior cusp on 2–3 February 2003. During this time the configuration of the four satellites was such that C4 was lead-ing (largest X) and C3 traillead-ing (smallest X), lagglead-ing about 30 min. C1 and C2 were quite close to C4. Figure 1 shows an overview of Cluster 4 magnetic field, plasma density and energetic protons and energetic electrons from 20:00 UT to 06:00 UT. At the beginning of the time interval C4 was travelling from the tail lobe/HLBL region towards the day-side inday-side the magnetopause, as verified by the stable mag-netic field and low plasma density. At about 21:45 UT the magnetic field strength dropped rapidly and the field be-came highly variable. By that time the plasma density had
22:500 22:55 23:00 23:05 23:10 23:15 23:20 23:25 23:30 10 20 30 B [nT] 22:50 22:55 23:00 23:05 23:10 23:15 23:20 23:25 23:30 −40 −20 0 20 40 BN [nT] 22:50 22:55 23:00 23:05 23:10 23:15 23:20 23:25 23:30 −30 −20 −10 0 BL [nT] 22:50 22:55 23:00 23:05 23:10 23:15 23:20 23:25 23:30 −20 −10 0 10 20 BM [nT] 22:500 22:55 23:00 23:05 23:10 23:15 23:20 23:25 23:30 2 4 6 8x 10 5 H + flux [1/s sr cm 2] 22:500 22:55 23:00 23:05 23:10 23:15 23:20 23:25 23:30 1000 2000 3000 e − flux [1/s sr cm 2] Time [UT]
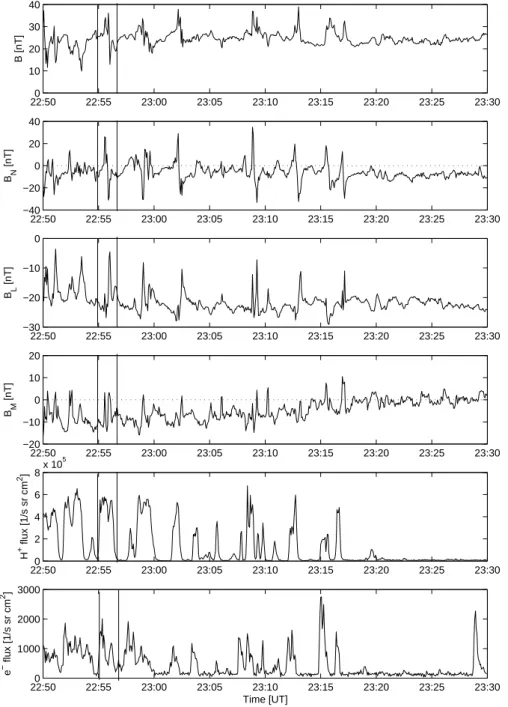
Fig. 2. Expanded view of Cluster 4 data in 22:50–23:30 UT. Panels from top to bottom depict the magnetic field intensity, the BN, BL,
BM components (in boundary normal coordinate system where n=(0.352, 0.379, 0.856) in GSE system), and the total fluxes of energetic
protons and electrons. The two vertical lines denote the time interval of the angular distribution in Fig. 4.
increased close to the magnetosheath level. Based on these signatures we can say that the satellite entered the exterior cusp at 21:45 UT. After about 23:20 UT the magnetic field fluctuations decreased and the field strength became more stable, indicating that C4 had finally exited the exterior cusp and entered the magnetosheath by this time. Note that dur-ing its stay within the exterior cusp, C4 detected the largest flux of energetic particles (both ions and electrons). (C3, not shown, visited the exterior cusp from about 22:10 UT
to 23:30 UT). Later, C4, after numerous crossings through the bow shock since 02:45 UT, finally entered the solar wind at about 03:45 UT .
4 Detailed observations
The most interesting period in C4 data for this study is the time interval from about 22:50 UT to 23:30 UT, i.e., the
1952 T. Asikainen and K. Mursula: Reconnection at the exterior cusp 22:00 22:30 23:00 23:30 00:00 60 80 100 120 140
ACE clock angle [deg]
22:00 22:30 23:00 23:30 00:00 −200 −100 0 100 200
C3 clock angle [deg]
22:00 22:30 23:00 23:30 00:00 −200 −100 0 100 200 Time [UT]
C4 clock angle [deg]
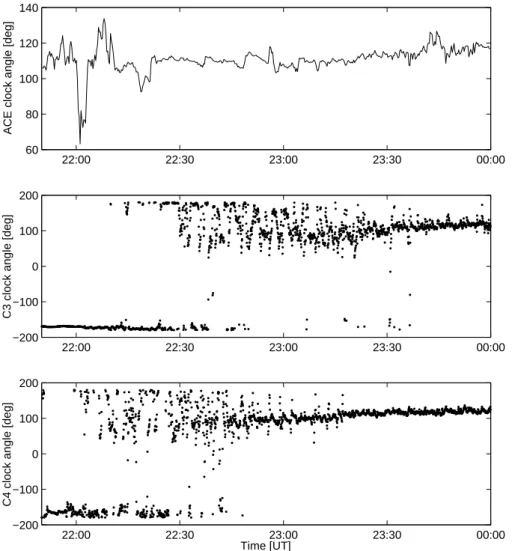
Fig. 3. Clock angles of ACE (delayed by 50 min), C3 and C4 satellites.
latter part of C4 cusp visit and the transition from cusp to magnetosheath (magnetopause crossing). Figure 2 shows an expanded view of C4 magnetic field and energetic particle data for this interval. The magnetic field is expressed in the boundary normal coordinate system. The unit vectors are de-fined so that vector m=n×zGSM and l=m×n. The normal
vector n=(0.352, 0.379, 0.856) (GSE) was estimated by as-suming a planar boundary and using boundary crossing times and corresponding positions of the four satellites. The in-dividual boundary crossing times were identified from the energetic ion measurements of the four satellites (see also Mursula et al., 2005). Minimum variance analysis of the magnetic field did not yield a good result for the boundary normal in this case due to the very noisy field on both sides of the boundary. In Fig. 2 one can clearly see a number of bipolar signatures in the normal component of magnetic field from 22:55 UT to 23:17 UT. These signatures seem to occur quasiperiodically with a period of about 3–4 min. It has been known for quite some time that the flux transfer events (FTE)
associated with temporally variable reconnection at the day-side magnetopause give rise to such bipolar signatures in the magnetic field, especially in the component along the local magnetopause normal (Russell and Elphic, 1978).
The IMF observed by ACE spacecraft (located at L1 point with an average delay time of about 50 min) during the in-terval from 22:50 UT to 23:30 UT was rather steady with an average of (6, 10, –3) nT in GSM coordinates, yielding an av-erage clock angle (the angle between the projection of IMF vector to GSM YZ plane and GSM Z axis) of about 107◦
(see Fig. 3). At the same time interval the local magnetic field observed by C4 was on average about (16, 39, –9) nT in GSM coordinates, which is rather close to the direction of the IMF field lines, taking into account that they are shocked in the bow shock and draped over the magnetopause. This verifies that C4 was outside the magnetopause on shocked IMF field lines at this time. Had it been inside the mag-netosphere on closed field lines, the Y (and X) component should be negative. The local magnetic field clock angle of
50 100 150 200 250 300 350 −80 −60 −40 −20 0 20 40 60 80 Azimuth [deg] Polar [deg] 10 30 30 30 50 50 50 70 70 70 70 70 90 90 90 90 90 110 110 110 110 110 130 130 130 150 150 150 170 log(flux) [1/cm 2 sr s] 10 10.5 11 11.5 12 12.5 13 13.5
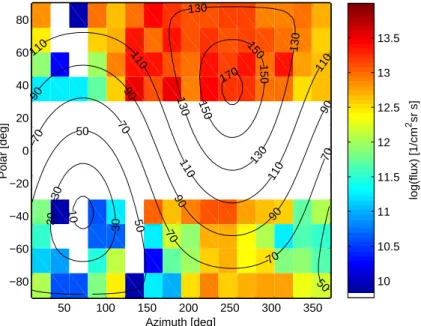
Fig. 4. Angular distribution of protons in GSE coordinates in 22:55:21–22:57:29 UT (the burst noted in Fig. 2). The angles represent the
flow direction of the particles. The maximum fluxes are observed coming from duskward of the Sun-Earth line, while very low fluxes are observed coming from the opposite direction. The empty area between polar angles from –30◦to 30◦is due to the corrupted central sensor heads of the RAPID IIMS instrument. Pitch angle contours corresponding to average magnetic field BGSE=(9.7, 31, –25) nT observed by
C4 are also shown.
C3 satellite shows variations between IMF directed field and nearly southward directed field (±180◦ clock angle) which is more typical to the exterior cusp. This implies that dur-ing the time interval C3 was very close to the boundary be-tween exterior cusp and magnetosheath and even crossed the boundary a number of times. During this IMF orientation the antiparallel reconnection occurs somewhat equatorward and duskward of the cusp funnel, close to the so called top of the field line position. The position of C4 was about (4.5, 2, 9.3) RE (in GSM), i.e., close to the position of expected
antiparallel reconnection site. On the basis of the bipolar sig-natures in the magnetic field and the position of the satellite relative to the expected reconnection site it is clear that the signatures are FTEs caused by transient reconnection at the dayside. The (+/–) polarity of the BN signatures indicates
that the FTE pulses are moving away from the reconnection site (which is equatorward of the satellite position) towards the exterior cusp.
Associated with the FTE signatures the RAPID instru-ment detects strong bursts of energetic ions and electrons (see Fig. 2). (A similar relation between the FTE signatures and energetic particles was presented by Daly et al. (1981)). The flux levels are closely similar to those observed dur-ing the previous hour when the satellite was in the exterior cusp (see Fig. 1). Figure 4 shows the angular distribution of energetic protons observed during the FTE-related burst at 22:55–22:57 UT (see Fig. 2). The angular distribution shows the proton flux in the azimuth angle-polar angle plane, the angles depicting the flow direction of the particles. Azimuth
angle 0◦points to the Sun and increases towards dusk while the polar angle of 90◦points to the direction of GSE-Z axis. The distribution shows that the maximum fluxes are observed around the direction 250◦of azimuth angle and at about 50◦
of polar angle, while very low fluxes are observed in the op-posite direction. Due to the corrupted central detector heads of the RAPID IIMS instrument we lack data from the four polar bins around the spin plane (polar angles from -30◦ to 30◦). Despite of this permanent data gap the underlying pat-tern in the angular distribution is clear. Taking into account the fact that the average magnetic field observed by C4 is
BGSE=(9.7, 31, –25) nT during 22:55:21–22:57:29 UT, i.e.,
about 72◦ from the X axis towards the evening sector and about 39◦downwards from the XY-GSE plane, the angular distribution depicts a broad ion beam flowing roughly an-tiparallel to the local magnetic field. Figure 4 also shows overlaid pitch angle contours, which have been calculated in GSE coordinate system using the above mentioned aver-age C4 magnetic field. The pitch angle contours show even more clearly that the distribution depicts an antiparallel ion beam. Similar distributions were observed during nearly all FTE signatures. Note that during this time the C4 was in the magnetosheath as indicated by the direction of the magnetic field. Taking into account the direction of the local magnetic field the flow direction of the protons implies that they are coming from the expected reconnection site (magnetopause close to the dusk edge of the cusp funnel) along the field lines and going towards the exterior cusp.
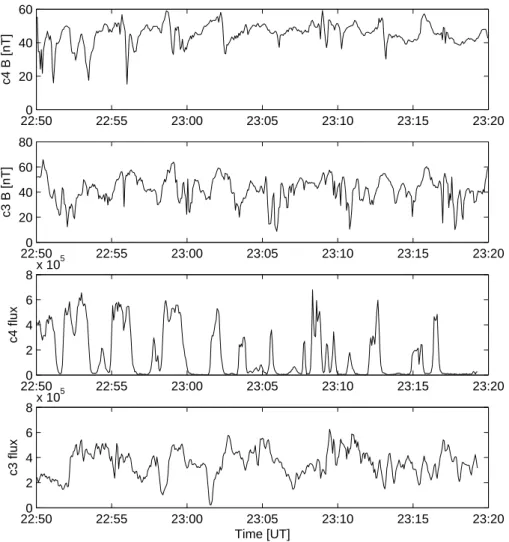
1954 T. Asikainen and K. Mursula: Reconnection at the exterior cusp 22:500 22:55 23:00 23:05 23:10 23:15 23:20 20 40 60 c4 B [nT] 22:500 22:55 23:00 23:05 23:10 23:15 23:20 20 40 60 80 c3 B [nT] 22:500 22:55 23:00 23:05 23:10 23:15 23:20 2 4 6 8x 10 5 c4 flux 22:500 22:55 23:00 23:05 23:10 23:15 23:20 2 4 6 8x 10 5 Time [UT] c3 flux
Fig. 5. The magnetic field intensities and the total proton fluxes (in units of 1/cm2sr s) measured by the Cluster 4 (first and third panel) and
Cluster 3 (second and fourth panel) satellites.
X Z ^n
closed field lines exterior cusp magnetop ause Y Z ^n
closed field lines exterior cusp
reconnection site
Fig. 6. Schematic diagram of Cluster 3 and 4 satellites and their orbits in the dayside magnetospheric environment. The diagram also shows
the estimated boundary normal vector, IMF field lines and the antiparallel reconnection site. The red arrow shows the streaming direction of energetic particles released from the closed field lines in the reconnection.
As discussed above, Cluster 4 observations just outside the exterior cusp showed bursts of highly enhanced field-aligned fluxes of energetic particles closely associated with FTE sig-natures in the magnetic field. The observed antiparallel pitch-angle distribution indicates that the particles flow from the reconnection site towards the exterior cusp along the field lines. A schematic diagram of the Cluster 3 and 4 orbits and magnetospheric regions is shown in Fig. 6. The C3 satellite was still deeper in the exterior cusp, close to the boundary be-tween magnetosheath and exterior cusp all the time in 22:50– 23:20 UT when C4 observes the FTEs outside the cusp. This is verified, e.g., by the clock angle measurements (Fig. 3) discussed above and lower C3 magnetic field intensity (see Fig. 5) which also depicts dramatic dropouts, typical for the exterior cusp, during all this interval. Figure 5 also shows the energy integrated proton fluxes from the two satellites during this time interval. The third panel shows the FTE related pro-ton flux enhancements observed by C4 and the bottom panel shows the proton fluxes related to the exterior cusp observed by C3. One can see that, on top of a rather high background flux level, C3 sees enhancements with some time delay com-pared to the enhancements observed by C4.
This is even more clearly demonstrated in Fig. 7 where the correlation coefficient between C3 and C4 proton fluxes is shown as a function of the lag between the signals. The first two correlation maxima are found at 40 s and 3.5 min time lags. The 40 s lag maximum corresponds to the aver-age delay between the bursts at C4 and C3. The 3.5 min lag maximum gives the average burst repetition period. The en-hancements observed by C3 are not as well structured as the ones seen by C4, but this is understandable because C3 is still observing energetic particles associated to the very dynamic exterior cusp with a large average flux levels. The correlation between the fluxes is not perfect or even expected since the particles come to the cusp from many reconnected flux tubes that each give a different contribution to the total flux in the cusp. The significance of the correlation coefficient is above 99% at the cross correlation maxima (the corresponding P-value, i.e., the probability of zero correlation is below 1%). Thus, even though the correlation between C3 and C4 fluxes is small the significance is rather high. The comparison be-tween the two satellites (in addition to the C4 observations) thus strongly suggests that at least part of the energetic parti-cles flowing from the reconnection site can reach the exterior cusp.
Asikainen and Mursula (2005) suggested that the energetic protons in the exterior cusp come from the closed field lines of the high-latitude dayside plasma sheet (HLPS), i.e., the region of closed field lines just below the cusp region. As shown there, the energetic particle fluxes are always nearly an order of magnitude larger in HLPS than in the adjacent ex-terior cusp. The low-energy (30–100 keV) protons that dom-inate the total proton fluxes of the RAPID instrument were
0 50 100 150 200 250 300 350 400 450 −0.3 −0.25 −0.2 −0.15 −0.1 −0.05 0 0.05 0.1 Lag [sec] corr. coeff.
Fig. 7. The correlation coefficient between C3 and C4 proton fluxes
as a function of the lag between the signals. The time interval is the same as in Fig. 5, i.e., 22:50 to 23:30 UT. Positive lags correspond to shifting of C4 signal forward in time.
found to depend on the IMF direction, indicating that recon-nection might control the access of these particles into the exterior cusp. The observations presented here support this idea showing that energetic particles flow away from the re-connection site and that a part of them arrives in the exterior cusp. In order to rule out the possibility that the particles are energized by reconnection to the observed energies we have estimated the energy per particle obtained in the recon-nection process. The observed local plasma density at the satellite is about 10 cm−3and the local magnetic field inten-sity about 40 nT in the magnetosheath whence the maximum bulk energy gain per particle in reconnection is about 400 eV assuming that all magnetic field energy is converted to ther-mal energy of the plasma. This is of course just an order of magnitude estimate since we do not know the exact plasma density and magnetic field in the reconnection region. How-ever, on the basis of these values it is clear that the particles cannot be energized to tens or hundreds of keVs in the re-connection process by bulk acceleration. Instead, the recon-nection process releases part of the pre-existing population of energetic particles from the adjacent closed field lines of the HLPS region.
6 Conclusions
We have presented here a case study of flux transfer events observed at the edge of the exterior cusp region by Cluster satellites. Bursts of high fluxes of energetic particles were observed by Cluster 4 in close conjuction with the magnetic field FTE signatures. The pitch angle distribution of the ener-getic particles showed that the enhancements consist of par-ticles flowing antiparallel to the field lines away from the ex-pected reconnection site towards the exterior cusp. At the same time Cluster 3 observed enhancements of energetic par-ticles inside the exterior cusp with a delay of about 40 s to the Cluster 4 enhancements. The estimated maximum energy
1956 T. Asikainen and K. Mursula: Reconnection at the exterior cusp gain per particle by reconnection remains below 1 keV, thus
clearly below the tens to hundreds of keV energy range ob-served by the RAPID instrument. These observations sup-port the earlier statistical results of the magnetospheric ori-gin of energetic particles in the exterior cusp. Reconnection near the exterior cusp partly releases the protons in the closed field lines of the adjacent HLPS region into the exterior cusp.
Acknowledgements. This work was partly funded by the Academy
of Finland. We wish to thank P. Daly for useful discussions and for providing the calibrated RAPID data. We also thank the PIs of the Cluster FGM and CIS instruments, E. Lucek and H. R`eme for providing the data.
Topical Editor I. A. Daglis thanks P. Daly and G. Paschmann for their help in evaluating this paper.
References
Asikainen, T. and Mursula, K.: Energetic particle fluxes in the exte-rior cusp and the high-latitude dayside magnetosphere: Statisti-cal results from the Cluster/RAPID instrument, Ann. Geophys., 23, 2217–2230, 2005.
Balogh, A., Dunlop, M. W., Cowley, S. W. H., Southwood, D. J., et al.: The Cluster Magnetic Field Investigation, Space Sci. Rev., 79, 65–91, 1997.
Chen, J., Fritz, T. A., Sheldon, R. B., et al.: Cusp energetic par-ticle events: Implications for a major acceleration region of the magnetosphere, J. Geophys. Res., 103, 69–78, 1998.
Daly, P., Williams, D., Russell, C., and Keppler, E.: Particle Signa-ture of Magnetic Flux Transfer Events at the Magnetopause, J. Geophys. Res., 86, 1628–1632, 1981.
Fritz, T. A.: The Cusp as a source of magnetospheric energetic par-ticles, currents, and electric fields: A New Paradigm, Space Sci. Rev., 95, 469–488, 2001.
Mursula, K., Kerttula, R., Asikainen, T., Friedel, R., Vaivads, A., Soeraas, F., Grande, M., Daly, P. W., Fritz, T. A., Fennell, J. F., and Balogh, A.: CLUSTER/RAPID energetic electron observa-tions at the dayside magnetospheric boundary, Adv. Space. Res., 36, 1904–1908, 2005.
R`eme, H., Bosqued, J. M., Sauvaud, J. A., et al.: The Cluster Ion Spectrometry (CIS) Experiment, Space Sci. Rev., 79, 303–350, 1997.
Roederer, J. G.: Dynamics of geomagnetically trapped radiation, Springer-Verlag Berlin Heidelberg New York, 66, 1970. Russell, C. T. and Elphic, R. C.: Initial ISEE magnetometer results:
magnetopause observations, Space Sci. Rev., 22, 681–715, 1978. Sheldon, R. B., Spence, H. E., Sullivan, J. D., Fritz, T. A., and Chen, J.: The discovery of trapped energetic electrons in the outer cusp, Geophys. Res. Lett., 25, 1825–1828, 1998.
Wilken, B., Axford, W. I., Daglis, I., Daly, P., et al.: RAPID: The Imaging Energetic Particle Spectrometer on Cluster, Space Sci. Rev., 79, 399–473, 1997.