HAL Id: hal-00317660
https://hal.archives-ouvertes.fr/hal-00317660
Submitted on 23 Sep 2004
HAL is a multi-disciplinary open access
archive for the deposit and dissemination of
sci-entific research documents, whether they are
pub-lished or not. The documents may come from
teaching and research institutions in France or
abroad, or from public or private research centers.
L’archive ouverte pluridisciplinaire HAL, est
destinée au dépôt et à la diffusion de documents
scientifiques de niveau recherche, publiés ou non,
émanant des établissements d’enseignement et de
recherche français ou étrangers, des laboratoires
publics ou privés.
Nightglow vibrational distributions in the A3?u+ and
A’3?u states of O2 derived from astronomical sky
spectra
T. G. Slanger, P. C. Cosby, D. L. Huestis, A. M. Widhalm
To cite this version:
T. G. Slanger, P. C. Cosby, D. L. Huestis, A. M. Widhalm. Nightglow vibrational distributions in
the A3?u+ and A’3?u states of O2 derived from astronomical sky spectra. Annales Geophysicae,
European Geosciences Union, 2004, 22 (9), pp.3305-3314. �hal-00317660�
Annales Geophysicae (2004) 22: 3305–3314 SRef-ID: 1432-0576/ag/2004-22-3305 © European Geosciences Union 2004
Annales
Geophysicae
Dedicated to the memory of Joseph W. Chamberlain, 1928–2004
Nightglow vibrational distributions in the A
3
6
u
+
and A
0
3
1
u
states of
O
2
derived from astronomical sky spectra
T. G. Slanger1, P. C. Cosby1, D. L. Huestis1, and A. M. Widhalm2
1Molecular Physics Laboratory, SRI International, 333 Ravenswood Avenue, Menlo Park CA 94025, USA 2Department of Physics and Astronomy, University of Southern California, Los Angeles, CA 90089, USA
Received: 25 September 2003 – Revised: 8 April 2004 – Accepted: 14 April 2004 – Published: 23 September 2004 Part of Special Issue “Equatorial and low latitude aeronomy”
Abstract. Astronomical sky spectra from the Keck I
tele-scope on Mauna Kea have been used to obtain vibra-tional distributions in the O2(A36u+) and O2(A031u) states
from rotationally-resolved Herzberg I and Chamberlain band emissions in the terrestrial nightglow. The A36u+ distribu-tion is similar to that presented in earlier publicadistribu-tions, with the exception that there is significant population in the pre-viously undiscerned v=0 level. The vibrational distributions of the A031uand A36u+states are essentially the same when
comparison is made in terms of the level energies. The in-tensity of Chamberlain band emission at the peak of the dis-tribution is about one-fourth that of the Herzberg I emission, as previously shown, and may be related primarily to radia-tive efficiency. The peaks in both population distributions are about 0.25 eV below the O(3P)+O(3P) dissociation limit. We compare these Herzberg state distributions with that of the O2(b16g+) state, concurring with others that the intense
nightglow emission associated with b16g+(v=0) is a reflec-tion of direct transfer from the Herzberg states. This process takes place following O2 collisions, with simultaneous
pro-duction of very high a11gand b16g+vibrational levels.
Key words. Atmospheric composition and structure
(air-glow and aurora; thermosphere composition and structure) – Electromagnetics (miscellaneous)
1 Introduction
The molecular band systems that make up the terrestrial nightglow in the 250–1300 nm spectral region are all, with the exclusion of the OH Meinel bands, products of O-atom recombination. There are five electronically excited states of O2that can emit in this region, and each of them is repre-Correspondence to: T. G. Slanger
(tom.slanger@sri.com)
sented by at least one emitting system (Broadfoot and Bel-laire, 1999; Chamberlain, 1955; McDade et al., 1986, 1987; Slanger and Copeland, 2003; Slanger and Huestis, 1981). Ta-ble 1 lists these transitions, all of which are optically forbid-den by one or another selection rule. Because radiative life-times are long, collisional deactivation is an important pro-cess, and the observed emission intensities reflect not only the production rates but also the loss rates. It is interesting to note that there are only three possible transitions between the upper (A, A0, c)and lower (X, a, b) states that are not included in the list – A–a, A–b, and A0–b. The strengths of these transitions are calculated to be non-negligible, (Saxon and Slanger, 1986) and identification could ultimately come from sky spectra. Transitions between Herzberg states, i.e.
A–A0, A–c, and A0–c are not considered here, as any emis-sion would be well into the infrared and weak.
Atomic recombination starts with the atoms having a po-tential energy 5.12 eV above the v=0 level of the O2ground
state. This energy is equivalent to a wavelength of 242 nm, and thus O2emission originating with O(3P) recombination
lies at longer wavelengths than this limit. As collisions re-move energy, the populations spread out among the various electronic states, and the vibrational distributions reflect the overall dynamics of the interactions.
It is therefore desirable to obtain these distributions as ac-curately as possible. In particular, there has been consider-able work carried out in recent years on determining the loss rate coefficients of the various O2electronic states as a
func-tion of vibrafunc-tional level (Copeland et al., 1996; Hwang et al., 1998; Kalogerakis et al., 1999, 2002; Knutsen et al., 1994; Slanger and Copeland, 2003). When combined with the at-mospheric vibrational distributions, it will ultimately be pos-sible to characterize the production rates of O2vibronic
lev-els, leading to a detailed picture of recombination dynamics. Of the transitions listed in Table 1, the three for which upper state vibrational distributions have been published are
3306 T. G. Slanger et al.: Nightglow vibrational distributions in the A36+u and A031ustates of O2
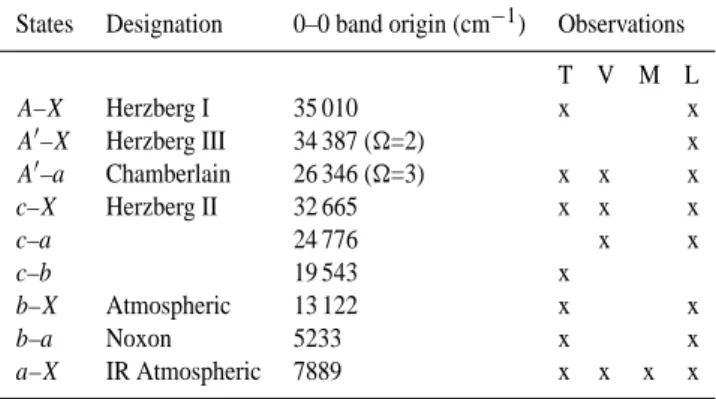
Table 1. Known O2transitions for states below 5.1 eV.
States Designation 0–0 band origin (cm−1) Observations T V M L A–X Herzberg I 35 010 x x A0–X Herzberg III 34 387 (=2) x A0–a Chamberlain 26 346 (=3) x x x c–X Herzberg II 32 665 x x x c–a 24 776 x x c–b 19 543 x b–X Atmospheric 13 122 x x b–a Noxon 5233 x x a–X IR Atmospheric 7889 x x x x T terrestrial V Venus M Mars L laboratory
the Herzberg I and Chamberlain transitions (Slanger and Huestis, 1981; Eastes et al., 1992; Stegman and Murtagh, 1991), and the Atmospheric band system (Slanger et al., 2000a). The Herzberg I system is found to have a peak near v=6, falling sharply to higher v and more gradually to lower v. The highest vibrational level supported by the potential is v=12, of which a few rotational levels have been detected (Huestis et al., 1994; Jenouvrier et al., 1999; Slanger et al., 1996). For the Chamberlain band system there has been only one set of measurements indicating a peak in the distribu-tion near v=7, although no levels below v=5 were reported (Stegman and Murtagh, 1988, 1991). For the Atmospheric band system, there is now known to be a broad and tri-modal distribution, with peaks at v=0, 3/4, and 12 (Slanger et al., 2000a).
A new source of nightglow emission data has recently be-come available – the astronomical sky spectra from large telescopes (Slanger and Copeland, 2003b; Slanger et al., 1997, 2000a, 2000b, 2003a, 2003b). Those from the Keck I telescope on which we report are obtained at a resolution of ∼40 000, and simultaneously cover an extended spectral region. The present work utilizes sky spectra obtained in Oc-tober and November 1999, with the HIRES (HIgh Resolution Echelle Spectrograph) system on the Keck I telescope, over the 340–500 nm region. This range enables us to obtain dis-tributions for both the A36u+and A031uelectronic states, in
the Herzberg I and Chamberlain transitions. The Herzberg II transition is discernible in the new spectra but quite weak, and is not included in the analysis. An A–X:c–X system intensity ratio of 4:1 was originally reported from ground-based data (Slanger and Huestis, 1981), but in subsequent analysis of ATLAS/ISO ultraviolet data (Owens et al., 1993; Santoro et al., 1994), where the strongest c–X bands are ac-cessible, the A–X:c–X ratio was estimated to be (10–15):1.
2 Results and discussion
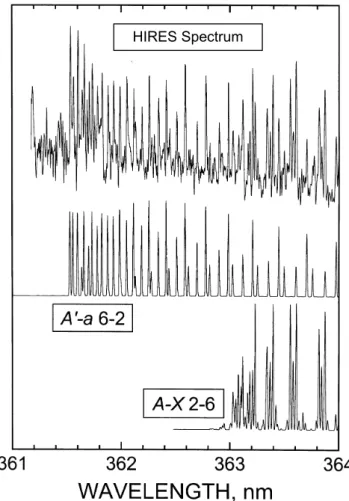
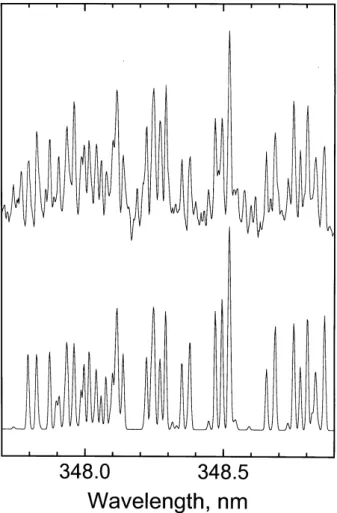
Figure 1 shows an example of the quality of the night-glow spectra obtained from Keck I/HIRES, showing both the Herzberg I 2–6 band and the Chamberlain 6–2 band. As the bands are interleaved, it is essential that we be able to carry out accurate simulations of the line positions and the rotational distribution in a band. The DIATOM program (Huestis, 1994) calculates diatomic band simulations at ified linewidths and temperatures, but requires accurate spec-troscopic information, in accordance with the quality of the spectrum being matched. The HIRES spectral resolution in these studies is on the order of 0.01 nm, and thus we need to be able to calculate line positions an order of magnitude more precisely, or 0.001 nm.
We have used the same set of data to improve spectro-scopic knowledge of the lower levels of the two transitions under study – the O2ground state and the O2(a11g) state.
Previously, information on vibrationally-excited ground state levels has come from observation of the O2
Schumann-Runge bands in emission, and it has long been realized that intermediate levels, at v=5–8, are not accurately known (Huestis, 1999). For the O2(a11g) levels, there has been
only one set of measurements for levels above v=1, and only for a limited range of rotational levels (Nieh and Valentini, 1987). The upper states of the Herzberg I and Chamberlain transitions, A36u+ and A031u, are accurately known from
absorption measurements (Borrell et al., 1986; Coquart and Ramsay, 1986; Jenouvrier et al., 1999; Kerr and Watson, 1986), although even in this case the Keck data provide new information on the A031u(=3) component, the upper level
of the Chamberlain bands.
We have measured 1280 lines in the Chamberlain bands and a similar number in the Herzberg I bands. It has been demonstrated that the wavelengths are very accurately cal-ibrated by the astronomers with thorium/argon and other lamps, and we are able to check certain dayglow UV lines appearing in the spectra, cf. He (388.9 nm) and Ca+(393.4,
396.8 nm), observing that their positions agree with NIST data. As a result, we have precise level positions for
X36−g(v=4–14) and a11g(v=1–10) levels, and our previous
work on the b–X Atmospheric band system (Slanger, 2000a) provides similar data on X36g−(v=0–12). Therefore, we are in a position to carry out accurate simulations of the Herzberg I and Chamberlain bands in the Keck spectra.
HIRES is an echelle spectrometer, and the spectra appear in individual orders of the grating, 5–7 nm being covered in a near-UV spectrum. There is generally some overlapping of the orders, which is often not true in the visible and particu-larly the near-infrared. Observers typically take spectra over a 50-min period, which is adequate to measure star spectra, but not sufficient to measure the weak O2features of the UV
nightglow. Stegman and Murtagh (1988) have made abso-lute UV band intensity measurements, and find Herzberg I intensities ranging from 0.5–7 Rayleighs (R), and Chamber-lain intensities of 2–5 R. Individual rotational line intensities are then on the order of 100 mR or less. We therefore co-add
T. G. Slanger et al.: Nightglow vibrational distributions in the A36+u and A031ustates of O2 3307
spectra; for this study 10–20 spectra were used. We do not limit ourselves to spectra of a single night, and make the im-plicit assumption that the vibrational and rotational distribu-tions within each O2electronic state are invariant.
As yet, we do not have a reliable intensity distribution function over the entire wavelength region investigated. For this reason, the data are analyzed order by order. The require-ment is to have two or more bands of either the Herzberg I or Chamberlain system for comparison. For example, in order 101 are found the 3-6 and 5-7 Herzberg I bands, and from their relative intensity we can derive the relative popu-lations in the A36u+(v=3, 5) levels, given knowledge of the Franck-Condon factors (FCF). In addition, where Herzberg I and Chamberlain bands appear together, as in the spectrum shown in Fig. 1, we can determine the relative intensities of the two systems. In both O2systems, the spacing between
vibrational levels in the upper states are approximately half that for the lower state levels. Thus, the bands fall in se-quences given by v0−v00, (v0+2)–(v00+1), (v0+4)–(v00+2), etc. To the extent allowed by the Franck-Condon factors, we can often find several bands in an order.
The band intensity is proportional to the expression
Iv0,v00 =Nv0qv0,v00 × ν3
v0.v00 × Re(rv0.v00)2, (1) where ν is the transition frequency of the band, and Re is
the electronic transition moment, which depends on the in-ternuclear spacing, rv0,v00. We are seeking the fraction of the emission out of a given v0represented by a single band. For a sequence of bands as described, there is very little change in the internuclear spacing. For example, for the Chamberlain bands in the sequence beginning with 0–7 and ending with 10-12, the difference in the extreme values of rv0.v00 is less than 3%, so that under such circumstance Recan be taken as
constant. In any case, the present indication is that transition moments for the Herzberg I system are approximately con-stant over a relatively large range of internuclear distances (Fateev et al., 1996; Huestis et al., 1994; Merienne et al., 2000; Yoshino et al., 1995). For comparisons within a given order the frequency is also approximately constant, and thus the population ratio between two Herzberg I or Chamberlain bands can be approximated using only Franck-Condon fac-tors and measured intensities. For example, the Herzberg I 0–7 and 6–10 bands are separated by only 0.27 nm, and we can write their population ratio as
Nv=0/Nv=6=(I0−7/I6−10) × (q6−10/q0−7). (2)
The Franck-Condon factor ratio, calculated from the poten-tials, is 0.414, while the intensity ratio is found to be 0.51, giving a population ratio of 0.21. Although there is no simi-lar information on the Chamberlain band transition moments, we presume the same arguments hold.
The sequences of bands in an order have the characteris-tic that there will either be only odd or even emitting levels represented. Thus, the heads of the 3–6 and 5–7 Herzberg I bands are at 354.0 and 355.3 nm, respectively. However, the 4–6 and 4–7 bands are at 345.7 and 363.5 nm, so that one
24 Figure 1. Keck I/HIRES co-added spectrum of the 361-364 nm region (top). The lower two panels are DIATOM simulations of the A'3∆
u - a1∆g 6-2 band and the A3Σ+u - X3Σg - 2-6 band.
HIRES Spectrum
Fig. 1. Keck I/HIRES co-added spectrum of the 361–364 nm re-gion (top). The lower two panels are DIATOM simulations of the
A031u–a11g6–2 band and the A36u+–X36g−2–6 band.
cannot simultaneously measure A36u+(v=3, 4, 5) in a single order. We thus adopt the strategy of generating an odd-v and an even-v sequence, then normalizing them so as to give a smooth final distribution. At the shortest wavelengths there are single orders involving both odd and even levels, which is reflected in the plots for the highest vibrational levels. How-ever, there are too few band pairs involving these levels to use them directly in merging the odd and even data.
The data are analyzed by using a least-squares fitting pro-gram to construct the observed spectrum from the DIATOM simulations of the component bands in the two O2band
sys-tems. We include all bands with a reasonable intensity, based on the matrices calculated by Stegman for the two systems (Stegman, 1991). In the simulations the resolution, λ/1λ, is set at 40 000, and the temperature is held fixed at 195 K. The program output is an amplitude coefficient for each band, representing the total band area.
Table 2 presents multiple measured ratios for band pairs in the Herzberg I system. For each pair, the program output in-tensity is only divided by the Franck-Condon factor. For any pair of upper state levels the population ratio should be the same, regardless of the lower state levels. Thus, the variation
3308 T. G. Slanger et al.: Nightglow vibrational distributions in the A36+u and A031ustates of O2
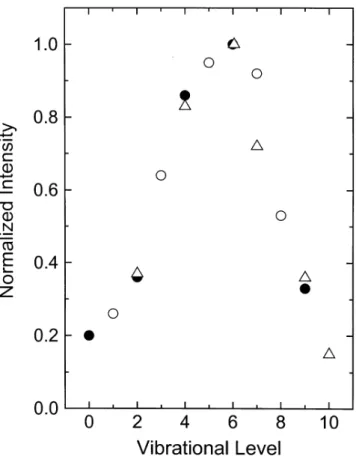
25 Figure 2. The A3Σ+
u vibrational distribution in the nightglow. Open circles - odd-v levels; solid
circles – even v-levels; open triangles – data of Stegman and Murtagh[1988]. Note that for the high-v levels there is some crossover between the odd and even levels (see text).
Fig. 2. The A36+u vibrational distribution in the nightglow. Open circles – odd-v levels; solid circles – even v-levels; open triangles – data of Stegman and Murtagh (1988). Note that for the high-v levels there is some crossover between the odd and even levels (see text).
Table 2. O2(A36+u) population ratios.
Level pairs Measured ratios 6/0 5.6, 4.7, 4.5 3/1 2.5, 2.4, 2.4 4/2 2.2, 2.4, 2.6 6/4 1.2, 1.2, 1.1 5/3 1.5, 1.4
in that ratio gives an impression of the error in the procedure. The table shows ratios obtained for band pairs with different lower state levels. For example, the band pairs used to obtain the v(3)/v(1) ratio are 3–5/1–4, 3–6/1–5, and 3–9/1–8. In this instance, the variation for the three examples is less than 5%. The sets of data are averaged and the vibrational distribu-tion for the A36u+state is given in Fig. 2, and shows both the odd-v and even-v sets. It is quite similar to the earli-est distribution, which was based on unpublished rotationally unresolved data of Broadfoot (Slanger and Huestis, 1981), to that presented by Stegman and Murtagh where the rotational lines were partially resolved (Stegman and Murtagh, 1991),
Table 3. O2(A031u, =3) population ratios.
Level pairs Measured ratios 4/2 7.1, 5.5 5/3 2.2, 3.9 6/4 1.8, 2.0 7/5 1.1, 1.3, 1.3 8/6 1.1, 1.0
and to that of the rotationally unresolved data of Eastes, from the S3/4 satellite (Eastes et al., 1992). The new dis-tribution appears to be smooth, without the discontinuity at v=5 (Stegman and Murtagh, 1991). Also shown in Fig. 2 is a partial distribution calculated from absolute intensities (Stegman and Murtagh, 1988) from six Herzberg I bands, normalized to v=6. Except for a discrepancy for v=7, agree-ment is remarkable. Such comparisons lead us to have confi-dence in the Chamberlain analysis.
In Table 3 we present a representative data set for Cham-berlain band pairs with multiple ratios determined. Here the spread is somewhat greater than for the Herzberg I data, the weaker bands often being weaker than their Herzberg I coun-terparts. Again, mathematical averages are used when there are multiple determinations.
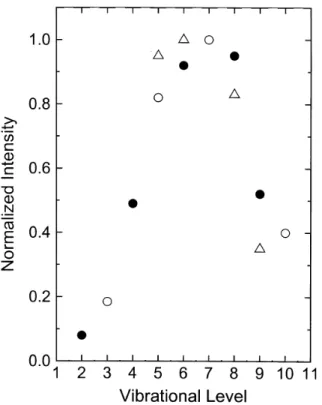
Figure 3 is a plot of the vibrational distribution in the
A031u(=3) sub-state, the source of the Chamberlain band
emission. As described, the odd and even vibrational level ra-tios are obtained separately, then combined to give a smooth distribution. Also shown on the plot are the absolute inten-sity data for four Chamberlain bands measured by Stegman and Murtagh (1988), where we take their intensities and di-vide them by the fraction of emission from the given v0 repre-sented by the band. The numbers are then normalized to their v=6 peak. The distributions are seen to be quite similar. The
A031u distribution is shifted from that of the A36u+ state,
and the argument has previously been made that such a shift should be expected, and that when plotted on an energy scale, the distributions ought to be similar (Slanger and Huestis, 1981). Lopez-Gonzalez et al. (1992) have modeled a distri-bution for the A031ustate which is similar to the present one,
but with deviations for both high and low vibrational levels. In Fig. 4 we plot the Herzberg I and Chamberlain distri-butions as a function of the energy of the levels, and the data show that they are essentially identical; only at the low-est vibrational levels is there significant divergence. As has been previously stated, it appears that the A36+u and A031u
states are collisionally coupled for the higher vibrational lev-els (Slanger and Copeland, 2003), which is now supported by the shape of these distributions. The peak in each case occurs approximately 2000 cm−1below the dissociation limit.
However, the production rate distribution of vibrationally excited levels is more sharply peaked than the population distributions indicate. This is because the collisional loss rates increase with vibrational level; over the A36+u(v=6–9)
T. G. Slanger et al.: Nightglow vibrational distributions in the A36+u and A031ustates of O2 3309
26 Figure 3. The A'3∆
u (Ω = 3) vibrational distribution in the nightglow. Open circles - odd-v
levels; solid circles – even v-levels; open triangles – data of Stegman and Murtagh[1988]. Note that for the high-v levels there is some crossover between the odd and even levels (see text).
Fig. 3. The A031u(=3) vibrational distribution in the nightglow.
Open circles – odd-v levels; solid circles – even v-levels; open trian-gles – data of Stegman and Murtagh (1988). Note that for the high-v levels there is some crossover between the odd and even levels (see text).
range the O2 rate coefficient almost doubles and that for
N2increases by a factor of 6 (Hwang and Copeland, 1997;
Copeland and Kalogerakis, 2000). Using the rate coefficients for v=6, 7, 9 and interpolation for v=8, along with an esti-mated emission altitude of 95 km, we calculate that the pro-duction distribution peaks sharply at v=7, 8, with propro-duction at v=6 being only half as large, and that at v=9 being 70% as large. The production of the lower levels presumably orig-inates with a relatively inefficient cascading process. These effects will be discussed in a subsequent publication. Such behavior is similar to the situation with OH nightglow emis-sion, where the H+O3 reaction generates OH (v=6–9), and
the more intense lower level emissions originate with the high levels, and are essentially amplified by decreasing col-lisional loss rates (Adler-Golden, 1997).
That the peak of the distribution for production of
A36u+(v) lies at v=7, 8 has at least two possible causes. Work on the55gstate of O2has shown that it is very important in
the recombination process (Amaral et al., 2001; Copeland et al., 2001). On the basis of its degeneracy and the shape of its potential, it seems to be the dominant initial state (Wraight, 1982). Its v=0 level lies at an energy between those of the
A36u+(v=8, 9) levels, and thus the quintet can collisionally feed into v=8 with minimum exchange of energy (Slanger and Copeland, 2003). In addition, there is the situation that if O2is the most important collision partner for stabilization of
the nascent O2molecule, then the ground state fundamental
27 Figure 4. The A3Σ+
u (solid circles) and A'3∆u (open circles) vibrational distributions as a
function of the total energy of the levels.
Fig. 4. The A36+u (solid circles) and A031u(open circles)
vibra-tional distributions as a function of the total energy of the levels.
vibrational quantum, 1556 cm−1, is in near resonance with the A36u+(v=7) level. Further work is necessary to evaluate these two effects.
It should be kept in mind that the Chamberlain bands rep-resent only a portion of the A031u population. The =1,
2 sub-levels do not radiate in the A031u–a11g transition,
but preferentially radiate in the A031u–X36g−Herzberg III
bands, which are very weak in the atmosphere or the lab, and would be strongest below 300 nm, and are thus not observ-able from the ground. How rapidly the three levels collision-ally equilibrate is not known.
Noteworthy is the fact that there is substantial population at v=0 in the A36u+state distribution, the spectrum in Fig. 5 being the first reported observation of v=0 emission. The DI-ATOM simulation identifies the lines of the A–X 0–10 band; additional lines belong to the Chamberlain 8–8 band. In a calibrated spectrum obtained with the Keck II+ESI spectro-graph system, we have determined an intensity of 2 R for the
A–X 0–10 band, from which the emission intensity out of
A36+u(v=0) is calculated to be 14 R for that particular spec-trum. Summing the vibrational distribution and relating it to this absolute intensity gives a Herzberg I system intensity of 400 R. Five bands of A36u+(v0=0) are discernible in the HIRES spectra, for v00=7–11.
In addition to obtaining the vibrational distributions for the
A36+u and A031ustates, it is possible to compare band
in-tensities of the two transitions in the same order, to obtain a comparison of relative intensities. We earlier reported a ratio of 4:1 for the total intensities in the Herzberg I and Chamber-lain systems, respectively (Slanger and Huestis, 1981). Com-parison is best done at the peaks of the distributions, and for this purpose we choose to look at the Herzberg I 6–7 band and the Chamberlain 8–2 band. These lie at essentially the same wavelength, and comparison can be made for the same pair of bands measured by Stegman and Murtagh (1988).
3310 T. G. Slanger et al.: Nightglow vibrational distributions in the A36+u and A031ustates of O2
28 Figure 5. Keck/HIRES spectrum of the A3Σ+
u - X3Σg - 0-10 band (upper) and a DIATOM
simulation (lower), Additional lines belong to the Chamberlain 8-8 band.
Fig. 5. Keck/HIRES spectrum of the A36u+−X36g−0–10 band
(upper) and a DIATOM simulation (lower), additional lines belong to the Chamberlain 8–8 band.
Figure 6 shows the Keck I/HIRES spectrum, and below it a merge of the two O2bands scaled to match it.
Account-ing for the fractions of the level population that the bands represent (the A–X 6–7 band has 9.6% of the emission from
A36u+(v=6) while the A0-a 8–2 band has 27.6% of the emis-sion from A031u(v=8)), we find that the population ratio is
4.1:1 at the peak, where this value would be only slightly modified by summing all the levels. Thus, there is agree-ment between the present measureagree-ments and the earlier re-sults. Stegman and Murtagh (1988) found intensities of 7.29±0.17 R for A–X 6–7 and 5.35±0.24 R for A0-a 8–2, which results in a peak population ratio of 3.95. It should be pointed out that in the spectral region where measurements can be carried out from the ground, the Herzberg I and Cham-berlain bands have similar intensities. That the system inten-sity ratio is four is due to the fact that the Herzberg I bands are much more intense below 300 nm.
It is partially a consequence of differing radiating effi-ciencies that the Herzberg I emission intensity is four times greater than the Chamberlain intensity. The radiative life-time of the A36+u state is about 160 ms (Huestis et al., 1994), and while there has been no direct determination of
29 Figure 6. Comparison of a HIRES spectrum (top) and a DIATOM spectrum (bottom) containing the Herzberg I 6-7 band and the Chamberlain 8-2 band scaled for best fit.
Fig. 6. Comparison of a HIRES spectrum (top) and a DIATOM spectrum (bottom) containing the Herzberg I 6–7 band and the Chamberlain 8–2 band scaled for best fit.
the A031u(=3) radiative lifetime, it is probably 1–2 s. We
expect that the removal rate coefficients for the two states are similar at equal energy. In fact, even the O2(c16u−)kinetic
data that has been accumulated shows that at equal energies, the A36u+and c16u−states are removed by O2with
compa-rable rate coefficients (Slanger and Copeland, 2003). Thus, it is reasonable to assume that the difference in radiative ef-ficiencies accounts at least in part for the observed emission ratios, and the same reasoning is probably applicable to the
c–X emission intensities, where the c16u−radiative lifetime is close to 4 s (Huestis et al., 1994).
With knowledge of the A36u+and A031udistributions, it
is interesting to compare them to that of the b16g+state. The
A36+u/A031u populations are strongly peaked at relatively
high vibrational levels, but the b16+g population appears to collapse down to v=0 (Slanger et al., 2000a). We know that the excited vibrational levels in both states are rapidly re-laxed by O2collisions (Bloemink et al., 1998; Hwang et al.,
1999; Kalogerakis et al., 2002), but for b16g+(v=0) the relax-ation (by N2)is quite slow (Sander et al., 2003); in the 95 km
region, the collisional removal and radiative rates are about the same. For the A36u+(v=0) level, where the radiative rate
T. G. Slanger et al.: Nightglow vibrational distributions in the A36+u and A031ustates of O2 3311
is 6 s−1, if collisional removal is entirely by O2, then the
sit-uation would be equivalent if the O2 rate coefficient had a
value of 1×10⁻¹²cm3s−1.
The only literature value for the low-v rate coefficients comes from the work of Kenner and Ogryzlo (1980). They give a value of (2.9±2.0)×10−13cm3s−1 for the Herzberg I emission seen at 280–400 nm in a discharge flow system, which is primarily from v=1–3. Subsequently, they reported a value of 1.3×10⁻¹³cm3s−1for the v=2 level (Kenner and Ogryzlo, 1983). Recent investigations indicate that these numbers are probably too small, by at least an order of mag-nitude (Kirillov, 2002; Slanger and Copeland, 2003). Even so, a figure of 1×10⁻¹²cm3s−1 is a reasonable estimate, thus equating the radiating efficiency for the lowest levels of the A36u+ and b16g+ states. Since the fractional emis-sions out of the v=0 levels of the two states is so dramatically different, we conclude that the behavior of the two states is different in kind, and that the mechanisms of production and loss are not the same.
Such a conclusion is consistent with what we currently be-lieve. Wildt et al. (1991) have shown that when the higher levels of the A36+u state are excited, b16g+(v=0) is promptly formed upon O2collision (Wildt et al., 1991), and this
ob-servation has been confirmed (Shiau et al., 1998). It has also been shown by Ogryzlo et al. (1984) that in a discharge flow with recombining O-atoms in N2, b16+g(v=0) emission
is not seen until O2 is added. Therefore, O2(b16g+)is not
produced directly in significant quantities by atom recombi-nation, but requires collisions with O2; N2collisions do not
give the same result. It follows that the b16g+(v=0) seen in the atmosphere from the 95 km region mirrors Herzberg state production, and is not a primary product, as has often been discussed (Bates, 1995; McDade et al., 1986). In particular, its primary source is not cascading within the b16g+ mani-fold.
Similarly, for the A36u+ state there is evidence that cas-cading is a minor process for the upper vibrational levels in-vestigated. For instance, following v=7 excitation there is relatively little v=6 generated in air (Slanger and Copeland, 2003), and so the atmospheric vibrational distribution peaks at high v near its source, the energy of the recombining atoms. Even in laboratory afterglows in pure O2 at much
higher pressure (McNeal and Durana, 1969), the A36u+state vibrational distribution resembles the mesospheric distribu-tion. There is therefore a coherent picture emerging, in which the difference between the A36u+/A031u and b16+g
distri-butions is a consequence of the energy transfer process in which the Herzberg state population is converted in one step to b16g+(v=0). In a sense, this often studied emission is anomalous, and does not represent the b16g+state population as such, but is a collector for the Herzberg state population. For observation of processes within the b16+g manifold, it is necessary to investigate b16g+(v>0).
In fact, we see evidence for the analogous situation with O2(a11g, v=0) production (Kalogerakis et al., 2000). It is
promptly formed following A36u+(v=7) generation, with
si-multaneous production of very high vibrational levels of both the a11g and b16g+ states, the maximum levels observed
(a11g(v=19) and b16+g(v=15)) being resonant with
simul-taneous a11g(v=0) formation. It has also been shown that
a11g(v=0) production in an O(3P)/N2 discharge flow
sys-tem, where O2(A–X) emission is intense, and requires the
addition of O2to create the O2(a)(Ali et al., 1986).
In this discussion, we have barely alluded to O2(c16u−),
the third of the O2Herzberg states. This state is the source
of the strong Herzberg II emission in the Venus atmosphere, which is seen in the c–X transition but only from c16−U(v=0) (Krasnopolsky, 1986). We do not yet carry out the same anal-ysis for this system from Keck data, because the terrestrial bands are quite weak. Stegman and Murtagh (1988) list in-tensities of 0.26–0.9 R for the three bands they examined. Two of these bands, c–X 8-6 and 7-6, are discernible in the Keck data, and we estimate that the c–X 8–6 band is an order of magnitude weaker than the neighboring A–X 2–5 band, in agreement with the intensities reported by Stegman and Murtagh (1988). We have recently shown that there is an-other O2(c16−u) transition that is far easier to observe – the
c–b bands – and lines of this system are seen throughout the 400–450 nm region (Slanger et al., 2003b).
Curiously, we are not yet in a position to determine a pop-ulation distribution for the O2(c16u−)state from these bands,
because of the nature of the transition. For the Herzberg I and Chamberlain systems, it is possible to say that the radia-tive transition probabilities out of each vibrational level are approximately the same, and thus that the intensities are only related to production and loss terms (and Franck-Condon fac-tors). For the c–b transition this is not the case – the transition strength is strongly dependent on the energy gap between the
c16−u state vibrational level and the 115u perturbing state
that drives the transition. As a result, we see relatively strong emission from the v=8-11 c16−u state levels, but no emis-sion from levels below v=4. That this is not necessarily an indication of a smaller production rate into the low levels is confirmed by noting that neither in the Venus atmosphere, where c16u−(v=0) emission in the c–X bands is quite in-tense (Krasnopolsky, 1986), nor in the laboratory, where the same condition can be set up (Lawrence et al., 1977; Slanger, 1978), is there any indication of c16u−(v=0)-b16g+(v) emis-sion in the expected 650–750 nm range. Thus, although it is likely that the c16u−state population decreases towards low vibrational levels, as seen for the A36u+ and A031u states,
the observed c–b intensity distribution cannot be interpreted in the same way. Nevertheless, the strongest c–b bands seen in the atmosphere are from the c16−u(v=9, 10) levels, the en-ergies of which fall near the peaks of the A36u+and A031u
distributions shown in Fig. 4. It has previously been argued that the three states are collisionally coupled, and that trans-fer between them is facile (Slanger and Copeland, 2003). Thus, it is hardly surprising to find the population of each maximizing at comparable energies. As noted above, emis-sion from the c16u−(v=7, 8) levels in the c–X transition are identifiable in the Keck spectra, but the stronger bands near
3312 T. G. Slanger et al.: Nightglow vibrational distributions in the A36+u and A031ustates of O2
the peak of the energy distribution are at shorter wavelengths, and not observable from the ground. We estimate that the
c–X and c–b systems have comparable intensity, about 30 R, but the c–b bands are far easier to identify, both because of their much lower spectral line density, giving more photons per line, and because the strongest c–X bands cannot be seen from the ground.
3 Conclusions
The nightglow vibrational distributions of the O2A36u+and
A031ustates have been measured from rotationally-resolved
sky spectra obtained with the HIRES echelle spectrograph at the Keck I telescope on Mauna Kea. The A36u+(v) distribu-tion is very similar to that measured a number of years ago, with the exception that with more complete data, we now find the population in the v=0 level to be substantially larger, being 20% of the peak population at v=5, 6. The A031uand
A36u+ distributions are almost identical when expressed in terms of the internal energy of the molecule. Both distribu-tions peak at about 2000 cm−1below the dissociation limit, but the more rapid collisional removal with increasing vi-brational level at v≥6 in the A36+u state implies that most of the atom recombination production starts in the highest levels. We have compared the relative emission intensity ra-tios at the peak of the A36u+ and A031u distributions and
find A36u+ emission to be the more intense by a factor of four, consistent with earlier studies. The A36u+/A031u
atmo-spheric distributions contrast strongly with that of the b16g+
state, and probable reasons are discussed.
Acknowledgements. We are extremely grateful to W. Sargent for supplying us with the sky spectra, to T. Barlow for reducing them to a useable format, and to the NSF CEDAR program. A. Widhalm was supported through the NSF REU (Research Experience for Un-dergraduates) program. We acknowledge helpful discussions with K. S. Kalogerakis and R. A. Copeland. The W. M. Keck telescopes are operated jointly by the California Institute of Technology and the University of California.
Topical Editor U.-P. Hoppe thanks A. Kirillor and R. P. Lowe for their help in evaluating this paper.
References
Adler-Golden, S.: Kinetic Parameters for OH Nightglow Modeling Consistent with Recent Laboratory Measurements, J. Geophys. Res., 102, 19 969–19 976, 1997.
Ali, A. A., Ogryzlo, E. A., Shen, Y. Q., and Wassell, P. T.: The Formation of O2(a11g)in Homogeneous and Heterogeneous
Atom Recombination, Canadian Journal of Physics, 64, 1614– 1620, 1986.
Amaral, G. A., Lapcharoensap, W., Copeland, R. A., and Huestis, D. L.: Temperature-Dependent Rates and Branching Ratios for O2(55g, v=0, 1), EOS, Transactions of the American
Geophys-ical Union, 82, F955, 2001.
Bates, D. R.: The Nightglow, in Progress and Problems in Atmo-spheric Chemistry, edited by Barker, J. R., World Scientific, New Jersey, 420–471, 1995.
Bloemink, H. I., Copeland, R. A., and Slanger, T. G.: Collisional Removal of Vibrationally-Excited O2(b16g+, v=1, 2) by O2, N2,
and CO2, J. Chem. Phys., 109, 4237–4245, 1998.
Borrell, P. M., Borrell, P., and Ramsay, D. A.: High-Resolution Studies of the Near-Ultraviolet Bands of Oxygen: II: the A36u+–
X36g−System, Canadian Journal of Physics, 64, 721–725, 1986.
Broadfoot, A. L. and Bellaire, P. J.: Bridging the gap between ground-based and space-based observations of the night airglow, J. Geophys. Res., 104, 17 127–17 138, 1999.
Chamberlain, J. W.: The ultraviolet airglow spectrum, Astrophysics Journal, 123, 277–286, 1955.
Copeland, R. A. and Kalogerakis, K. S.: The Temperature Depen-dence of the Collisional Removal of O2(A36u+, v=6, 7), EOS,
Transactions of the American Geophysical Union, 81, F943, 2000.
Copeland, R. A., Kalogerakis, K. S., Chang, B.-Y., and Huestis, D. L.: Collisional Removal of O2(55g)at 195 and 150 K, EOS,
Transactions of the American Geophysical Union, 82, S283, 2001.
Copeland, R. A., Knutsen, K., Onishi, M. E., and Yalc¸in, T.: Colli-sional Removal of O2(c16u−, v=9) by O2, N2, and He, J. Chem.
Phys., 105, 10 349–10 355, 1996.
Coquart, B. and Ramsay, D. A.: High-Resolution Studies of the Near-Ultraviolet Bands of Oxygen: III: the A031u–X36g−
Sys-tem, Canadian Journal of Physics, 64, 726–732, 1986.
Eastes, R. W., Huffman, R. E., and LeBlanc, F. J.: NO and O2 Ultra-violet Nightglow and Spacecraft Glow From the S3–4 Satellite, Planet. Space Sci., 40, 481–493, 1992.
Fateev, A. A., Ivanov, V. S., Pravilov, A. M., and Smirnova, L. G.: Relative Einstein Coefficients and Dipole Moments of the O2(A36u+, v0–X36g−, v00; c16u−, v0–X36−g, v00) Transitions
Measured in Oxygen Atom Recombination Accompanied by Ra-diation, Journal of Physics B, 29, 1351–1467, 1996.
Huestis, D. L.: DIATOM Spectral Simulation Computer Program, SRI International, Menlo Park, 1994.
Huestis, D. L.: Current Laboratory Experiments for Planetary Aeronomy, in Atmospheres in the Solar System: Comparative Aeronomy, edited by Mendillo, A., Nagy, A., and Waite, J. H., American Geophysical Union, Washington D.C., 245–258, 2002. Huestis, D. L., Copeland, R. A., Knutsen, K., Slanger, T. G., Jongma, R. T., Boogaarts, M. G. H., and Meijer, G.: Branch Intensities and Oscillator Strengths for the Herzberg Absorption Systems in Oxygen, Canadian Journal of Physics, 72, 1109– 1121, 1994.
Huestis, D. L., Cosby, P. C., Slanger, T. G., and Osterbrock, D. E.: High Vibrational Levels and Potential Energy Curves for the O2 a11g, b16g+, and X36−g States Derived from
Atmo-spheric Nightglow Emissions, in 54th International Symposium on Molecular Spectroscopy, Columbus, OH, 1999.
Hwang, E. S., Bergman, A., Copeland, R. A., and Slanger, T. G.: Temperature Dependence of the Collisional Removal of O2(b16+g,v=1 and 2) at 110–260 K, and Atmospheric
Applica-tions, J. Chem. Phys., 110, 18–24, 1999.
Hwang, E. S. and Copeland, R. A.: Temperature Dependence of the Collisional Removal of O2(A36u+, v=9) with O2and N2,
Geophys. Res. Lett., 24, 643–646, 1997.
Hwang, E. S., Copeland, R. A., Robertson, R. M., and Slanger, T. G.: Collisional Removal of O2(a11g)v=1, 2 and Detection of
O2(a11g)and O2(b16g+) from Photodissociation of Ozone at
310–340 nm, EOS, Transactions of the American Geophysical Union, 79, F85, 1998.
T. G. Slanger et al.: Nightglow vibrational distributions in the A36+u and A031ustates of O2 3313
Jenouvrier, A., Merienne, M.-F., Coquart, B., Carleer, M., Fally, S., Vandaele, A. C., Hermans, C., and Colin, R.: Fourier transform spectroscopy of the O2Herzberg bands, I. Rotational analysis, Journal of Molecular Spectroscopy, 198, 136–162, 1999. Kalogerakis, K. S., Copeland, R. A., and Slanger, T. G.: Collisional
Removal of O2(b16g+, v=2, 3), J. Chem. Phys., 116, 4877–4885,
2002.
Kalogerakis, K. S., Slanger, T. G., and Copeland, R. A.: Temper-ature dependence of the collisional removal rate constants for O2(b, v=2, 3), EOS, Transactions of the American Geophysical Union, 81, S332, 1999.
Kalogerakis, K. S., Totth, A., Cosby, P. C., Slanger, T. G., and Copeland, R. A.: Laboratory Studies of the Production of Highly Vibrationally Excited O2(a11g and b16g+)from O2(A36u+)
Relaxation, EOS, Transactions of the American Geophysical Union, 81, F944, 2000.
Kenner, R. D. and Ogryzlo, E. A.: Deactivation of O2(A36u+)by
O2, O, and Ar, International Journal of Chemical Kinetics, 12,
501–508, 1980.
Kenner, R. D. and Ogryzlo, E. A.: Quenching of O2(c16u−)v=0 by
O(3P), O2(a11g), and Other Gases, Canadian Journal of
Chem-istry, 61, 921–926, 1983.
Kerr, C. M. L. and Watson, J. K. G.: Rotational Line Strengths in31–36 Electronic Transitions, The Herzberg III System of Molecular Oxygen, Can. J. Phys., 64, 36–44, 1986.
Kirillov, A.: Calculation of rate coefficients of intramolecular and intermolecular electron energy transfer processes, II Molecular oxygen, in Committee on Space Research (COSPAR), Houston, TX, 2002.
Knutsen, K., Dyer, M. J., and Copeland, R. A.: Laser Double-Resonance Study of the Collisional Removal of O2(A36u+, v=6,
7, 9) with O2, N2, CO2, Ar and He, J. Chem. Phys., 101, 7415–
7422, 1994.
Krasnopolsky, V. A.: Oxygen Emissions in the Night Airglow of the Earth, Venus and Mars, Planet. Space Sci., 34, 511–518, 1986. Lawrence, G. M., Barth, C. A., and Argabright, V.: Excitation of
the Venus Night Airglow, Science, 195, 573, 1977.
L´opez-Gonz´alez, M. J., L´opez-Moreno, J. J., and Rodrigo, R.: Al-titude and Vibrational Distribution of the O2Ultraviolet
Night-glow Emissions, Planet. Space Sci., 40, 913–928, 1992. McDade, I. C., Llewellyn, E. J., Greer, R. G. H., and Murtagh, D.
P.: ETON 6: rocket measurement of the O2Infrared Atmospheric (0–0) band in the nightglow, Planet. Space Sci., 35, 1541–1552, 1987.
McDade, I. C., Murtagh, D. P., Greer, R. G. H., Dickinson, P. H. G., Witt, G., Stegman, J., Llewellyn, E. J., Thomas, L., and Jenk-ins, D. B.: ETON 2: Quenching Parameters for the Proposed Precursors of O2(b16+g)and O(1S) in the Terrestrial Nightglow,
Planet. Space Sci., 34, 789–800, 1986.
McNeal, R. J. and Durana, S. C.: Absolute Chemiluminescent Re-action Rates for Emission of the O2Herzberg Bands in Oxygen and Oxygen-Inert-Gas Afterglows, J. Chem. Phys., 51, 2955– 2960, 1969.
Merienne, M. F., Jenouvrier, A., Coquart, B., Carleer, M., Fally, S., Colin, R., Vandaele, A. C., and Hermans, C.: Fourier trans-form spectroscopy of the O2Herzberg bands, II. Band oscillator
strengths and transition moments, Journal of Molecular Spec-troscopy, 202, 171–193, 2000.
Nieh, J.-C. and Valentini, J. J.: Molecular Potentials from CARS Photofragment Spectroscopy: Spectroscopic Constants and Po-tential Energy Curve for O2(a11g), J. Phys. Chem., 91, 1370–
1374, 1987.
Ogryzlo, E. A., Shen, Y. Q., and Wassell, P. T.: The Yield of O2(b16+g)in Oxygen Atom Recombination, Journal of
Photo-chemistry, 25, 389–398, 1984.
Owens, J. K., Torr, D. G., Torr, M. R., Chang, T., Fennelly, J. A., Richards, P. G., Morgan, M. F., Baldridge, T. W., Fellows, C. W., Dougani, H., Swift, W., Tejada, A., Orme, T., Germany, G. A., and Yung, S.: Mesospheric nightglow spectral survey taken by the ISO Spectral Spatial Imager on Atlas 1, Geophys. Res. Lett., 20, 515–518, 1993.
Sander, S. P., Friedl, R. R., Golden, D. M., Kurylo, M. J., Huie, R. E., Orkin, V. L., Moortgat, G. K., Ravishankara, A. R., Kolb, C. E., Molina, M. J., and Finlayson-Pitts, B. J.: Chemical Kinet-ics and Photochemical Data for Use in Stratospheric Modeling, Evaluation Number 14, National Aeronautics and Space Admin-istration, Jet Propulsion Laboratory, 1, 8, 2003.
Santoro, A. L., Huestis, D. L., and Slanger, T. G.: Spectral Analysis of Atlas I/ISO O2Ultraviolet Nightglow Data, and Comparison
with Laboratory Afterglows, EOS, Transactions of the American Geophysical Union, 75, F496, 1994.
Saxon, R. P. and Slanger, T. G.: Molecular Oxygen Absorption Continua at 195–300 nm and O2 Radiative Lifetimes, J.
Geo-phys. Res., 91, 9877–9879, 1986.
Shiau, T. P., Hwang, E. S., Buijsse, B., and Copeland, R. A.: Vibrational-level-dependent Yields of O2(b16g+, v=0)
Follow-ing Collisional Removal of O2(A36+u, v), Chem. Phys. Letters
282, 369–374 (1998).
Slanger, T. G.: Generation of O2(c16−u, C031u, A36u+)from
Oxy-gen Atom Recombination, J. Chem. Phys., 69, 4779–4791, 1978. Slanger, T. G. and Copeland, R. A.: Energetic Oxygen in the Upper Atmosphere and the Laboratory, Chemical Reviews, 103, (12), 4731–4765, 2003.
Slanger, T. G., Cosby, P. C., and Huestis, D. L.: Ground-based observation of high-altitude high-temperature emission in the O2Atmospheric band nightglow, J. Geophys. Res., 108, (A7),
doi:10.1029/2003JA009885, 2003a.
Slanger, T. G., Cosby, P. C., and Huestis, D. L.: A new O2band
system: The c16−u−b16g+transition in the terrestrial nightglow,
J. Geophys. Res., 108, (A2), 1089, 2003b.
Slanger, T. G., Cosby, P. C., Huestis, D. L., and Osterbrock, D. E.: Vibrational Level Distribution of O2(b16g+, v=0–15) in the
Mesosphere and Lower Thermosphere Region, J. Geophys. Res., 105, 20 557–20 564, 2000a.
Slanger, T. G. and Huestis, D. L.: O2(c16u−–X36g−)Emission
in the Terrestrial Nightglow, J. Geophys. Res., 86, 3551–3554, 1981.
Slanger, T. G., Huestis, D. L., Cosby, P. C., and Osterbrock, D. E.: Accurate Atomic Line Wavelengths from Astronomical Sky Spectra, J. Chem. Phys., 113, 8514–8520, 2000b.
Slanger, T. G., Huestis, D. L., Osterbrock, D. E., and Fulbright, J. P.: The Isotopic Oxygen Nightglow as Viewed From Mauna Kea, Science, 277, 1485–1488, 1997.
Slanger, T. G., Huestis, D. L., Cosby, P. C., Naus, H., and Mei-jer, G.: O2Photoabsorption in the 40 950–41 300 cm−1Region:
New Herzberg Bands, New Absorption Lines, and Improved Spectroscopic Data, J. Chem. Phys., 105, 9393–9402, 1996. Smith, I. W. M.: The Role of Electronically Excited States in
Re-combination Reactions, International Journal of Chemical Kinet-ics, 16, 423–443, 1984.
Stegman, J.: Spectroscopic and Kinetic Studies of Atmospheric Oxygen Emissions, Ph. D. thesis, Stockholm University, Stock-holm, 40–42, 1991.
3314 T. G. Slanger et al.: Nightglow vibrational distributions in the A36+u and A031ustates of O2
Stegman, J. and Murtagh, D. P.: High Resolution Spectroscopy of Oxygen U.V. Airglow, Planet. Space Sci., 36, 927–934, 1988. Stegman, J. and Murtagh, D. P.: The Molecular Oxygen Band
Sys-tems in the U.V. Nightglow: Measured and Modelled, Planet. Space Sci., 39, 595–609, 1991.
Wildt, J., Bednarek, G., Fink, E. H., and Wayne, R. P.: Laser Ex-citation of the A36u+, A031u, and c16u−States for Molecular
Oxygen, Chemical Physics, 156, 497–508, 1991.
Wraight, P. C.: Associations of Atomic Oxygen and Airglow Exci-tation Mechanisms, Planet. Space Sci., 30, 251–259, 1982. Yoshino, K., Esmond, J. R., Murray, J. E., Parkinson, W. H.,
Thorne, A. P., Learner, R. C. M., and Cox, G.: Band Oscillator Strengths of the Herzberg I Bands of O2, J. Chem. Phys., 103,