HAL Id: hal-02796547
https://hal.inrae.fr/hal-02796547
Submitted on 5 Jun 2020
HAL is a multi-disciplinary open access
archive for the deposit and dissemination of sci-entific research documents, whether they are pub-lished or not. The documents may come from teaching and research institutions in France or abroad, or from public or private research centers.
L’archive ouverte pluridisciplinaire HAL, est destinée au dépôt et à la diffusion de documents scientifiques de niveau recherche, publiés ou non, émanant des établissements d’enseignement et de recherche français ou étrangers, des laboratoires publics ou privés.
The use of milk fatty acids as predictors of enteric
methane emission in dairy cows
Abdulai Guiguina
To cite this version:
Abdulai Guiguina. The use of milk fatty acids as predictors of enteric methane emission in dairy cows. Life Sciences [q-bio]. 2014. �hal-02796547�
Internship Report
The use of milk fatty acids as predictors of enteric methane
emission in dairy cows
From April 15 to July 31, 2014
By
Abdulai Guinguina
Erasmus Mundus Sustainable Animal Nutrition and Feeding (EM-SANF)
Internship Supervisors:
Anne Ferlay
Cécile Martin
INRA – UMRH Theix, 63122 Saint-Genès –Champanelle, France 75 voie du TOEC, 31076
Toulouse, France
Droevendaalsesteeg 4, 6708 PB Wageningen, the Netherlands
De Elst 1, 6700 AH
Table of contents Page
List of tables ... i
List of figures ... ii
ACKNOWLEGEMENTS ... iii
OVERVIEW OF INRA ... iv
I. Background information on INRA ... iv
II. Missions of INRA ... iv
III. Clermont-Ferrand-Theix-Lyon Research Centre ... iv
IV. Herbivores Joint Research Unit ... v
V. The team AGL ... vi
VI. The team DIMA ... vi
ABSTRACT ... viii
RÉSUMÉ ... viii
1. INTRODUCTION ... 1
2 LITERATURE REVIEW ... 2
2.1 Mechanisms of CH4 production in the rumen ... 2
2.2 Measurement of Methane Emission from Dairy Cattle ... 3
2.3 Lipid metabolism in the rumen ... 4
2.4 Lipid metabolism in the mammary gland ... 6
2.5 Relationships between milk fatty acid profiles and CH4 production in the rumen ... 7
2.6 Objectives of Internship ... 11
3 MATERIALS AND METHODS ... 11
3.1 Selection of publications ... 11
3.2 Creating the data base ... 12
i
3.4 Coding of experiments ... 12
3.5 Meta-analysis ... 13
4 RESULTS ... 14
5 DISCUSSION ... 17
5.1 Milk branched – chain fatty acids (BCFA) ... 17
5.2 Milk C16:0 ... 18
5.3 Intermediates of rumen biohydrogenation ... 19
6 CONCLUSION ... 19
Publications used for the meta-analysis ... 24
APPENDIX ... 26
List of tables Page Table 1 strengths and weaknesses of in vivo methane measuring techniques in dairy cows .... 4
Table 2 Different predictive equations for CH4 emission in dairy cows ... 10
Table 3 Summary descriptive statistics of selected milk FA in the database used for analysis ... 14
Table 4 Correlation coefficients1 between milk FA content and the CH4 emissions expressed in g/d, g/kg DMI and g/kg milk ... 15
Table 5 General linear model results for the relation between CH4 emissions and milk FA content taking into account experimental effect... 15
Table 6 General linear model results for the relation between CH4 emission and milk FA content for experiments with lipid supplementation of the diet ... 16
Table 7 General linear model results for the relation between CH4 emission and milk FA content for experiments without lipid supplementation of the diet ... 17
ii
List of figures Page
Figure 1 Organigram of Herbivores Joint Research Unit UMR1213 ... v Figure 2 Schematic representation of the main driving variables for H2 excess and
methanogenesis. ... 3
Figure 3 Global approach for the relation between CH4 emission (g/d, g/kg DMI and g/kg
milk) and milk FA content in isoC16:0, anteisoC17:0 and sum of BCFA (g/100g of total FA) ... 26
Figure 4 Global approach for the relation between CH4 emission (g/d and g/kg DMI) and
milk FA content (g/100g of total FA) arising from rumen biohydrogenation ... 26
Figure 5 Global approach for the relation between CH4 emission (g/d) and milk FA content in
isoC15:0 and anteisoC15:0 (g/100g of total FA) ... 27
Figure 6 Global approach for the relation between CH4 emission (g/kg milk) and milk C16:0
content (g/100g of total FA) ... 27
Figure 7 Relation between CH4 emission (g/d) and milk FA content (g/100g of total FA)
taking into account experimental effect ... 28
Figure 8 Relation between CH4 emission (g/d) and milk FA content (g/100g of total FA) for
experiments with dietary lipid supplementation ... 28
Figure 9 Relation between CH4 emission (g/d) and milk FA content (g/100g total milk FA)
for experiments without supplementation of lipids in the diet ... 29
Figure 10 Relation between CH4 emission (g/kg DMI) and milk FA content (g/100g of total
FA) taking into account experimental effect ... 29
Figure 11 Relation between CH4 emission (g/kg DMI) and milk FA content (g/100g of total
FA) for experiments with dietary lipid supplementation ... 30
Figure 12 Relation between CH4 emission (g/ kg DMI) and milk FA content (g/100g total
milk FA) for experiments without supplementation of lipids in the diet ... 30
Figure 13 Relation between CH4 emission (g/kg milk) and milk FA content (g/100g of total
FA) taking into account experimental effect ... 31
Figure 14 Relation between CH4 emission (g/kg milk) and milk FA content (g/100g of total
FA) for experiments with dietary lipid supplementation ... 31
Figure 15 Relation between CH4 emission (g/ kg DMI) and milk FA content (g/100g total
iii
ACKNOWLEGEMENTS
I would like to thank my internship supervisors, Anne Ferlay and Cécile Martin, for giving me their trust, availability, explanations on the subject, but also for their kindness and great patience.
Thanks to Maguy Eugène and Jacques Rouel for their help in the creation of the data base, their constructive criticism and good humour! I thank Pierre Nozière and Jessie Guyader for their help in introducing me to Minitab statistical software and in analysing the data base.
Thanks are also due to Annie Royet for being my gateway to INRA not forgetting my MSc. Supervisor Jan Dijkstra through whom coming to INRA became a reality.
I would also like to extend my profound gratitude to the European commission for the award of Erasmus Mundus Scholarship which has helped make me a better person.
iv
OVERVIEW OF INRA
I. Background information on INRA
The Institut National de la Recherche Agronomique (INRA) also known as the French National Institute for Agricultural Research is a public body establishment under the dual supervision of the Ministry of Higher Education and Research and the Ministry of Agriculture, Food and Fisheries. Although it is the second largest public research institute in France, INRA ranks the number one agricultural institute in Europe and number two in the world. It was set up in 1946 after World War II in response to pressing demands from society to feed France. Today, it plays a key role in overcoming global challenges such as climate change, nutritional status of populations, ecological equilibrium of rural areas, competitiveness and sustainability of agricultural production. Approximately 9000 people work at INRA in one of 13 research departments (made up of 200 research and experimental units) and 17 regional research centres (on over 150 sites) throughout France. These include 4100 researchers and engineers and 4500 technicians and administrative staff. In addition, the institute welcomes over 1700 doctoral students, 1000 foreign researchers and 1900 interns each year.
II. Missions of INRA
The missions of INRA are:
1. to produce and disseminate scientific knowledge
2. to develop innovations and know-how for the benefit of society
3. through its expertise, to inform decision-making by public and private sector players 4. to develop scientific and technical culture and participate in the science/society debate 5. to contribute to training in and through research.
III. Clermont-Ferrand-Theix-Lyon Research Centre
The centre of Clermont-Ferrand-Theix-Lyon consists of 27 research and experimental units situated on four sites in Auvergne region (Theix, Crouël, Aurillac and Monts d’Auvergne), one in Rhône-Alpes region (Lyon) and one in Limousin region (Limoges). The centre develops multidisciplinary research themes which relate to animal and animal product sector, as well as plant improvement and human nutrition. It represents a strong potential for INRA, as it brings together 8% of the total workforce of the Institute and is the third of the 17 research centres. The Centre is a major player in research in the Auvergne region, representing 15% of the regional scientific forces.
v
INRA in Auvergne with an annual budget of €60 million has been able to achieve between 2008 and 2012, 26 projects funded by the National Research Agency, 30 European projects and 1600 published scientific articles in peer-reviewed reading.
IV. Herbivores Joint Research Unit
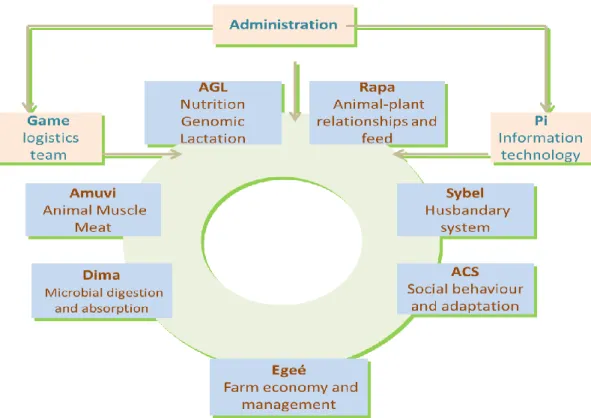
Herbivores Joint Research Unit (UMR1213) is a joint research unit associating INRA with VetAgro Sup which is an institute of higher education and research in food, animal health, agriculture and environmental sciences. Within INRA, UMR1213 is attached to two departments (PHASE for Physiologie et système d’élevage and SAE2 for Sciences sociales, agriculture et alimentation, espace et environnement). It contributes to the design of sustainable farming systems for herbivores that seek to reconcile production efficiency, product quality and socio-economic viability with environmental protection and valuation, and animal welfare. The unit is composed of 143 permanent staff (includes 75 researchers and engineers) and 100 temporary staff (made up of 20 PhD students and post-doctoral fellows). With an annual operating budget of €3.5 million (which 1/3 comes from contracts) it produces 320 papers each year. The unit has produced and co-produced two computer-aided decision-making software packages (INRAtion and Prévalim 200 users) and five current patents. UMR1213 comprises seven research teams and two support teams (Figure 1).
vi
I did my internship in two teams: AGL and DIMA. I will therefore, limit my presentation on these two teams.
V. The team AGL
The team leader is Christine Leroux and co-leader is Anne Ferlay. The mission of the AGL team is to study the nutritional and physiological factors that regulate leptinemia, lipogenesis in adipose and udder tissue, and the fatty acid composition of milk in order to improve the nutritional and sensory qualities of milk and, performance of dairy ruminants. Their latest research projects have mainly focused on the short- and long-term effects of forage type (grazed or conserved grass), oilseed lipid supplements and their integration on the fatty acid (FA) content and composition of cow and goat milk. Parallel studies have investigated the effects of diet on lipogenic regulation (transcripts and enzyme activities) and gene expression profiles (transcriptomics analysis) in the mammary gland and adipose tissue in lactating ruminants. Another study reports the effects of low-input systems on metabolic and hormonal profiles in early lactating cows. The main methods used include the measurement of lipogenic enzyme activities, the analysis of gene expression (real-time RT-PCR, and transcriptome) in the mammary gland and in adipose tissue, gas-phase and high-performance liquid chromatography (GC/HPLC) on milk FA, plasma metabolic and hormonal profiling (radioimmunoassay), and the determination of adipocyte size and immunohistochemistry. These methods are applied to animals under physiological and nutritional-controlled (diet trials) conditions.
VI. The team DIMA
The team leader is Morgavi Diego and co-leader is Pierre Nozière. The DIMA team studies digestive processes and their impact on production and the environment. The team analyzes the principles and mechanisms underlying ruminal digestion and digestive absorption. Special focus is given to the fine-grained characterization of the ruminal microbial ecosystem in terms of its hydrolysis, fermentation and detoxification functions. This team’s main mission is to enable dietary control of the rumen microbial ecosystem and digestive flows of macronutrients and micronutrients in ruminants, for three core outcomes: 1) environmental protection and productive efficiency, 2) safeguarding animal heath, 3) improving the health status and nutritional quality of animal products for human consumption.
vii
To implement these programmes, the DIMA team analyzes nutrient digestion and digestive absorption in ruminants via modelling, in vitro simulation of rumen function, and in vivo experiments on cattle or smaller ruminants in farmed or production (milk, meat) settings. The team also works on mitigation of greenhouse gases (GHG) emissions and mainly on methane (CH4). This is because CH4 is the most important component of GHG emissions in
ruminant production irrespective of the type of production system and it also represents a loss of energy for the animal. So the development of strategies to mitigate CH4 emissions will
have both environmental benefits for the planet and nutritional benefit for the animal. The
originality of DIMA’s approach is to study methanogenesis at different scales: the microbe,
the animal and the farm scale with the following main objectives: i. To better understand methanogenesis in the rumen, ii. To quantify CH4 emissions under different conditions
iii. To propose mitigation options and
viii
ABSTRACT
There is a need for the development of simple ways of measuring CH4 emissions in dairy
cows. The aim of this study was to conduct a meta-analysis in order to evaluate the relationship between CH4 production and milk FA in dairy cows. A data base was built from
14 publications reporting 15 in vivo experiments with a total of 44 dietary treatments. The experiments included in the database recorded CH4 emission and milk FA profile measured on
the same group of animals. To determine the relationships between milk FA profile and CH4
emissions, global correlations between these two parameters were first obtained. All milk FA that showed significant correlations (P< 0.05 and │r│≥0.4) with CH4 were retained. This
included three groups of milk FA: BCFA (isoC15, anteisoC15:0, isoC16 and anteisoC17) and C16:0 were positively related to CH4 and intermediary products of rumen biohydrogenation
(milk t16 + c14-C18:1, sum of all C18:2 and sum of PUFA) were negatively related to CH4.
A second approach was to explore the effect of experiment on the relationship between CH4
and these milk FA and subsequently the effect of lipid or non-lipid supplementation in the diet. Correlations between CH4 emissions and tested variables were stronger when compared
with those obtained with all diets. This shows that the prediction of CH4 by these milk FA is
diet dependent. Milk FA can be considered as good predictors of CH4 emission in dairy cows
but more data are needed with a wide range of diets to confirm these predictions.
Key words: Meta-analysis, CH4, FA, milk, dairy cow
RÉSUMÉ
Il est nécessaire pour le développement de moyens simples de mesurer les émissions de CH4
des vaches laitières. Le but de cette étude était de procéder à une méta-analyse afin d'évaluer la relation entre la production de CH4 et les acides gras (AG) du lait. Une base de données a
été construite à partir de 14 publications portant sur 15 expériences in vivo avec un total de 44 traitements alimentaires. Les expériences utilisées dans la base de données rapportaient les émissions de CH4 et le profil en AG du lait mesurés sur les mêmes animaux. Pour déterminer
les relations entre le profil d’AG du lait et les émissions de CH4, les corrélations globales
entre ces 2 paramètres ont d'abord été obtenues. Tous les AG du lait qui ont montré des corrélations significatives (P< 0.05 et │r│≥0.4) avec les émissions de CH4 ont été retenus.
Cela concernait trois groupes d’AG du lait: les AG à chaine ramifiée (isoC15, anteisoC15:0,
ix
intermédiaires de biohydrogénation du rumen (t16+c14-C18:1, somme de tous les C18:2 et somme des AG polyinsaturés) étaient négativement liés au CH4. Une deuxième approche a
consisté à étudier la relation entre CH4 et ces AG du lait en considérant toutes les expériences
de la base de données puis en distinguant les expériences avec ou sans supplémentation lipidique dans l'alimentation. Les corrélations ainsi obtenues étaient améliorées par rapport à celles obtenues avec tous les régimes confondus. Ceci montre que la prédiction de CH4 par
ces AG du lait dépend de l'alimentation. Les AG du lait peuvent être considérées comme de bons prédicteurs des émissions de CH4 chez la vache laitière, mais plus de données sont
nécessaires avec une large gamme de régimes pour confirmer ces prévisions.
1
1. INTRODUCTION
The production of greenhouse gases (GHG) from livestock and their impact on climate changes are a major concern worldwide (Steinfeld et al., 2006). Methane (CH4) is one of the
three main GHG, together with carbon dioxide (CO2) and nitrous oxide (N2O). It has been
reported that enteric CH4 is the most important GHG emitted (50-60%) at the farm scale in
ruminant production systems (Ogino et al., 2007). CH4 represents also a significant energy
loss to the animal ranging from 2 to 12% of gross energy (GE) intake (Johnson and Johnson, 1995). So, decreasing the production of enteric CH4 from ruminants without altering animal
production is desirable both as a strategy to reduce global GHG emissions and as a means of improving feed conversion efficiency (Martin et al., 2010).
Enteric CH4 mitigation in ruminants is possible through various strategies e.g. reviews of
(Beauchemin et al., 2008; Martin et al., 2010; Patra, 2012). Actually, the feeding strategy approach is the most developed. Thus, evaluation and comparison among various dietary strategies could be necessary in order to define appropriate mitigation strategies and thereafter to quantify CH4 emissions. However, accurate CH4 measurements require intricate and
expensive techniques which make their application under field conditions not feasible. For these reasons, mathematical models (empirical models and mechanistic models) have been developed for predicting CH4 emissions. Mechanistic models are complex and require inputs
which are not commonly measured (Dijkstra et al., 2011). Although, empirical models represent a rather practical tool to estimate CH4 emissions, their accuracy of prediction for a
range of nutritional strategies is low due to overestimation (Alemu et al., 2011). Hence the use of biomarkers, as simple, non-invasive and attainable measurements to predict CH4
emissions in ruminants may be useful as it is able to reveal changes caused by diet composition and/or physiological status.
Recently, attention has been directed towards the use of milk fatty acids (FA) as biomarkers for prediction of CH4 emissions in dairy ruminants. Milk FA are targeted because the
precursors for both the synthesis of CH4 and mammary de novo synthesis of even saturated
FA (≤C16) arise in the rumen (Mohammed et al., 2011), explaining the positive correlation between de novo FA (particularly C8:0, r= 0.90 and r=0.37) and CH4 emissions reported by
Chilliard et al. (2009) and Mohammed et al. (2011), respectively. Moreover, Vlaeminck and Fievez (2005) suggested a higher potential of milk odd-and branched-chain FA (OBCFA) to predict CH4 emissions due to their strong link to individual molar proportions of volatile fatty
2
acids (VFA) in the rumen. However, differences exist across studies in the main milk FA used as CH4 predictors (Dijkstra et al., 2011; Montoya et al., 2011) (Vlaeminck and Fievez, 2005).
Despite the fact that milk FA present high potential to predict rumen CH4 emissions, models
developed in dairy cows are restricted to diets varying in nature and amount of FA (Chilliard
et al., 2009; Dijkstra et al., 2011; Mohammed et al., 2011) which limits their application
under various feeding conditions. Although Dijkstra et al. (2011) considered 3 experiments; the dietary treatments were limited to fat sources. Thus a relatively broader range of diets and physiological conditions is required to explore a more general potential of milk FA as predictors of CH4 emissions in dairy cows.
2 LITERATURE REVIEW
2.1 Mechanisms of CH4 production in the rumen
Most of the enteric CH4 produced by ruminants has its origin in the rumen (~90% vs. 10% at
mean in the large intestine) (Murray et al., 1976). Microbial digestion of feed components in the rumen under anaerobic conditions results in the production of volatile fatty acids (VFA), mainly acetate, propionate and butyrate used by the animal as source of energy, and the production of gases (CO2 and CH4) eliminated through eructation (Murray et al., 1976; Boadi
et al., 2004). Rumen microbes find the energy they need in the form of ATP through
dehydrogenation reactions releasing hydrogen (H2) in the rumen. H2 produced is used by
methanogenic archaea, a microbial group distinct from Eubacteria, to reduce CO2 into CH4
(Martin et al., 2010) according to the equation: CO2 + 4H2 → CH4 + 2 H2O. Methanogenesis
is essential for an optimal performance of the rumen (McAllister and Newbold, 2008) by avoiding H2 accumulation which would lead to inhibition of dehydrogenase activity and
cessation of fermentation (McAllister and Newbold, 2008). The amount of H2 produced in the
rumen is highly dependent on composition of basal diet, nature of forage, chemical composition, on the organization of the microbial ecosystem, and on the residence time of feeds in the rumen. The production of VFA is not equivalent in terms of H2 output. For
instance, the formation of propionate (propionogenesis) consumes H2 whereas the formation
of acetate and butyrate results in a net release of H2 (Bannink et al., 2011). The quantity of
CH4 produced per unit of fermented feed is proportional (CH4 = 0.45 acetate – 0.275
3
a lower acetate and butyrate production results in lower CH4 emission (and vice versa) while
propionate formation serves as a competitive pathway for H2 use in the rumen.
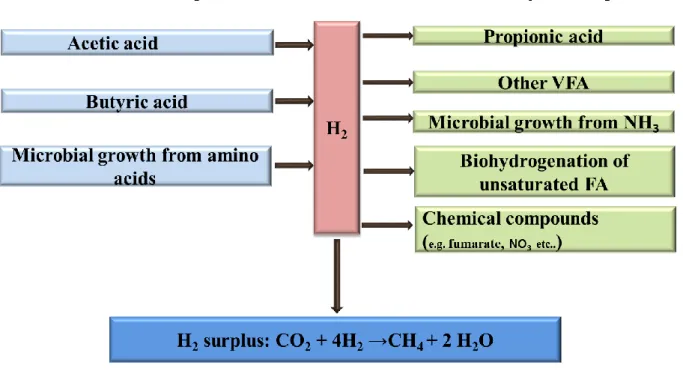
Though VFA are the main driving variables for excess H2 and methanogenis, other factors of
minor importance exist (Figure 1): the use of amino acids as nitrogen (N) source for microbial biomass synthesis results in net production of H2, whereas that of ammonia (NH3) induces a
net consumption H2 (Bannink et al., 2011). Biohydrogenation of long chain unsaturated FA
and some chemical compounds (e.g. sulphate, nitrate, ferric iron, manganese and fumarate) though quickly reduced and exhaust (McAllister and Newbold, 2008; van Zijderveld, 2011; Jeyanathan et al., 2014) also serve as alternative H2 sink.
Figure 2 Schematic representation of the main driving variables for H2 excess and
methanogenesis.
Adapted from (Bannink et al., 2011)
2.2 Measurement of Methane Emission from Dairy Cattle
To properly evaluate mitigation strategies, it must be possible to quantify cattle emissions under diverse conditions. Various techniques used to measure CH4 emissions in vivo have
been reported in literature. These include the use of gold standard reference method (respiration chambers; (Frankenfield, 2010)), SF6 tracer technique (Storm et al., 2012) and the
4
Green-Feed (C-lock Inc., USA) system (Hammond et al., 2013) and the novel approaches such as laser CH4 detector (Chagunda, 2013). Their strengths and weaknesses have been
reported by Storm et al. (2012) and Chagunda (2013). Generally, the high costs involved and the complexity of these techniques limit their applicability on a large scale (Table 1). Also it is important to examine critically the measurement methods used when evaluating mitigation dietary strategies.
Table 1 strengths and weaknesses of in vivo methane measuring techniques in dairy cows
Type of technique Strengths Weaknesses
Gold standard reference method: respiration chambers Storm et al. (2012)
Ambient environment can be controlled; reliability and stability of instruments can be measured; controlled feed intake; measurements in kinetics.
Animal behaviour not natural; results cannot be applied to free ranging animals; expensive so low replication.
SF6 tracer technique
Storm et al. (2012)
Ability to investigate energy efficiency in free ranging animals;
SF6 gas is cheap and has extremely
low detection limit is simple to analyse; Nearly all aspects of feeding and nutrition (e.g. level of feeding, different additives and grazing) can be investigated.
Determination of CH4 emission
dynamics is debatable; variable SF6
release rate from permeation tubes; within and between animal variations; Needs a lab and high laboratory skills.
GreenFeedTM (C-lock Inc., USA) (Source INRA document)
Can measure CH4 production on a
large number of cows (N = 20) in loose housing simultaneously over a period of several weeks or months. The system is mobile and can be used in experimental or commercial farms. Real-time measurements useful on farm scale.
Only measures CH4 emissions when
the animals have their heads in the feeder and are eating. At least 50 green feed are available in the world now.
Laser CH4 detector
Chagunda (2013)
Detects CH4 within a mix of other
gases with high specificity; non-invasive and non-contact technique; real-time measurements useful on farm scale; portable piece of equipment and can be used at the farm scale in theory.
As analysis is based on real-time breath it is not clear whether fluctuations that arise are due to biomechanics of breathing or equipment fluctuations; in grazing environment wind speed, wind direction, relative humidity and pressure have significant (P<0.0001) effects on resultant concentration of CH4 . Calculationsto estimate CH4
emissions from CH4 concentrations
are not clear. More tests needed as there is only one publication.
2.3 Lipid metabolism in the rumen
VFA (mainly acetate, propionate and butyrate) produced in the rumen are then absorbed through the rumen epithelium into blood plasma for utilisation by the periphery tissues and organs (Boadi et al., 2004). During absorption through the rumen epithelium, butyric acid is
5
predominantly converted to β-hydroxybutyrate (Bauman et al., 2011) and used in combination with acetic acid as precursors for de novo fatty acid synthesis in the mammary gland (Månsson, 2008).
Dietary lipids are essentially composed of triacylglycerides (TAG), phospholipids, and glycolipids (Shingfield et al., 2010). After ingestion, they are hydrolysed to non-esterified fatty acids (NEFA) by the action of bacteria lipases and released in the rumen where they are adsorbed onto feed particles and biohydrogenated or incorporated into bacterial lipids. (Shingfield et al., 2010). Ruminant diets often are poor in lipids but contain a high proportion of unsaturated fatty acids (UFA); mainly cis-9 C18:1 (oleic acid, OA), cis-9 cis-12 C18:2 (linoleic acid, LA), cis-9 cis-12 cis-15 C18:3 (linolenic acid, LNA) (Buccioni et al., 2012)). The biohydrogenation of LA and LNA begins with the isomerisation of the cis-12 double bond, reduction to trans-11 C18:1 (vacenic acid, VA) and finally to C18:0 (stearic acid, SA) (Shingfield et al., 2010). Ruminal biohydrogenation of LA and LNA in most diets is 70% to 95% and 85% to 100% respectively, indicating that SA is the major FA leaving the rumen (Glasser et al., 2008). However, inclusion of fish or marine oils rich in polyunsaturated FA (PUFA) inhibits the complete biohydrogenation of C18 unsaturated FA leading to an increase in the amount of trans C18 intermediates leaving the rumen (Shingfield et al., 2010). Metabolism of OA results in the formation of oxygenated fatty acids (10-OH 18:0 and 10-O 18:0) and numerous trans-C18:1 intermediates with double bonds at position delta-6 to 16 (McKain et al., 2010). Also biohydrogenation of OA to SA has been reported by (Harfoot and Hazlewood, 1997); but this is lower (from 58% to 87%) than that observed for LA and LNA (Loor et al., 2005; Doreau et al., 2009).
Beside the biohydrogenation of dietary PUFA, Vlaeminck et al. (2006) outlined in detail microbial formation of OBCFA in the rumen. The precursors for linear odd-chain FA are propionate or valerate, whereas those of branched FA (iso and anteiso FA) are branched chain amino acids (isovaline, leucine and isoleucine) and branched short chain carboxylic acids (isobutyric, isovaleric and 2-methyl butyric acids, Fievez et al., 2012). Variations in OBCFA concentrations leaving the rumen reflect changes in the relative abundance and/or activities of specific bacterial population in the rumen (Vlaeminck et al., 2006). Thus an increased proportion of cellulotytic bacteria results in high iso-FA while an increased proportion of amylolytic bacteria enhance anteiso and linear odd-chain FA (Tajima et al., 2001).
6
2.4 Lipid metabolism in the mammary gland
In ruminants, FA secreted into milk have double origins: they are derived from either preformed FA from peripheral circulation (from adipose tissue mobilization or dietary origin) or FA synthesis in mammary secretory epithelial cells also known as de novo synthesis (Shingfield et al., 2010; Bauman et al., 2011). Mammary epithelial cells use acetate and β-hydroxybutyrate as substrates for de novo synthesis of even saturated FA (from 4 to 16 carbons) (Månsson, 2008). All of C4:0 to C12:0, about 95% of C14:0 and about half of C16:0 secreted in milk emanate from de novo FA synthesis whereas the remaining C16:0 and longer chain fatty acids (≥ 18 atoms of carbon) are derived from peripheral circulation (Chilliard et
al., 2000).
The triglycerides (TAG) are transported to the mammary gland into chylomicrons and very low-density lipoproteins (VLDL) through the blood (Shingfield et al., 2010). Within the capillary wall in the mammary gland, the enzyme lipoprotein lipase hydrolyses the VLDL TAG into glycerol and NEFA which are taken up by the mammary epithelial cell (Bauman et
al., 2011). Saturated FA entering into mammary epithelial cells can be desaturated by
stearyol-CoA desaturase (delta-9 desaturase) (Palmquist et al., 2005). Stearoyl and palmitoyl-CoA are the preferred substrates for delta-9 desaturase but C18:0 is the predominant precursor with OA as the corresponding product (Bernard et al., 2008). Also this desaturation is the principal source of cis-9 trans-11 Congugated LA (Rumenic acid, RA) in milk (Mosley et al., 2006).
Furthermore, endogenous chain elongation of propionyl-CoA as precursor leads to the formation of C5:0, C7:0, C9:0, and C11:0 in milk and these add up to the odd-chain FA C13:0, C15:0 and C17:0 transferred from the duodenum (Fievez et al., 2012). These odd-chain FA can further be desaturated by delta-9 desaturase, but only the conversion of C17:0 to cis-9 C17:1 seems quantitatively important (Fievez et al., 2012).
Thus the different pathways (de novo FA synthesis, uptake from circulation of long chain FA and desaturation) contribute to the FA pool of milk (Chilliard et al., 2000).
7
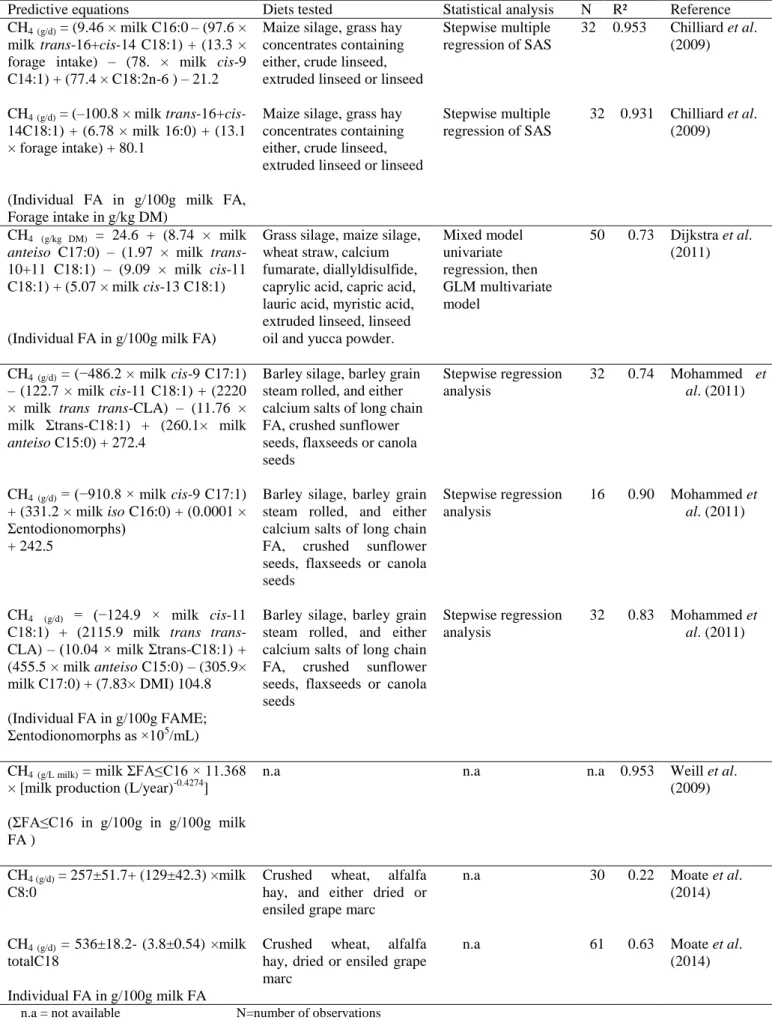
2.5 Relationships between milk fatty acid profiles and CH4 production in the rumen Chilliard et al. (2009) were the first authors to predict CH4 emissions (g/d) using individual
milk FA concentrations. These authors relied on 32 paired observations derived from 8 dairy cows, used according to 4 x 4 Latin square design, and receiving 4 dietary treatments which consisted of a maize silage-based control diet and 3 diets supplemented with linseed under different forms (whole crude seed, extruded seed and oil) to evaluate relations between milk FA and measured CH4 emissions. Stepwise multiple regression analysis was performed to
describe CH4 emissions from a combination of dietary intake components, milk yield and
composition, and milk FA concentrations. Two high predictive equations were proposed and containing milk FA concentrations (cis-9 C14:1, C16:0, trans-16+cis-14 C18:1, and C18:2n-6) and forage intake (Table 2). The forage intake estimates the part of the organic matter fermented in the rumen that leads to the acetate-CH4 pathway. The milk C16:0 is a main de
novo synthesised FA (acetate being the precursor). Moreover, trans-16+cis-14C18:1 is an
intermediate of LA ruminal biohydrogenation, and C18:2n-6 is the main dietary FA of maize silage. However, the contribution of cis-9 C14:1 was rather unexpected (Chilliard et al., 2009). A second equation (equation 2, Table 2) was thus developed excluding the latter two FA, and this slightly decreased the R2 value of the prediction compared with the first equation (0.953 to 0.931).
Although Chilliard et al. (2009) concluded that the predictive equations established in their study are valid only for diets supplemented with linseed, Moate et al. (2014) using data from dairy cows that were fed grape marc (rich in PUFA; LA) supported the findings of Chilliard et
al. (2009). They found a strong negative correlation (R²=0.63; equation 9 Table 2) between
CH4 emissions and the concentration of milk total C18 (Moate et al., 2014). A combination of
the data from Chilliard et al. (2009) and that of Moate et al. (2014) improved the R² value of total C18 (R² = 0.81). Moate et al. (2014) concluded that the findings of Chilliard et al. (2009) can as well be extended to diets containing grape marc a feedstuff rich in LA instead of LNA as occurs in linseed.
Mohammed et al. (2011) studied the relationships between CH4 emissions and milk FA
concentrations from an experiment with 16 lactating Holstein cows offered a control diet with calcium salts of palm oil, and diets supplemented with sunflower seed, linseed and canola seed during four 28-day periods used according to a 4 x 4 Latin square design. Oilseeds were added to diets to provide 33g added fat /kg DM. Different predictive equations were
8
developed from only milk FA concentrations (equation 4, Table 2), milk FA combined with rumen endodiniomorph concentrations (equation 5, Table 2) and milk FA combined with DM intake, and rumen endodiniomorph concentrations, (equation 6, Table 2). The authors found a negative relationship between CH4 and cis-9 C17:1, cis-11 C18:1 and sum of trans-C18:1
while a positive relationship was found between CH4 and trans, trans CLA and anteiso C15:0.
The negative relationship between cis-9 C17:1 and CH4 were expected as it is a product from
the desaturation of C17:0 (Microbial origin) whose precursor is propionate and propionogenesis is negatively related to CH4 production (Fievez et al., 2003). The inclusion
of cis-11 C18:1, sum of trans-C18:1 and trans, trans CLA in the equation can also be ascribed to biohydrogenation intermediates of PUFA.
The best equation developed by Mohammed et al. (2011) was the one including milk FA, and rumen protozoa concentration (equation 5, Table 2) in the analysis. The positive correlation observed between CH4 emissions and total entodionomorph concentration was likened to the
symbiotic association between methanogens and protozoa (Tokura et al., 1997). Thus, a lower CH4 production would be associated to lower total protozoal counts. However, in the
experiments from which this relationship was observed (Beauchemin et al., 2009), sunflower seed diet induced lower protozoa concentration than flaxseed diet (-38% and -23% relative to control diet, respectively) but higher CH4 emissions (18% and 10% relative to control diet,
respectively). In a recent meta-analysis approach Guyader et al., (2014), 21% of the experiments used reported variations in CH4 emission without changes in protozoa
concentration. This indicates that rumen protozoa concentration is not a strong predictor of CH4 emissions under conditions where a decrease in protozoa concentration is not associated
with a corresponding decrease in CH4 emissions.
Mohammed et al. (2011) also estimated CH4 using both equations 1 and 2 of Chilliard et al.
(2009) and found both equations to over-predict CH4 emissions in dairy cows by 61% and
21% respectively. This low prediction result in this study is attributed to the lack of correlations between CH4 and the milk FA used by Chilliard et al. (2009) in their equations.
Dijkstra et al. (2011) developed a multivariate model using data from 3 experiments with a total of 10 dietary treatments and 50 observations. Dietary treatments were supplemented with calcium fumarate, diallyldisulfide, caprylic acid, capric acid, lauric acid, myristic acid, extruded linseed, linseed oil and yucca powder.
9
The positive relationship between anteiso C17:0 and CH4 (equation 3, table 2) was attributed
to the negative and positive correlations of this FA with dietary crude protein (CP) and fibre, respectively (Cabrita et al., 2003). The fermentation of protein is associated with lower CH4
production, whereas the inverse was observed with fibre fermentation (Bannink et al., 2008). Thus a higher milk anteiso C17:0 concentrations imply more CH4 emission. The milk
trans-10+11 C18:1 are a biohydrogenation intermediate of LA. The concentration of trans10 C18:1 is increased if the starch content in the diet is high. The isomers cis (11 and 13) of C18:1 are originated from ruminal biohydrogenation from dietary PUFA.
When Mohammed et al., (2011) used the CH4 prediction equation developed by Dijkstra et al.
(2011) involving the variables 17:0 anteiso, t10- + t11-18:1, c11-18:1 and c13-18:1, this equation resulted in 19% over-prediction of CH4 emissions in this study. This could be
attributed to the lack of correlations between CH4 and the variables described above in the
study of Mohammed et al. (2011). Although the number of data (n = 50) from 3 studies in the data analysis of Dijkstra et al. (2011) is relatively important, there is not enough variations in composition of diet, proportions of dietary forage and concentrate, type of supplements which may allow application of the equation to other diets. Thus more data are needed to confirm relationships between milk FA concentrations and CH4 production for a wide range
of dietary conditions.
Finally, Weill et al. (2009) reported a predictive equation (equation 7, Table 2) for CH4
emissions based on the sum of FA shorter than 16 carbons (FA ≤ C16). Knowing that milk FA ≤ C16 are de novo synthesized in the mammary gland from acetate (Bauman and Griinari, 2003), de novo synthesized FA seem be a good predictor of CH4 emissions since acetate is
positively related to enteric CH4 production;
All of the above studies showed relationship between measured CH4 emissions and milk FA.
On the other hand, Vlaeminck and Fievez (2005) developed a predictive model to relate milk OBCFA to estimated CH4 emissions. They found a higher potential of milk OBCFA to
predict CH4 emissions due to their strong link to individual molar proportions of VFA in the
rumen. In their model, milk concentrations of C15:0 and iso C15:0 were found to be negatively and positively related to calculated CH4 proportions, respectively.
10
Table 2 Different predictive equations for CH4 emission in dairy cows
Predictive equations Diets tested Statistical analysis N R² Reference
1 CH4(g/d) = (9.46 × milk C16:0– (97.6 ×
milk trans-16+cis-14 C18:1) + (13.3 × forage intake) – (78. × milk cis-9 C14:1) + (77.4 × C18:2n-6 ) – 21.2
Maize silage, grass hay concentrates containing either, crude linseed, extruded linseed or linseed
Stepwise multiple regression of SAS 32 0.953 Chilliard et al. (2009) 2 CH4(g/d) = (–100.8 × milk trans-16+cis-14C18:1) + (6.78 × milk 16:0) + (13.1 × forage intake) + 80.1
(Individual FA in g/100g milk FA, Forage intake in g/kg DM)
Maize silage, grass hay concentrates containing either, crude linseed, extruded linseed or linseed
Stepwise multiple regression of SAS
32 0.931 Chilliard et al. (2009)
3 CH4 (g/kg DM) = 24.6 + (8.74 × milk
anteiso C17:0) – (1.97 × milk
trans-10+11 C18:1) – (9.09 × milk cis-11 C18:1) + (5.07 × milk cis-13 C18:1)
(Individual FA in g/100g milk FA)
Grass silage, maize silage, wheat straw, calcium fumarate, diallyldisulfide, caprylic acid, capric acid, lauric acid, myristic acid, extruded linseed, linseed oil and yucca powder.
Mixed model univariate regression, then GLM multivariate model 50 0.73 Dijkstra et al. (2011) 4 CH4(g/d) = (−486.2 × milk cis-9 C17:1) – (122.7 × milk cis-11 C18:1) + (2220 × milk trans trans-CLA) – (11.76 × milk Σtrans-C18:1) + (260.1× milk
anteiso C15:0) + 272.4
Barley silage, barley grain steam rolled, and either calcium salts of long chain FA, crushed sunflower seeds, flaxseeds or canola seeds Stepwise regression analysis 32 0.74 Mohammed et al. (2011) 5 CH4(g/d) = (−910.8 × milk cis-9 C17:1) + (331.2 × milk iso C16:0) + (0.0001 × Σentodionomorphs) + 242.5
Barley silage, barley grain steam rolled, and either calcium salts of long chain
FA, crushed sunflower
seeds, flaxseeds or canola seeds Stepwise regression analysis 16 0.90 Mohammed et al. (2011) 6 CH4 (g/d) = (−124.9 × milk cis-11
C18:1) + (2115.9 milk trans trans-CLA) – (10.04 × milk Σtrans-C18:1) + (455.5 × milk anteiso C15:0) – (305.9× milk C17:0) + (7.83× DMI) 104.8 (Individual FA in g/100g FAME;
Σentodionomorphs as ×105
/mL)
Barley silage, barley grain steam rolled, and either calcium salts of long chain
FA, crushed sunflower
seeds, flaxseeds or canola seeds
Stepwise regression analysis
32 0.83 Mohammed et
al. (2011)
7 CH4(g/L milk) = milk ΣFA≤C16 × 11.368
× [milk production (L/year)-0.4274]
n.a n.a n.a 0.953 Weill et al.
(2009) (ΣFA≤C16 in g/100g in g/100g milk
FA )
8 CH4 (g/d) = 257±51.7+ (129±42.3) ×milk
C8:0
Crushed wheat, alfalfa
hay, and either dried or ensiled grape marc
n.a 30 0.22 Moate et al.
(2014)
9 CH4 (g/d) = 536±18.2- (3.8±0.54) ×milk
totalC18
Crushed wheat, alfalfa
hay, dried or ensiled grape marc
n.a 61 0.63 Moate et al.
(2014) Individual FA in g/100g milk FA
11
In addition to these two FA, Montaya et al. (2011) included iso C14:0 and iso C16:0 (positively related), C15:0 and sum of C17:0 and C17:1 cis-9 (negatively related) as relevant predictors of calculated CH4 proportions in a three model approach (R² ranged from 0.63 to
0.66). Conversely, Dijkstra et al. (2011) found no relationship between C15:0 and CH4
emissions while C17:0 tended to be positively related to CH4 emissions. Differences across
studies can be related to variation in size and unevenness of datasets.
2.6 Objectives of Internship
Among studies relating milk FA to direct enteric CH4 measurements, Dijkstra et al. (2011)
were the only ones that considered multiple experiments with diverse dietary treatments. This is however, limited to diets differing only in nature and amount of FA. Therefore the aim of this work was to evaluate relationships between CH4 emission and milk FA in dairy cows
under various nutritional conditions and to develop a more general predictive equation from multiple studies of literature. This was done in silico by:
i. Creating a database from the bibliography that reported measured CH4 emission and
milk FA composition in the same group of dairy cows.
ii. Analysing the dataset of the database in order to validate new and existing models for predicting CH4 emissions under various nutritional situations.
3 MATERIALS AND METHODS 3.1 Selection of publications
Only publications reporting in vivo data of both CH4 emission and milk FA profile on the
same group of animals were included in the database. Publications were obtained from bibliographical databases of editorial platforms (ISI Web of Science, PubMed and Google scholar) using “in vivo’’, “methane” and “milk fatty acids” as keywords. An experiment was defined as one control treatment and at least one experimental treatment testing one or more dietary CH4 mitigation strategies with the same basal diet. Publications obtained included
experiments on both dairy goats and dairy cows. With the view that there are some differences in between the concentrations of milk FA in dairy goats and cows (Chilliard et al., 2007) and due to the big differences observed in CH4 emissions (g/d) between cows and
12
fourteen publications on dairy cows, comprising 15 experiments (Nexp) with a total of 44 treatments (Nt).
3.2 Creating the data base
Following the selection of publications, the information collected was organised and grouped under different headings. These included quantitative data on: animal (days in milk, body weight), diet (chemical and ingredient composition), rumen fermentation (pH and VFA concentrations), CH4 production (g/d, MJ/d, g/kg DMI, g/kg milk, and %GEI), apparent total
tract digestibility, milk production (yield, fat and protein percents) and milk fatty acids concentrations. Qualitative data on experimental protocol (design and treatment), animal species and techniques for measuring CH4 emissions and milk FA, were also added to the data
base.
3.3 Data entry and verification
The information collected from all publications under the different headings was entered into a Microsoft Office Excel 2010 file. In order to obtain more information as possible it was necessary to perform some calculations. For instance, in some experiments where chemical compositions of only diet components were given, calculations were done to obtain the chemical composition of the diet. Also unit conversion of certain measurements (e.g. CH4 g/d
= CH4 L/d * 0.714) were done to ensure homogeneity in data. Sums of milk FA were
calculated from individual FA given in each publication to ensure that the same FA were included in the different sums. Also to understand and verify the data entered, a supplementary excel sheet was created for each publication showing how the calculated values were obtained.
3.4 Coding of experiments
First, each publication was coded as “reference” with unique whole numbers from 1 to 15. In the case where a publication presented more than one experiment, a number was (1, 2, etc…) added in order to properly differentiate them.
A second level of encoding was to classify experiments into two categories according to lipid and non-lipid supplementation. The group “lipid” (Nexp = 11, Nt =24) consisted of experiments testing effects of various fatty acids (lauric acid, myristic acid, stearic acid) and
13
fatty acid sources (algal meal, linseed, coconut oil, soya bean oil, sunflower seeds, flax seeds, cotton seeds and canola seeds ) on CH4 emission. The group “non-lipid” (Nexp = 6, Nt =17)
consisted of experiments testing essential oils (Origanum vulgare leaves), chemical additives (monensin), yeast (Saccharomyces cerevisiae), and forage type (maize silage and grass silage). One experiment that tested grape marc containing both lipid and non-lipid compounds was included in both categories.
Experiments were further coded according to the classes of lipid and non-lipid supplements. The group “lipid-saturated fatty acids” (Nexp = 5, Nt =14) tested lauric acid, myristic acid, stearic acid, coconut oil, and a combination of lauric acid, myristic and linseed oil. The group “lipid-unsaturated fatty acids” (Nexp = 7, Nt =22) supplemented algal meal, linseed, soya bean oil, sunflower seeds, flax seeds, cotton seeds, canola seeds and grape marc. One experiment that tested a mixture of both saturated (lauric acid, myristic acid) and unsaturated fatty acid (linseed oil) in equal proportions was classified under both groups. Experiments under “non-lipid chemical” (Nexp = 3, Nt =7) tested chemical compounds (monensin and grape marc) whereas the group “non-lipid other” (Nexp = 3, Nt =10) consisted of experiments testing essential oils (Origanum vulgare leaves), yeast (Saccharomyces cerevisiae), and type of forage (maize silage and grass silage).
3.5 Meta-analysis
The data created was subsequently exported to Minitab (version 15) for analysis. In order to explore the relationships between CH4 and milk fatty acids, various approaches were taken.
Three units of CH4 measurements (CH4 g/d, CH4 g/kg DMI and CH4 g/kg milk) were chosen
for this. Firstly, global correlation was calculated using all treatments irrespective of the experiment. Secondly, correlations that were significant (P < 0.05) and with an absolute value of 0.4and above (|-0.4| ≤ r ≤ |-1|) where kept for further analysis. Descriptive statistics of the remaining data were obtained and when the number of treatments is below 10, the data was discarded. Thirdly, with the remaining data, scatter plot diagrams with CH4 on the ordinate
and individual milk FA concentration (% of milk FA) on abscissa were made. From the scatter plot, one experiment (Moate et al., 2013) was excluded as it presented a high leverage effect and then the above steps were repeated.
14
An analysis of variance-covariance with general linear model (GLM) was performed in order to first relate the within experiment variations of CH4 and milk FA as a function of the
identifier “reference” established during coding. Graphs were also plotted to show this relationship. This step was repeated but this time with the experimental factor (“lipid” or “non-lipid”) as a function.
4 RESULTS
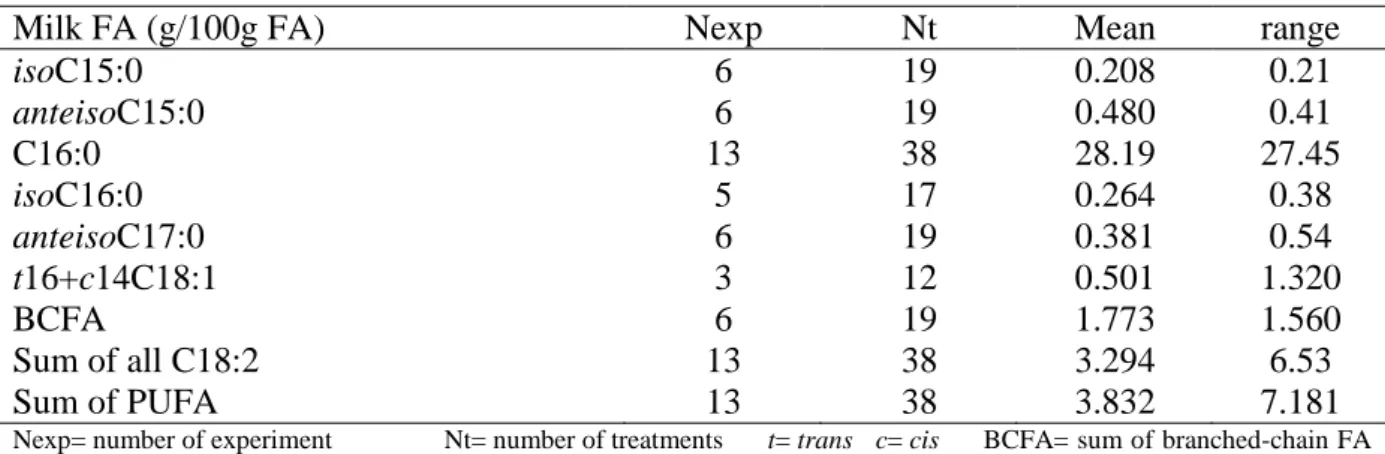
Descriptive statistics for the database using milk FA that showed significant correlation with CH4 emissions are given in Table 3.
Table 3 Summary descriptive statistics of selected milk FA in the database used for analysis
Milk FA (g/100g FA) Nexp Nt Mean range
isoC15:0 6 19 0.208 0.21 anteisoC15:0 6 19 0.480 0.41 C16:0 13 38 28.19 27.45 isoC16:0 5 17 0.264 0.38 anteisoC17:0 6 19 0.381 0.54 t16+c14C18:1 3 12 0.501 1.320 BCFA 6 19 1.773 1.560 Sum of all C18:2 13 38 3.294 6.53 Sum of PUFA 13 38 3.832 7.181
Nexp= number of experiment Nt= number of treatments t= trans c= cis BCFA= sum of branched-chain FA
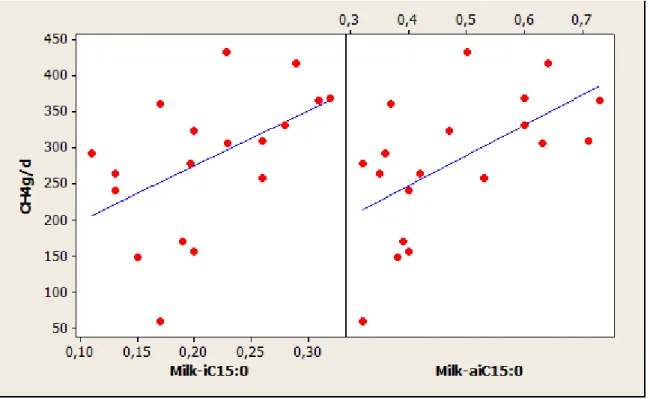
Table 4 reports the correlation coefficients between these milk FA and CH4 emissions
expressed in g/d, g/kg DMI and g/kg milk. The milk isoC15:0 (P= 0.025) and anteisoC15:0 (P= 0.008) were only positively correlated with CH4 g/d. Milk C16:0 only showed significant
and slight positive correlation (P= 0.021) with CH4 g/kg milk. Milk isoC16:0 showed the
strongest positive correlation whatever the units of CH4 emissions used (Table 4). Milk
anteisoC17:0 had also positive correlation coefficients (r ≥ 0.60) with CH4 emissions
(expressed as g/d, g/kg DMI or g/kg milk). Milk t16+c14C18:1 had the highest negative correlation coefficient with CH4 emissions (g/d or g/kg DMI). The sum of all C18:2 FA and
the sum of PUFA were negatively correlated with CH4 g/d (P= 0.012 and 0.005, respectively)
15
Table 4 Correlation coefficients1 between milk FA content and the CH4 emissions expressed
in g/d, g/kg DMI and g/kg milk
Milk FA (g/100g FA) CH4 g/d CH4 g/kg DMI CH4 g/kg milk
r P r P r P isoC15:0 0.513 0.025 anteisoC15:0 0.589 0.008 C16:0 0.372 0.021 isoC16:0 0.778 0.000 0.77 0.000 0.788 0.000 anteisoC17:0 0.592 0.008 0.609 0.006 0.672 0.002 t16+c14C18:1 -0.724 0.008 -0.681 0.015 BCFA 0.539 0.017 0.474 0.040 0.550 0.015 Sum of all C18:2 -0.403 0.012 -0.422 0.008 Sum of PUFA -0.442 0.005 -0.463 0.003 1
only correlations |-0.4| ≤ r ≤ |-1| (P < 0.05) Sum of PUFA= sum of all polyunsaturated FA Sum of all C18:2 = sum of all Conjugated and non-conjugated C18:2
BCFA= sum of all branched-chain FA
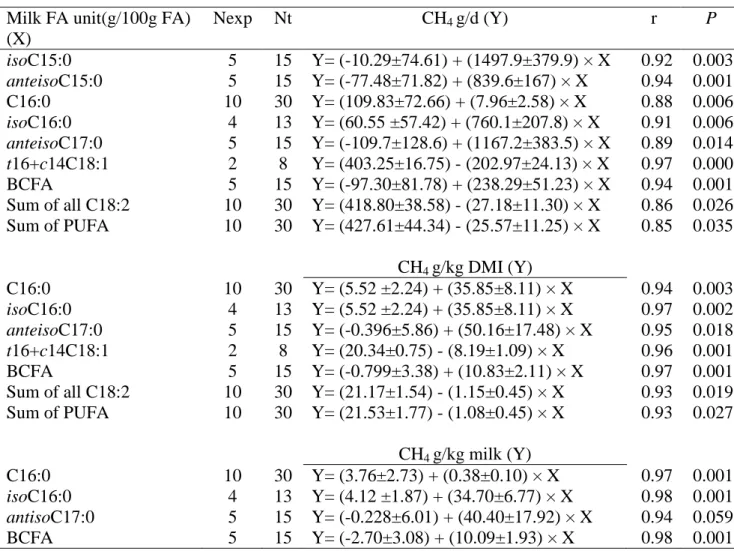
Table 5 General linear model results for the relation between CH4 emissions and milk FA
content taking into account experimental effect Milk FA (g/100g FA) (X) Nexp Nt CH4 g/d (Y) r P isoC15:0 6 19 Y = (2.72±65.46) + (1381.7±313.5) × X 0.83 0.001 anteisoC15:0 6 19 Y= (-58.16±73.20) + (742.8±155.9) × X 0.93 0.000 C16:0 13 38 Y= (99.02±66.83) + (8.20±2.35) × X 0.89 0.002 isoC16:0 5 17 Y= (78.35 ±48.60) + (728.3±173.7) × X 0.91 0.002 anteisoC17:0 6 19 Y = (68.7±118.5) + (587±315.9) × X 0.83 0.088 t16+c14C18:1 3 12 Y= (397.88±14.76) - (199.96±25.41) × X 0.95 0.000 BCFA 6 19 Y= (-103.53±78.4) + (226.48±45.08) × X 0.93 0.000 Sum of all C18:2 13 38 Y= (419.95±33.7) - (28.62±10.21) × X 0.87 0.010 Sum of PUFA 13 38 Y= (427.72±38.64) - (26.68±10.15) × X 0.87 0.015 CH4 g/kg DMI (Y) C16:0 13 38 Y= (7.65 ±2.62) + (0.35±0.09) × X 0.96 0.001 isoC16:0 5 17 Y= (6.4 ±1.93) + (34.37±6.89) × X 0.97 0.000 anteisoC17:0 6 19 Y= (7.12±5.29) + (25.62±14.11) × X 0.92 0.094 t16+c14C18:1 3 12 Y= (20.50±0.66) - (8.12±1.14) × X 0.95 0.000 BCFA 6 19 Y= (-1.29±3.23) + (10.34±1.86) × X 0.97 0.000 Sum of all C18:2 13 38 Y= (21.37±1.35) - (1.21±0.41) × X 0.95 0.007 Sum of PUFA 13 38 Y= (21.68±1.55) - (1.12±0.41) × X 0.95 0.011 CH4 g/kg milk (Y) C16:0 13 38 Y= (2.54±2.56) + (0.39±0.09) × X 0.97 0.000 isoC16:0 5 17 Y= (4.27 ±1.58) + (33.34±5.63) × X 0.98 0.000 anteisoC17:0 6 19 Y= (6.45±5.14) + (18.18±13.71) × X 0.92 0.209 BCFA 6 19 Y= (-2.90±3.15) + (9.34±1.82) × X 0.97 0.000
16
Tables 5, 6 and 7 show the GLM results for the relation between CH4 emissions and milk FA
taking into account the effects of experiment, experimental factors “lipid supplementation” and “non-lipid supplementation” respectively. For BCFA, correlation between milk-isoC16: 0 and CH4 in g/kg milk (r= 0.79, P= 0.000) was the strongest while the weakest correlation (r=
0.51, P= 0.025) was observed between milk-isoC15:0 and CH4 emission in g/d (Table 4). By
integrating the experiment effect and lipid supplementation factors, milk-anteisoC15: 0, had the highest correlation coefficient (r= 0.93, P= 0.000 and r= 0.94, P= 0.001, respectively) with CH4 (g/d).
Table 6 General linear model results for the relation between CH4 emission and milk FA
content for experiments with lipid supplementation of the diet Milk FA unit(g/100g FA)
(X) Nexp Nt CH4 g/d (Y) r P isoC15:0 5 15 Y= (-10.29±74.61) + (1497.9±379.9) × X 0.92 0.003 anteisoC15:0 5 15 Y= (-77.48±71.82) + (839.6±167) × X 0.94 0.001 C16:0 10 30 Y= (109.83±72.66) + (7.96±2.58) × X 0.88 0.006 isoC16:0 4 13 Y= (60.55 ±57.42) + (760.1±207.8) × X 0.91 0.006 anteisoC17:0 5 15 Y= (-109.7±128.6) + (1167.2±383.5) × X 0.89 0.014 t16+c14C18:1 2 8 Y= (403.25±16.75) - (202.97±24.13) × X 0.97 0.000 BCFA 5 15 Y= (-97.30±81.78) + (238.29±51.23) × X 0.94 0.001 Sum of all C18:2 10 30 Y= (418.80±38.58) - (27.18±11.30) × X 0.86 0.026 Sum of PUFA 10 30 Y= (427.61±44.34) - (25.57±11.25) × X 0.85 0.035 CH4 g/kg DMI (Y) C16:0 10 30 Y= (5.52 ±2.24) + (35.85±8.11) × X 0.94 0.003 isoC16:0 4 13 Y= (5.52 ±2.24) + (35.85±8.11) × X 0.97 0.002 anteisoC17:0 5 15 Y= (-0.396±5.86) + (50.16±17.48) × X 0.95 0.018 t16+c14C18:1 2 8 Y= (20.34±0.75) - (8.19±1.09) × X 0.96 0.001 BCFA 5 15 Y= (-0.799±3.38) + (10.83±2.11) × X 0.97 0.001 Sum of all C18:2 10 30 Y= (21.17±1.54) - (1.15±0.45) × X 0.93 0.019 Sum of PUFA 10 30 Y= (21.53±1.77) - (1.08±0.45) × X 0.93 0.027 CH4 g/kg milk (Y) C16:0 10 30 Y= (3.76±2.73) + (0.38±0.10) × X 0.97 0.001 isoC16:0 4 13 Y= (4.12 ±1.87) + (34.70±6.77) × X 0.98 0.001 antisoC17:0 5 15 Y= (-0.228±6.01) + (40.40±17.92) × X 0.94 0.059 BCFA 5 15 Y= (-2.70±3.08) + (10.09±1.93) × X 0.98 0.001
Milk anteisoC17:0 tended to be positively related to CH4 in g/d (P=0.088) and CH4 in g/kg
DMI (P=0.094) when experiment effect was integrated in the model (Table 5) but showed significant relation to CH4 in g/d (P= 0.014) and CH4 in g/kg DMI (P = 0.018) when the
17
between CH4 emissions and test variables were stronger when experiment effect, lipid and
non-lipid supplementation factors were taken into account compared with the global approach.
Table 7 General linear model results for the relation between CH4 emission and milk FA
content for experiments without lipid supplementation of the diet Milk FA (g/100g FA) (X) Nexp Nt CH4 g/d (Y) r P C16:0 4 11 Y= (169.17±75.61) + (5.81±2.44) × X 0.95 0.055 Sum of all C18:2 4 11 Y= (407.42±30.74) - (19.10±9.15) × X 0.94 0.082 Sum of PUFA 4 11 Y= (412.61±35.13) - (17.97±9.18) × X 0.94 0.098 CH4 g/kg DMI (Y) C16:0 4 11 Y= (8.76±3.10) + (0.34±0.10) × X 0.99 0.015 Sum of all C18:2 4 11 Y= (22.61±1.33) - (1.11±0.39) × X 0.98 0.030 Sum of PUFA 4 11 Y= (22.94±1.53) - (1.06±0.40) × X 0.98 0.039 CH4 g/kg milk (Y) C16:0 4 11 Y= (-0.43±4.06) + (0.55±0.13) × X 0.99 0.006 5 DISCUSSION
The best correlations between CH4 emissions and milk FA were obtained with BCFA (iso15
anteiso15, iso16 and anteiso17), C16:0 and intermediates of ruminal biohydogenation (t16 +
c14-C18: 1, sum of all C18: 2, sum of PUFA).
5.1 Milk branched – chain fatty acids (BCFA)
Most of the milk FA that were related to CH4 emissions were branched-chain FA (isoC15:0,
anteisoC15:0, isoC16:0 and anteisoC17:0) and their sum (BCFA). Generally correlations
between CH4 emissions and test variables were stronger with the integration of experiment
and lipid supplementation effects when compared to the global approach. This shows that the prediction of CH4 emissions by these FA is diet dependent. However, these relations were
removed when taking into account non-lipid supplementation because only one experiment with non-lipid supplementation reported these FA (Appendix figures 9, 12 and 15).
Vlaeminck and Fievez (2005) were the first to demonstrate the potential of milk OBCFA in predicting CH4 emissions and this was subsequently affirmed by (Montaya et al., 2011) but in
18
concentrations. That notwithstanding, later studies that related measured CH4 emissions to
milk FA in dairy cows used these group of milk FA in their predictive equations (Dijkstra et
al., 2011; Mohammed et al., 2011). The positive correlations between isoC15:0, isoC16:0 and
CH4 emissions corroborate earlier reports (Vlaeminck and Fievez, 2005; Montoya et al.,
2011). Similarly in the best equation developed by Mohammed et al. (2011), milk isoC16:0 contributed to the prediction of CH4 emissions (equation 5, Table 2). This supports the
explanation that there is a strong relationship between calculated CH4 emissions and milk
OBCFA (Vlaeminck and Fievez 2005). It is well established that cellulolytic bacteria are enriched in high iso-FA and their activities are more favoured with a higher F:C (from 0.5 to 0.9 forage proportion) in the diet (Vlaeminck et al., 2006) which results in higher iso-FA in milk. Consequently the fibre degradation by cellulolytic bacteria produces more acetate as VFA and so more CH4 hence the positive relation.
Milk anteisoC17:0 tended to be related to CH4 emissions when experiment effect was
integrated but showed significant relation with CH4 emissions for diets with lipid
supplementation. This shows that prediction of CH4 emissions from this milk FA depends on
lipid supplementation and slightly on basal diet. Indeed, Dijkstra et al., (2011) reported
anteisoC17:0 as the major CH4 predictor in their predictive equation (equation 3 Table 2) in
case of the dietary supplements were mainly lipid.The positive relation between this FA and CH4 is explained by the negative relation with dietary CP content (14 to 17% of DM) and
positive relation with fibre content (NDF between 31 to 38% of DM) of the diet (Carbita et
al., 2003). Stoichiometrically, fermentation of fibre is associated with higher CH4 production
relative to protein fermentation (Bannink et al., 2008); which explains the positive relationship between this FA and CH4.
5.2 Milk C16:0
Although milk C16:0 showed only a slight positive correlation with CH4 g/kg when all
treatments were used, a special attention is made for this FA because its concentration in milk is important and it was also included in the predictive equations of Chilliard et al. (2009). When the experiment and lipid supplementation factor effects were incorporated, it had much larger correlation coefficients across all units of measurements of CH4 emissions. This shows
that the prediction of CH4 emissions from milk C16:0 is diet dependent. In all cases milk
19
C16:0 as a good predictor of CH4 emissions in their equations (equations 1 and 2, Table 2).
This FA is a main product from mammary de novo synthesis which is based primarily on acetate produced in the rumen during digestion of fibre (Chilliard et al., 2009). Acetate is known to be positively related to CH4 (Moss et al., 2000) which justifies the positive
relationship between this milk FA and CH4 emissions.
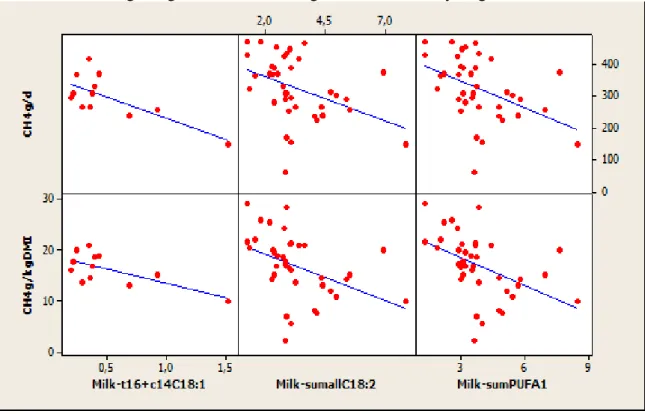
5.3 Intermediates of rumen biohydrogenation
The correlation coefficients of milk t16 + c14-C18: 1, sum of all C18: 2, sum of PUFA were improved when the effects of experiment, lipid and non-lipid supplementation were integrated in the data analysis. This shows the prediction of CH4 from these FA is diet dependent. The
negative relationship between these group of FA and CH4 emission is consistent with the
findings of Chilliard et al. (2009; equations 1 and 2 Table 2), Dijkstra et al. (2011; equation 3 Table 2) and Mohammed et al. (2011; equations 4 and 6 Table 2). Diets rich in PUFA contribute to a decrease in CH4 emissions through toxic effects on microbes producing H2
(protozoa, cellulolytic bacteria) and using H2 (methanogens) (Martin et al., 2010). In addition,
the CH4-suppressing effect of PUFA is due to intermediary products (such as isomers of milk
C18:1 and C18:2) resulting from biohydrogenation of these FA in the rumen (Mohammed et
al., 2011). This effect explains the negative relations observed between milk t16+ c14-C18: 1,
sum of all C18: 2, sum of PUFA and CH4 emissions.
6 CONCLUSION
Three groups of milk FA: BCFA, C16:0 and several intermediates of rumen biohydrogenation showed significant relationships with CH4 emissions in dairy cattle. BCFA and C16:0 were
positively related while the FA arising from ruminal biohydrogenation were negatively related to CH4 emissions. Milk FA better predicted CH4 emissions when experiment effect and lipid
supplementation factors were taken into account which means that prediction of CH4 from
these FA is diet dependent. Milk FA can be considered as good predictors of CH4 production
in dairy cattle but more data are needed in the database with a wide range of diets to confirm these predictions.
From the groups of milk FA above, C16:0 can be measured easily with infra-red spectrometry already implemented in laboratories of Milk Recording Organisation whereas BCFA and products of ruminal biohydrogenation analyses requires more time in research laboratories
20
implemented with chromatographic analysis. This presents a setback for the use of these groups of milk FA in predicting CH4 emissions.
In this study, a first statistical analysis was made but needs to be completed by taking into account interfering factors such as milk production, forage intake, nature of forage, type of lipid supplementation, protozoa concentrations, and VFA. This would enable all significant FA to be put in the same equation in order to class them in terms of importance.