Publisher’s version / Version de l'éditeur:
Vous avez des questions? Nous pouvons vous aider. Pour communiquer directement avec un auteur, consultez la première page de la revue dans laquelle son article a été publié afin de trouver ses coordonnées. Si vous n’arrivez pas à les repérer, communiquez avec nous à [email protected].
Questions? Contact the NRC Publications Archive team at
[email protected]. If you wish to email the authors directly, please see the first page of the publication for their contact information.
https://publications-cnrc.canada.ca/fra/droits
L’accès à ce site Web et l’utilisation de son contenu sont assujettis aux conditions présentées dans le site LISEZ CES CONDITIONS ATTENTIVEMENT AVANT D’UTILISER CE SITE WEB.
Canadian Acoustics, 27, September 3, pp. 56-57, 1999-09-01
READ THESE TERMS AND CONDITIONS CAREFULLY BEFORE USING THIS WEBSITE.
https://nrc-publications.canada.ca/eng/copyright
NRC Publications Archive Record / Notice des Archives des publications du CNRC :
https://nrc-publications.canada.ca/eng/view/object/?id=88baed79-2e4d-4ac6-82dd-cd5a38030474
https://publications-cnrc.canada.ca/fra/voir/objet/?id=88baed79-2e4d-4ac6-82dd-cd5a38030474
NRC Publications Archive
Archives des publications du CNRC
This publication could be one of several versions: author’s original, accepted manuscript or the publisher’s version. / La version de cette publication peut être l’une des suivantes : la version prépublication de l’auteur, la version acceptée du manuscrit ou la version de l’éditeur.
Access and use of this website and the material on it are subject to the Terms and Conditions set forth at
Measuring the in-situ airborne sound insulation using the acoustic
intensity technique
Measuring the in-situ airborne sound insulation using
the acoustic intensity technique
Nightingale, T.R.T.; Halliwell, R.E.
NRCC-43675
A version of this document is published in / Une version de ce document se trouve da
Canadian Acoustics, v. 27, no. 3, Sept. 1999, pp. 56-57
MEASURING THE IN-SITU AIRBORNE SOUND INSULATION
USING THE ACOUSTIC INTENSITY TECHNIQUE
T.R.T. Nightingale and R.E. Halliwell
Institute for Research in Construction, National Research Council, Ottawa, Ontario, Canada K1A OR6 Introduction
Currently, the ASTM and ISO standards organizations are writing standards to facilitate the measurement of airborne sound insulation using the acoustic intensity technique. Working groups in both organizations have nearly completed prescriptions for applying the technique under laboratory conditions where there is suppressed flanking transmission. Both standards organizations are now writing parts that describe methods for making in-situ measurements to allow the assessment of individual building elements in the field.
This paper will compare estimates of the in-situ transmission loss (TL) of an individual building element measured using the acoustic intensity technique and traditional two-room method (ASTM E336). These comparisons are used to show that the accuracy of TL measurements using the intensity technique are very sensitive to the presence of flanking transmission and reverberant energy in the receive room. In some cases it may be necessary to add absorption and shield flanking surfaces in the receive room in order to obtain reasonable TL estimates. This paper also shows that quality control indicators should be used to help assess the suitability of measurement conditions in the receive room.
Measurement Technique
The TL of a building element is defined as the ratio of the incident sound power on the element in the source room to the radiated sound power in the receive room. An estimate of the sound power radiated by a building element is obtained by measuring the acoustic intensity over a measurement surface that completely encloses it. The intensity may be sampled using either a series of discrete points or a scanning action. The radiated sound power is simply the intensity multiplied by the area of measurement surface. If the sound power radiated by each surface in the receive room is measured then it is possible to determine the dominant transmission paths as well as rank the individual flanking paths. The most common intensity probe (P-P type) uses two phase-matched microphones that are closely spaced to measure both the particle velocity and the acoustic pressure. The product of these two quantities is a vector: the acoustic intensity. The measured acoustic intensity is the resultant vector parallel to pick-up axis of the probe (i.e., the sum of the intensity flowing toward the probe minus the intensity flowing in the opposite direction).
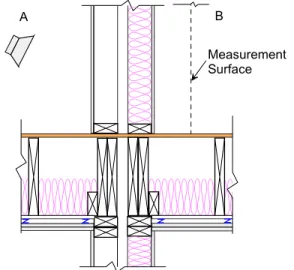
It is widely assumed that, since the probe measures a vector, the probe’s directional characteristic is sufficient to discriminate against adjacent radiating surfaces. This has lead to the misconception that accurate estimates of the TL for individual building elements can be obtained without special treatment(s) to the receive room. Often, this is not the case, especially for lightweight constructions. Significant difficulties can be encountered when measuring the intensity of a building element that is physically connected at right angles to another building element that is also radiating. An example is shown in Figure 1 where the continuous subfloor represents a flanking surface that is connected to the element under test; the partition wall.
Since, the partition wall is bounded on all four sides by reasonably rigid surfaces (ceiling, floor, and two walls) the measurement
surface would be a single planar surface. Typically, located about 150 mm from the partition wall as shown in Figure 1.
A B
Measurement Surface
Figure 1: Sketch showing the construction and the partition wall that was measured. Note the location of the measurement surface and the portion of the floor that is contained in the measurement volume. The measurement volume is the space defined by the specimen under test, the measurement surface and all bounding surfaces.
Measurement Precision
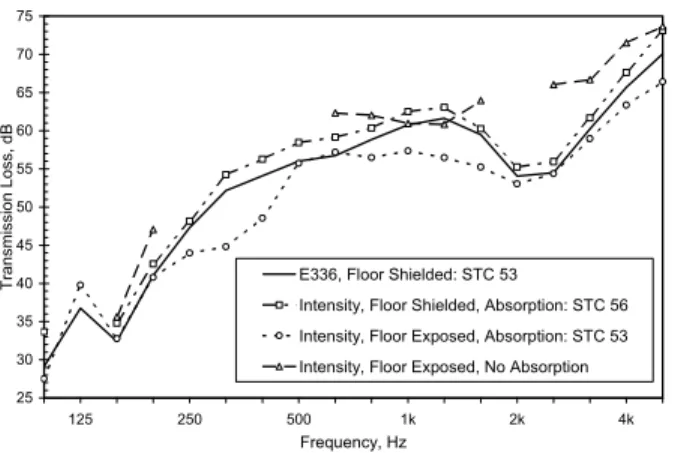
In this section the accuracy with which the intensity technique can reproduce the TL of the two-room technique (ASTM E336) is examined. From Figure 2, it is evident that treatments to the receive room (absorption and shielding of flanking surfaces) can significantly affect the TL estimate given by the intensity technique. These treatments are now discussed.
In general, flanking transmission will tend to increase the amount of reverberant energy in the receive room which is very undesirable. Depending on the amount of absorption in the receive room and the severity of the flanking transmission, it is possible that there can be more energy flowing toward the specimen under test than there is radiated by it, (i.e., flowing away from it). This situation typically results in the measurement of a negative intensity or greatly reduced positive intensity (where the sign indicates the direction of the intensity vector). Figure 2 shows this well, since the TL estimate for the partition wall measured with the floor exposed and no
absorption is considerably greater than that obtained using
ASTM E336. The TL can not be computed at frequencies at which the intensity is negative. This explains the missing data points in the figure.
Absorption can be placed in the receive room to reduce the amount of reverberant energy. Figure 2 shows that with the
floor exposed and absorption (25m2 of 25 mm thick open cell foam) added to the receive room the estimate of the TL changes radically. It changes from being a significant overestimation at most frequencies to being a significant underestimation. This change indicates the absorption effectively controlled the reverberant field, resulting in a more accurate estimate of the intensity flowing across the measurement surface.
25 30 35 40 45 50 55 60 65 70 75 125 250 500 1k 2k 4k Frequency, Hz Tr ansmi ssi on Loss, dB
E336, Floor Shielded: STC 53
Intensity, Floor Shielded, Absorption: STC 56 Intensity, Floor Exposed, Absorption: STC 53 Intensity, Floor Exposed, No Absorption
Figure 2: Measured in-situ transmission loss of the partition wall of Figure 1 using the intensity method and ASTM E336. (Measurements using ASTM E336 were conducted with the floor of the receive room shielded and other flanking paths suppressed). Data are not shown at frequencies where the acoustic intensity was negative, i.e., sound power was flowing into the wall.
Despite this apparent improvement in accuracy of the sound power estimate with the floor unshielded, the agreement between the TL reported by the two methods remains poor. The intensity technique significantly underestimates the TL at many frequencies. This underestimation can be explained by recognizing that a portion of the floor is contained in the volume formed by the measurement surface. Thus, the sound power measured by the probe will be the sum of two contributions: one from the wall and the other from the portion of the floor contained in the measurement volume. This leads to an overestimation of the sound power of the wall and an underestimation its TL. Thus, an accurate estimation of the sound power radiated by a building element can only be obtained if it is the only radiating surface contained in the measurement volume. For the situation shown in Figure 1, the portion of the floor contained inside the measurement volume must be shielded. Shielding in the form of 13-mm thick gypsum board over 50-mm fibrous material works very well.
With the floor shielded and absorption, the TL estimate obtained using the intensity technique approaches the TL measured using ASTM E336. The agreement is reasonable over most of the frequency range although there is a consistent overestimation. Quality Control Indicators
Draft standards produced by both organizations include indicators to help the operator judge the quality, and hence accuracy, of the TL estimates. These indicators will be briefly discussed and results presented for the cases with shielding and absorption and no
shielding and no absorption. The first indicator, FpI, assess the
amount of reverberant energy in the receive room. Reverberant energy should not be a problem if,
(
F
pI=
L
p−
L
I)
<
10 B
d
(1)where Lp and LI are the average measured pressure and intensity
over the measurement surface. The second indicator ensures that the measuring system (probe and analyzer) has sufficient dynamic capability for the receive room conditions. It requires that,
δ
pIo−
F
pI>
10 dB
(2)where δpIo is the pressure-residual intensity index. δpIo is defined as
the difference between the measured pressure and intensity when the probe is placed a sound field that has zero intensity. If the intensity was sampled at discrete points, then a third indicator,
CF4, can be used to determine if a sufficient number of sample
points were used to attain a prescribed degree of accuracy,
CF4<N (3)
where N is the number of measurement points used. A thorough definition of CF4, and degree of accuracy implied when
equation 3 is satisfied, is beyond the scope of this paper. The reader is referred elsewhere1.
From Figure 3 it is evident that with no shielding and no masking the receive room conditions are very unsuitable. The
FpI indicator is much greater than 10 dB suggesting that the field
is excessively reverberant, so much so that the measurement system has insufficient dynamic capability (i.e., δpIo-FpI<<10
dB) Finally, the CF4 indicator shows that many more points
were required than the 132 that were used. All indicators suggest the measurement should be discarded and the receive room treated.
With the floor shielded and absorption added to the receive room the quality control indicators improve significantly. From the change in FpI it is easy to see the improvement due to the
absorption. Ideally, FpI would be near zero which would occur
in a perfectly anechoic environment. More low frequency absorption should be added since the criterion is not satisfied in the 100 and 125 Hz one-third octave bands.
125 250 500 1000 2000 4000 -5 0 5 10 15 20 δpIo - F pI , [ d B ] Frequency, Hz 0 5 10 15 20 25 30 FpI , [d B ] 0 20 40 60 80 100 120 140
Shielding and Absorption No Shielding and No Absorption
CF 4 , [P o in ts]
Figure 3: Measured indicators for the cases with no shielding
and no absorption and shielding and absorption. The solid lines
are the pass-fail points for the three criteria (equations 1, 2, 3).
Conclusions
Flanking transmission, which is inevitable for in-situ measurements, will adversely affect the accuracy of the TL estimate. Significant amounts of absorption may have to be placed in the receive room to control the resulting reverberant field. Flanking surfaces must not be contained inside the measurement volume as this typically results in an underestimation of the TL. In many cases it may be necessary to shield the flanking surfaces. Quality control indicators can be used to determine when poor receive room conditions (excessive reverberation, insufficient dynamic capability, and insufficient measurement points) will affect the estimate of the TL.
References
1
ISO 9614-1, “Acoustics – Determination of sound power levels using noise sources using sound intensity,” Part 1: Measurement by discrete points, 1996.