Hemodynamic Optimization
HOW TO IMPLEMENT?
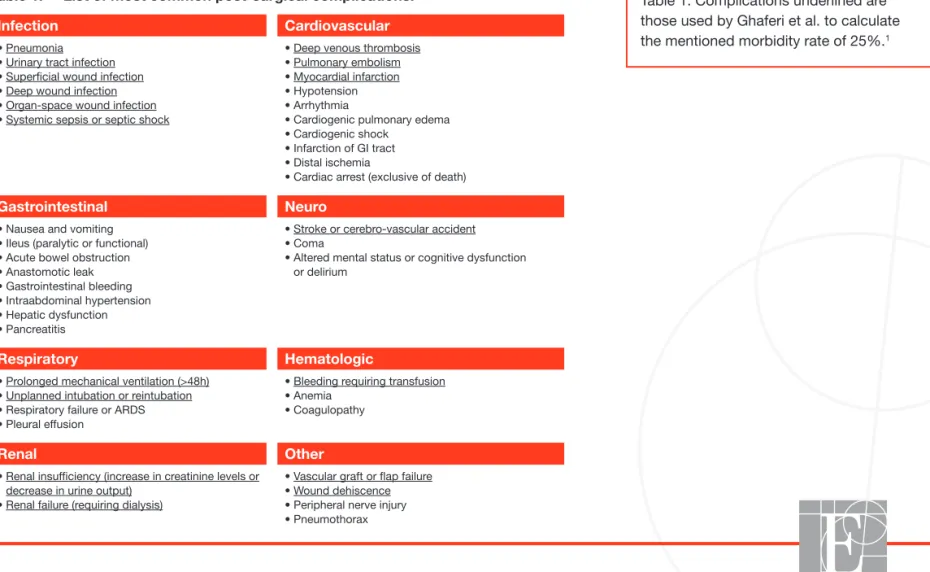
Table 1. Complications underlined are those used by Ghaferi et al. to calculate the mentioned morbidity rate of 25%.1
Why Hemodynamic Optimization?
Are post-surgical complications exceptions?
Patients undergoing surgery may develop post-surgical complications. The morbidity rate, defined as the proportion of patients developing at least 1 (1+) post-surgical complication, increases with co-morbidities (patient risk) and the complexity and duration of the surgical procedure (procedure risk). Morbidity rates are often underestimated by clinicians when not measured from objective data. The primary post-surgical complications are listed in Table 1. A study published in the New England Journal of Medicine in 2009 by Ghaferi et al.1 showed in over 80,000 patients
undergoing general and vascular surgery an average morbidity rate of 25%. Post-surgical complications are not exceptions.
Table 1: List of most common post-surgical complications.
Infection Cardiovascular
• Pneumonia • Urinary tract infection • Superficial wound infection • Deep wound infection • Organ-space wound infection • Systemic sepsis or septic shock
• Deep venous thrombosis • Pulmonary embolism • Myocardial infarction • Hypotension • Arrhythmia
• Cardiogenic pulmonary edema • Cardiogenic shock
• Infarction of GI tract • Distal ischemia
• Cardiac arrest (exclusive of death)
Gastrointestinal Neuro
• Nausea and vomiting • Ileus (paralytic or functional) • Acute bowel obstruction • Anastomotic leak • Gastrointestinal bleeding • Intraabdominal hypertension • Hepatic dysfunction • Pancreatitis
• Stroke or cerebro-vascular accident • Coma
• Altered mental status or cognitive dysfunction or delirium
Respiratory Hematologic
• Prolonged mechanical ventilation (>48h) • Unplanned intubation or reintubation • Respiratory failure or ARDS • Pleural effusion
• Bleeding requiring transfusion • Anemia
• Coagulopathy
Renal Other
• Renal insufficiency (increase in creatinine levels or decrease in urine output)
• Renal failure (requiring dialysis)
• Vascular graft or flap failure • Wound dehiscence • Peripheral nerve injury • Pneumothorax
Example 1: Calculation of your morbidity rate for a specific surgical population.
What are the clinical consequences of
post-surgical complications?
On a short-term basis, complications increase hospital length of stay and hospital readmission rates.2,3 On a long-term basis, complications do affect patients’ survival.
An 8-year follow-up study4 done in more than 100,000 surgical patients showed that
the most important determinant of post-surgical survival was the occurrence, within 30 days post-surgery, of any complication. Independent of preoperative patient risk, the occurrence of a complication reduced median patient long-term survival by 69%4.
What is the cost of post-surgical complications?
Treating complications has a cost. It is related to the specific therapies needed to treat the complication (e.g. antibiotic, reintervention, anticoagulation, etc.) and to additional lab tests and investigations often necessary, as well as prolonged hospital length of stay. In the US the average extra cost for treating a patient developing 1+ complication is approximately $18,000.2 Any complication-related increase in length of stay or
re-admission will also decrease your efficiency (i.e. the number of patients you can treat and the related revenues every year).
Example 1: If 200 patients had a
colorectal resection last year in your institution and 60 developed at least 1 complication (e.g. 12 patients a urinary tract infection, 11 a prolonged paralytic ileus, 10 a wound infection, 9 a hypotension, 7 a nosocomial pneumonia, 6 an acute renal insufficiency, 3 a myocardial infarction, 1 an anastomotic leak, and 1 a pulmonary embolism), your morbidity rate was 60/200 = 30%.
Morbidity rate was
60
/200 =
140
Patients
60
Patients
30%
Example 2: Calculation of the average extra cost per patient with 1+ complication in your own institution
Example 3: Calculation of the economic burden of complications in your own institution.
Example 2: Among your 200 colorectal
patients, 60 developed 1+ complication (morbidity rate 30%). If the total cost for the 60 patients with 1+ complication was $1.92M (i.e. $32K per patient) and the total cost for the 140 remaining patients without any complication was $2.10M (i.e. $15K per patient), then the average extra cost per patient with 1+ complication was $17K.
$1.02M / $4.02M 25% of your budget to treat post-surgical complications
$3M
$1M
$2.10M
$1.92M
Total Costs = $4.02M
Example 3: The average extra cost
per patient with 1+ complication was $17K. If 60 patients developed 1+ complication, you spent last year $1.02M (60 x $17K) to treat post-surgical complications in this specifi c surgical population. This represents 25% of your budget ($1.02M / $4.02M).
Can we prevent post-surgical complications?
Many post-surgical complications are related, at least in part, to insufficient or excessive fluid administration during the perioperative period5. A U-shape relationship is classically described as being between the amount of fluid administered and the morbidity rate5.
Standard fluid management is usually based on clinical assessment, vital signs and/or central venous pressure (CVP) monitoring. However, clinical studies have shown that CVP is not able to predict fluid responsiveness6 and that changes in blood pressure cannot
be used to track changes in stroke volume (SV) or in cardiac output induced by volume expansion7. In patients at risk of developing
complications, hemodynamic optimization with treatment protocols based on flow parameters (e.g. stroke volume, SV) and/or dynamic predictors of fluid responsiveness (e.g. stroke volume variation, SVV) is useful to decrease post-surgical morbidity.8 Over 30 randomized
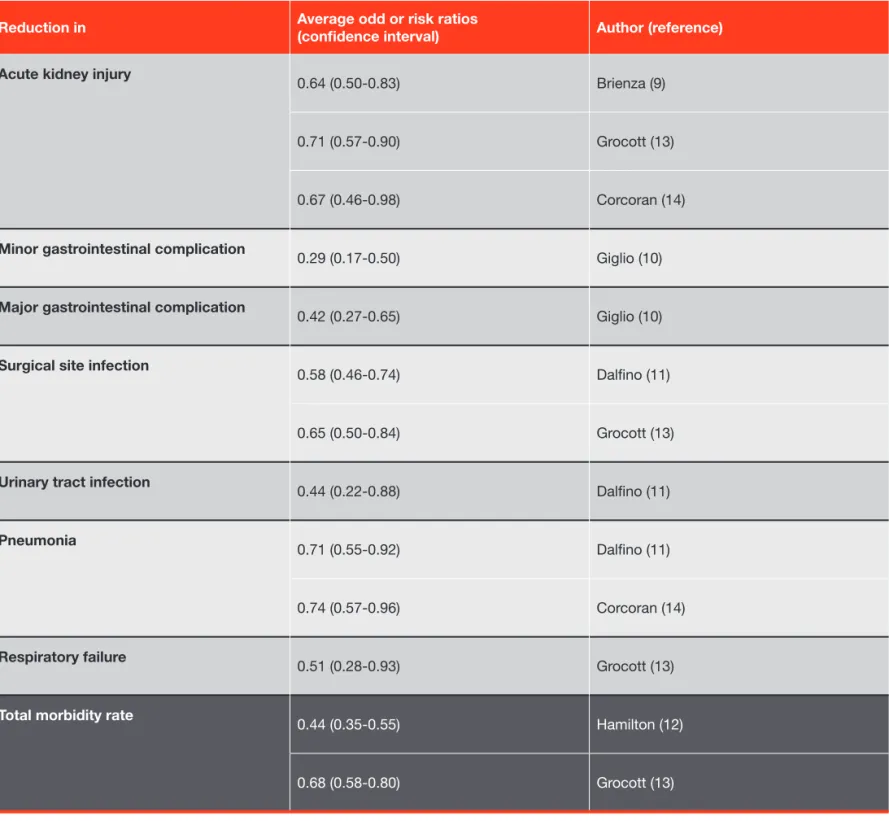
controlled trials and several meta-analyses have demonstrated the superiority of hemodynamic optimization over standard fluid management to decrease renal, gastrointestinal, respiratory and infectious complications, as well as the overall morbidity rate9-14.
Average reductions in post-surgical complications (odd or risk ratios) reported in meta-analyses9-14 are summarized in Table 2.
Table 2: Clinical benefits of hemodynamic optimization with treatment protocols over standard fluid management.
Reduction in Average odd or risk ratios (confidence interval) Author (reference)
Acute kidney injury
0.64 (0.50-0.83) Brienza (9)
0.71 (0.57-0.90) Grocott (13)
0.67 (0.46-0.98) Corcoran (14)
Minor gastrointestinal complication
0.29 (0.17-0.50) Giglio (10)
Major gastrointestinal complication
0.42 (0.27-0.65) Giglio (10)
Surgical site infection
0.58 (0.46-0.74) Dalfino (11)
0.65 (0.50-0.84) Grocott (13)
Urinary tract infection
0.44 (0.22-0.88) Dalfino (11)
Pneumonia 0.71 (0.55-0.92) Dalfino (11)
0.74 (0.57-0.96) Corcoran (14)
Respiratory failure
0.51 (0.28-0.93) Grocott (13)
Total morbidity rate
0.44 (0.35-0.55) Hamilton (12)
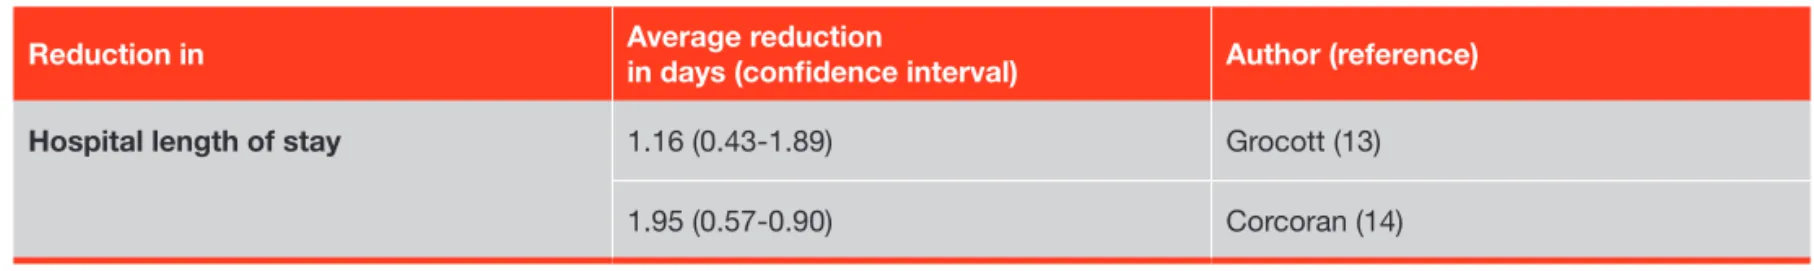
The decrease in post-surgical morbidity obtained with hemodynamic optimization with treatment protocols was shown to be associated with a decrease in hospital length of stay ranging between 1 and 2 days (see Table 3).
Table 3: Effects of hemodynamic optimization with treatment protocols on hospital length of stay.
Reduction in Average reduction in days (confi dence interval) Author (reference)
Hospital length of stay 1.16 (0.43-1.89) Grocott (13)
1.95 (0.57-0.90) Corcoran (14)
Predicting the clinical and economic benefi ts of hemodynamic optimization through
Perioperative Goal-Directed Therapy (PGDT).
$2.10M $1.92M
Total Costs Last Year = $4.02M
$32K
$15K
Extra Cost / Patient with 1+Complication = $17K
Total Costs Next Year = $3.36-3.57M
$672-1.05M
$2.51-2.69M
Example 5: If next year your morbidity rate drops from
30% to somewhere between 10.5% and 16.5%, only 21 to 33 out of your next 200 colorectal patients should develop 1+ complication. Last year 60 patients developed 1+ complication. With the implementation of PGDT you will then protect between 27 (60 – 33) and 39 (60 – 21) patients from complications. The previously estimated extra cost related to the treatment of 1+ complication was $17,000. With the implementation you should then save a total of $459-663k next year for this surgical population, i.e. $2295-3315 per patient.
Example 4: Multiplying your current morbidity rate by the
odd or risk ratio gives you an estimation of what should be your morbidity rate after implementing PGDT. If your morbidity rate is today 30% for 200 colorectal procedures, according to the odd ratio (0.35 to 0.55) reported in the meta-analysis of Hamilton et al.,12 it should range
between 10.5% (0.35 x 30%) and 16.5% (0.55 x 30%) after implementation. If the average length of hospital stay for your 200 colorectal patients was 9 days, then you can expect it will range between 7 and 8 days (refer to Table 3).
Example 4: Predicting the clinical benefi ts of hemodynamic optimization through Perioperative Goal-Directed Therapy.
Example 5: Predicting the economic benefi ts of hemodynamic optimization through Perioperative Goal-Directed Therapy.
Are there official recommendations and guidelines?
Fueled by the growing number of clinical studies and meta-analyses demonstrating the value of Perioperative Goal-Directed Therapy, official recommendations have been published in the UK by the Enhanced Recovery Partnership (ERP)15 and the Association of Surgeons
of Great Britain and Ireland16, in France by the French Society of Anesthesiology (SFAR)17, and in Europe by the Enhanced Recovery After
Surgery (ERAS) Society18. In the UK, financial incentives have even been created by the National Health Service (NHS) to ensure hospitals
are going to implement hemodynamic optimization as standard care for at least 80% of eligible patients19. The Patient Safety Foundation
of the European Society of Anesthesiology (ESA) recently released a Safety Kit which contains a summary of PGDT treatment protocols. Given the now well-established clinical and economic benefits of PGDT protocols, and the above recommendations, more and more hospitals are interested in implementing hemodynamic optimization both to improve quality of care and to decrease costs.
Following is a simple, step-by-step guide for implementing hemodynamic optimization through Perioperative Goal-Directed Therapy in your moderate to high-risk surgeries.
How to implement hemodynamic optimization through Perioperative
Goal-Directed Therapy in your moderate to high-risk surgeries.
The Edwards Enhanced Surgical Recovery Program 4-step implementation process ASSESS,ALIGN, APPLY, MEASURE helps standardize care and realize the benefits of PGDT.
Enhanced Surgical Recovery Program advisors have the expertise and clinical experience to help you integrate evidence-based protocols, engage your clinicians to align staff across departments, help you deliver effective metric tracking, and facilitate peer-to-peer exchange of best practices through our Centers of Excellence network.
Phase 1 = ASSESS
The objective of the first phase is to assess the current situation and to predict anticipated clinical and economic benefits.
• Select one or several surgical procedures where a benefit has been established and hence is also expected in your institution. Refer to the list of eligible procedures available from Edwards upon request.
You can (but do not have to) restrict the implementation to a subgroup of patients who have a higher risk to develop complications (e.g. patients with specific co-morbidities or patients with ASA score >I or patients older than 65 yrs).
• Assess the current morbidity rate using the list of complications provided in Table 1 and following Example 1 and/or assess the current hospital length of stay.
• Predict the clinical benefits of implementing PGDT following Example 4.
• Predict the economic benefits of implementing PGDT following Examples 2 and 5.
Edwards Enhanced Surgical Recovery Program – 4-Step Process
mEASuRE Analyze morbidity rates and/or LOS Measure clinical and economic outcome benefits Build core team Choose PGDT treatment protocol Choose a hemodynamic monitoring platform AliGn Select surgical procedure(s) Assess current morbidity rate and/or LOS Estimate potential clinical and economic benefits of PGDT ASSESS Train and develop competencies Establish PGDT as new SOP and add to checklist
Quantify and track compliance
Phase 2 = AliGn
• Build a team. Changing the standard of care is not a single-person initiative. You need to work with the team to communicate and ensure they understand the clinical and economic value of hemodynamic optimization. Further, the team must be able to solve any technical, medical and human challenge you may encounter during the implementation phase. Your core team should be led by a champion and include at least one representative of the surgical team, of the anesthesia team, of the anesthesia assistant (AA) and/or certified registered nurse anesthetist (CRNA) team, as well as your quality officer.
• Choose a PGDT treatment protocol. One of your first tasks will be to select the most appropriate PGDT protocol for the surgical population you have selected. Several protocols have been shown to be effective. The ESA protocol summary is available from Edwards upon request.
• Choose a hemodynamic monitoring platform. Most hemodynamic optimization protocols are based on the monitoring of flow parameters and/or dynamic predictors of fluid responsiveness.
Phase 3 = APPly
To ensure a successful implementation of PGDT, it is important to provide appropriate training and track compliance.
• Train and develop competencies. All anesthesiologists and AA/CRNAs who will ensure and/or apply hemodynamic optimization must be trained. A training presentation is available from Edwards upon request.
• Ensure optimal compliance. Compliance to guidelines and recommendations is often suboptimal. To ensure PGDT protocols are followed properly, several actions and tools are useful:
° SOP. Defining PGDT as an official and new Standard Operating Procedure (SOP) for hemodynamic optimization in your department.
° Surgical Safety Checklist. Adding a single item to the current “Sign In” section of the surgical safety checklist, such as “the patient’s eligibility for hemodynamic optimization has been considered.”
° Compliance tools. Refer to the compliance tool, which is available from Edwards upon request.
° Electronic data recording. Refer to instructions for how to download hemodynamic parameters from your monitoring platform.
Phase 4 = mEASuRE
Using methods described in Phase 1 (ASSESS), you can calculate the morbidity rate and real costs, and estimate hospital LOS after the implementation of PGDT in order to confirm the clinical (reduction in morbidity and length of stay) and economic benefits (net savings). You can even publish the results of your implementation program in a good medical journal if you secure IRB approval.20,21
Edwards Lifesciences
I
edwards.comOne Edwards Way
I
Irvine, California 92614 USAI
I
I
I
I
References
1. Ghaferi et al. Variation in hospital mortality associated with inpatient surgery. New Engl J Med 2009 2. Boltz et al. Synergistic implications of multiple postoperative outcomes. Am J Med Qual 2012
3. Lawson et al. Association between occurrence of a postoperative complication and readmission. Ann Surg 2013
4. Khuri et al. Determinants of long-term survival after major surgery and the adverse effect of post-operative complications. Ann Surg 2005 5. Bellamy. Wet, dry or something else? Br J Anaesth 2006
6. Marik & Cavallazzi. Does the central venous pressure predict fluid responsiveness? An updated meta-analysis and a plea for some common sense. Crit Care Med 2013
7. Le Manach et al. Can changes in arterial pressure be used to detect changes in cardiac output during volume expansion in the perioperative period? Anesthesiology 2013
8. Michard & Biais. Rational fluid management: dissecting facts from fiction. Br J Anaesth 2012
9. Brienza et al. Does perioperative hemodynamic optimization protect renal function in surgical patients? A meta-analytic study. Crit Care Med 2009 10. Giglio et al. Goal-directed haemodynamic therapy and gastrointestinal complications in major surgery: a meta-analysis of randomized controlled
trials. Br J Anesth 2009
11. Dalfino et al. Haemodynamic goal-directed therapy and postoperative infections: earlier is better. A systematic review and meta-analysis. Crit Care 2011
12. Hamilton et al. A systematic review and meta-analysis on the use of preemptive hemodynamic intervention to improve outcomes in moderate and high-risk surgery. Anesth Analg 2011
13. Grocott et al. Perioperative increase in global blood flow to explicit defined goals and outcomes after surgery: a Cochrane systematic review. Br J Anaesth 2013
14. Corcoran et al. Perioperative fluid management strategies in major surgery: a stratified meta-analysis. Anesth Analg 2012
15. Mythen et al. Perioperative fluid management: Consensus statement from the enhanced recovery partnership. Perioperative Medicine 2012 16. Powell-Tuck et al. British consensus guidelines on intravenous fluid therapy for adult surgical patients.
17. Vallet et al. Guidelines for perioperative haemodynamic optimization. Ann Fr Anesth Reanim 2013
18. Gustafsson et al. Guidelines for perioperative care in elective colonic surgery: enhanced recovery after surgery (ERAS) society. World J Surg 2013 19. http://www.ntac.nhs.uk/NewsAndEvents/CQUIN_Draft_Guidance_Published.aspx
20. Michard et al. Perioperative hemodynamic therapy: Quality improvement programs should help resolve our uncertainty. Crit Care 2011 21. Kuper et al. Intraoperative fluid management guided by oesophageal Doppler monitoring. BMJ 2011
Edwards, Edwards Lifesciences, and the stylized E logo are trademarks of Edwards Lifesciences Corporation. © 2013 Edwards Lifescienses Corporation. All rights reserved. AR10377