HAL Id: hal-00299111
https://hal.archives-ouvertes.fr/hal-00299111
Submitted on 16 Apr 2004
HAL is a multi-disciplinary open access
archive for the deposit and dissemination of
sci-entific research documents, whether they are
pub-lished or not. The documents may come from
teaching and research institutions in France or
abroad, or from public or private research centers.
L’archive ouverte pluridisciplinaire HAL, est
destinée au dépôt et à la diffusion de documents
scientifiques de niveau recherche, publiés ou non,
émanant des établissements d’enseignement et de
recherche français ou étrangers, des laboratoires
publics ou privés.
the Municipality of Davos, Switzerland
S. Fuchs, M. Bründl, J. Stötter
To cite this version:
S. Fuchs, M. Bründl, J. Stötter. Development of avalanche risk between 1950 and 2000 in the
Munic-ipality of Davos, Switzerland. Natural Hazards and Earth System Science, Copernicus Publications
on behalf of the European Geosciences Union, 2004, 4 (2), pp.263-275. �hal-00299111�
Natural Hazards and Earth System Sciences (2004) 4: 263–275 SRef-ID: 1684-9981/nhess/2004-4-263
© European Geosciences Union 2004
Natural Hazards
and Earth
System Sciences
Development of avalanche risk between 1950 and 2000 in the
Municipality of Davos, Switzerland
S. Fuchs1, M. Br ¨undl1, and J. St¨otter2
1WSL Swiss Federal Institute for Snow and Avalanche Research SLF, Davos, Switzerland
2Department of Geography, University of Innsbruck, Austria
Received: 30 September 2003 – Revised: 10 December 2003 – Accepted: 12 December 2003 – Published: 16 April 2004 Part of Special Issue “Multidisciplinary approaches in natural hazards”
Abstract. In recent years, risk assessment has become
increasingly important for the protection of settlements against natural hazards because the public authorities have to economise their budgets and therefore to legitimate their investments. To quantify risk, information is needed on both, recurrence intervals of the potentially damaging natural pro-cesses and on the associated damage potential. In the past, high efforts were undertaken to assess the former, while the latter was almost ignored. The aim of this study was to de-termine the development of the avalanche risk in the inhab-ited areas of the municipality of Davos, canton of Grisons, Switzerland, for the period between 1950 and 2000. The ex-tent of avalanche prone areas was quantified using the numer-ical avalanche model AVAL-1D and the current legal hazard maps. The damage potential was quantified by the number and reinstatement values of buildings and by the number of persons per building. It has been demonstrated that, contrary to the frequently expressed statement that the vulnerability of communities has increased, the risk for this settlement in fact decreased substantially. This can mainly be attributed to the realisation of mitigation measures, such as defence struc-tures in avalanche starting zones. The only exception regard-ing the development of risk was in the category of residen-tial buildings, were an increase in risk was already detectable at medium recurrence intervals. This is remarkable because methods of land use planning, such as hazard mapping, are intended to protect residential buildings from the impact of hazardous processes. However, general statements referring to a larger area (region, country) might be difficult to make, since small-scale disparities have a very important influence on the diversification of risk and risk management. Further-more, it has to be emphasized that the results are highly de-pendent on the assumptions made in this study.
Correspondence to: S. Fuchs
1 Introduction
Avalanches pose a threat to settlements and infrastructure in Alpine environments. In addition to flooding events and landslides, avalanches repeatedly cause serious damage in inhabited areas, even though this damage is usually on a smaller scale. Overall, damage resulting from avalanches is decreasing, in contrast to the damage caused world-wide by other natural hazards (Burton et al., 1993; Munich Re, 2002; United Nations, 2002). However, avalanches can pose a high level of threat locally, because Alpine settlements are con-centrated in confined areas. This intensive utilisation is be-cause many Alpine areas cannot be utilised in an economic
sense. In the canton of Grisons, a typical central-alpine
mountain area, non-productive areas amount to 44% of the whole territory (Ritzmann-Blickenstorfer, 1996). In recent years, possible climate-induced changes in areas of natu-ral environment have been investigated systematically, par-ticularly changes in magnitude and frequency of hazardous events (e.g. Schneebeli et al., 1998). However, until now lit-tle work has been done to assess changes that have occurred in the Alpine man-made environment since the end of the 19th century, and to ascertain whether susceptibility to in-tensified processes has increased. One way of approaching this question is to investigate changes in the risk of natural hazards in settlement areas, because changes in risk in set-tlements result from changes in natural environment on the one hand and changes in man-made environment on the other hand.
In Switzerland, about EUR 1 billion has been invested in technical avalanche mitigation measures since 1950 (SLF, 2000). This figure does not include money spent on
pro-tection forests. It represents an average investment of
EUR 20 million per year. However, the extensive damage that occurred during the avalanche winter of 1998/1999 in Switzerland, when 1350 avalanches were released, amounted to over EUR 500 million, consisting of EUR 300 million for direct property damage and around EUR 200 million for in-direct damages (Noethiger et al., 2002). The extent of this
damage corresponds to approximately 25 years of investment in mitigation measures, without taking into account expenses for regular support payments, maintenance and accruals.
In connection with the losses sustained, it is repeatedly postulated that the risk has increased gradually during the past decades, mainly because of modified demands on the part of the population with regard to infrastructure, mobil-ity and communication (see e.g. Ammann, 2001; Barbolini et al., 2002). Until now, this qualitative statement has not been quantified for Alpine settlements. However, Wilhelm (1997a) is concluding in his investigation relating to the cost-effectiveness of avalanche protection measures in the Swiss Alps, that an increased risk cannot be inferred from the de-velopment of losses in recent years.
The aim of the present work is to present a conceptual at-tempt to determine the development of risk resulting from natural hazards in inhabited areas. The investigation area is the municipality of Davos, Switzerland, in which the devel-opment of the avalanche risk is described for the years be-tween 1950 and 2000. The investigation aims to make a con-tribution towards a well founded statement concerning the development of risk arising from natural hazard processes. A method highlighting remaining temporal and spatial risk for assets and persons is presented. Within the framework of disaster prevention, this paper contributes to an improvement in the integrated risk management process.
2 Methods
2.1 Risk concept
The methodological concept used for this work is based on a procedure to quantify the development of risk for natural haz-ard processes over different time intervals, using publicly ob-tainable data. The procedure for avalanche risk is presented, and the investigated time interval is 1950 to 2000.
In the area of natural hazards, risks are defined as a func-tion of probability of occurrence of defined events and the corresponding extent of damage. The basic formulation of this function is the product formula, which can be adjusted, according to the specific requirements, to take account of ad-ditional components like reduction factors (Wilhelm, 1997a) or vulnerability factors (e.g. Varnes, 1984; Morgan et al., 1992; Cutter, 1996), see Eq. (1).
Ri,j =pSi·AOj·pOj,Si·vOj,Si (1)
Ri,j is the risk, dependent on scenario i and object j ; pSi is
the probability of scenario i; AOj is the value of object j ;
pOj,Si is the probability of exposure of object j to scenario
i and vOj,Si is the vulnerability of object j , dependent on
scenario i.
This is a very technical perspective. Particularly from the socio-scientific perspective, it has to be noted that risk has a wider meaning than the product of recurrence interval and extent of damage (Kates, 1971; Kates and Kasperson, 1983; Renn, 1995; Cutter, 1996; Slovic, 1999). Nevertheless, this
basic formulation is well established in the area of engineer-ing science (Varnes, 1984; Fell, 1994; Hollenstein, 1997; Borter, 1999).
The recurrence interval of an avalanche event depends on two parameters: changes in the natural avalanche activity on the one hand and changes due to the realisation of mitigation measures on the other hand. As investigations in the Swiss Alps have shown, the natural avalanche activity appears to be constant, at least for the period under consideration between 1950 and 2000 (Laternser and Schneebeli, 2002), although it has been pointed out that the variability of events makes an accurate statement difficult. This is why changes in the extent of accumulation areas are dependent only on the re-alisation of technical mitigation measures and on diversifi-cation in protection forests with regard to species and age. For the year 1950, the spatial extension of the process areas is represented using the one-dimensional avalanche model AVAL-1D (Christen et al., 2002a), while the lateral extension is retrieved by querying the event cadaster of former events. For the year 2000, the legally valid hazard maps are used.
2.2 Avalanche modelling
AVAL-1D is a one-dimensional avalanche dynamics program that predicts runout distances, flow velocities and impact pressure of both flowing and powder snow avalanches. Cal-ibrated depth-average continuum models are used to track the motion of the avalanches from initiation to runout. AVAL-1D consists of two computational modules for dense flow avalanches and powder snow avalanches. These mod-ules solve the governing equations of mass, energy and mo-mentum balance using a finite difference scheme (Christen et al., 2002a).
The dense flow simulation model employs a “Voellmy-fluid” flow law. This law assumes that the shear strains in the flow body are small and that the flow resistance, given by a dry-Coulomb type friction (µ) and a velocity squared friction (ξ ), is concentrated at the base of the avalanche. The mag-nitude of these two friction parameters is based on extensive model calibration (Bartelt et al., 1999) as well as observed field events.
The powder snow simulation follows Norem’s description of powder flow avalanche formation and structure (Norem, 1995). The model consists of a suspension layer and a salta-tion layer, mass and momentum exchange between those two layers being determined by particle settling, turbulent dif-fusion against the concentration gradient, and aerodynamic shear forces (Christen et al., 2002a). The net erosion or de-position rate is a function of the kinetic energy of the impact-ing forces. More details about the model and its validation are described in Issler (1998) and F¨orster (2000).
The avalanche calculations as well as the selection of the friction parameters µ and ξ followed the guidelines given in the manual (Christen et al., 2002b). The fracture depths were obtained applying extreme value statistics by Gumbel on the possible maximum new snow height within three days. The input parameters were calibrated on the basis of the current
S. Fuchs et al.: Development of avalanche risk between 1950 and 2000 265
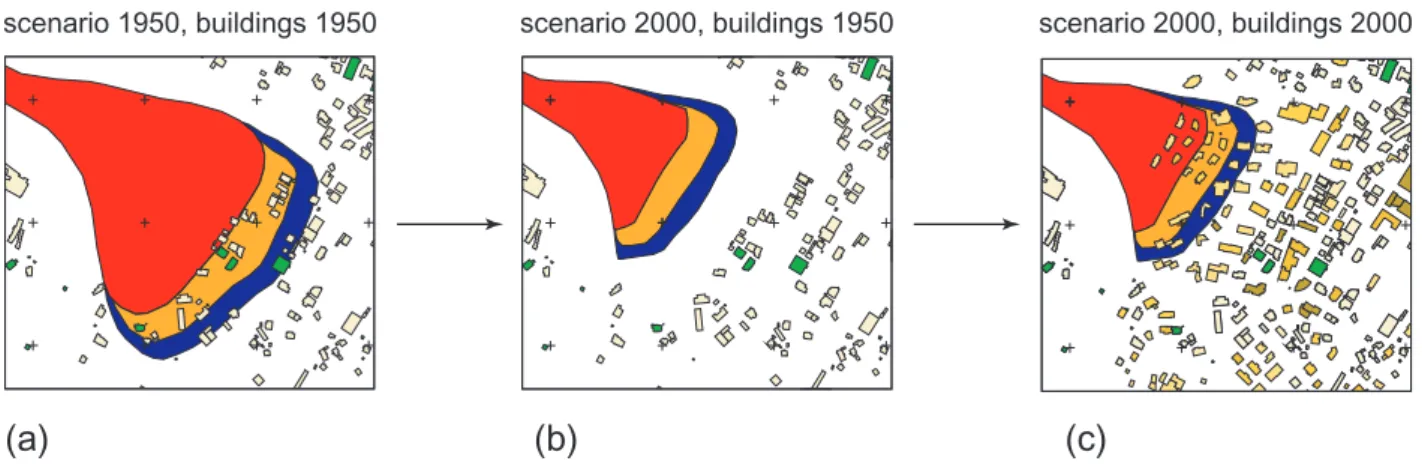
scenario 1950, buildings 1950 scenario 2000, buildings 1950 scenario 2000, buildings 2000
(a) (b) (c)
Fig. 1. Illustration of the procedure when investigating the temporal development of the risk. The analysis is based on a 30-year (red), a
100-year (brown) and a 300-year (blue) avalanche event. The extent of the accumulation areas in the year 1950 with the appropriate number of buildings is presented in Fig. 1a. Figure 1b shows the locations of buildings existing in 1950 in the context of the accumulation areas of the year 2000, resulting from the realisation of mitigation measures. In Fig. 1c, the current building location map is presented for the year 2000 with the corresponding avalanche scenario.
hazard maps. The following assumptions were made for the determination of the run-out zones:
• The release areas of the avalanches under investigation
were included as a whole in the calculation, partial trig-gering was not assumed.
• Since in the model AVAL-1D the parameter ξ is
re-garded as being dependent on the friction coefficient µ, the stock of wood in the transit zone was considered using the smallest possible value for the friction
param-eter ξ . A value of 400 [m/s2] was shown to reproduce
the real conditions very accurately (SLF, 1999).
• Buildings within the accumulation area were not
con-sidered as defenses to retard avalanches, because their effect is not precisely quantifiable. Thus, there were examples where an avalanche destroyed a building sit-uated perpendicular to the avalanche axis (e.g. in the hamlet of Valzur, Paznaun valley, Austria, in Febru-ary 1999), but there were cases where such a building was able to stop such an avalanche completely (e.g. in the village of Airolo, Tessin, Switzerland, Febru-ary 1951). An important factor according for such dif-ferences in vulnerability is the structure of these build-ings. Simple wooden chalets or brick buildings have only little resistance to avalanche impacts, while rein-forced concrete buildings can resist medium to strong pressure intensities and retard the avalanche flux. How-ever, investigations based on the structure of buildings require a totally different approach and a much larger measuring scale than the one used in this investigation.
• In this investigation, it was assumed that all
mitiga-tion measures are 100% efficient, even though, during the avalanche winter of 1998/1999 for example, some avalanches appeared to have started within existing de-fence structures (SLF, 2000).
2.3 Calculation of damage potential
The extent of damage is a direct consequence of the damage potential in the accumulation area of the particular scenarios (see Fig. 1). The damage potential results from the number of potentially affected buildings and their insured reinstate-ment values, as provided by the mandatory building insur-ance (GVA building insurinsur-ance company of Grisons). Since these values have been adjusted to take account of inflation, the insured sum for the year 1950 can be compared directly to the sum for the year 2000.
The number of endangered persons can be calculated on the basis of the number of domiciles. Statistics indicated 3.6 persons per unit in the year 1950 and 2.4 per unit in the year 2000 (Ritzmann-Blickenstorfer, 1996; BfS, 2001). The number of persons in hotels, guest houses and clinics was quantified using the existing number of beds, multiplied by the degree of utilisation. To account for the employees work-ing in hotels and clinics facilities the number of beds was in-creased by 20% (Davos Tourist Board, 2002, pers. comm.) and 70% (BfS, 2002), respectively. The availability of such data eliminates the need for costly and time consuming field work and means that the procedure can be adapted to other areas of investigation.
In this paper, the vulnerability of buildings and persons is considered in terms of probable maximum loss (PML). From an actuarial point of view, this is the largest poten-tially possibly assumable loss. This means that the total ac-cumulation area revealed was considered when calculating the values at risk and that buildings located therein influ-ence the risk calculation with their entire reinstatement value and their entire number of attendant persons. Thus, the risk – in absolute values – was overestimated compared to the effective existent risk. Since the current work represents a relative comparison of different system states, the method-ology used is considered to be acceptable. Furthermore, the
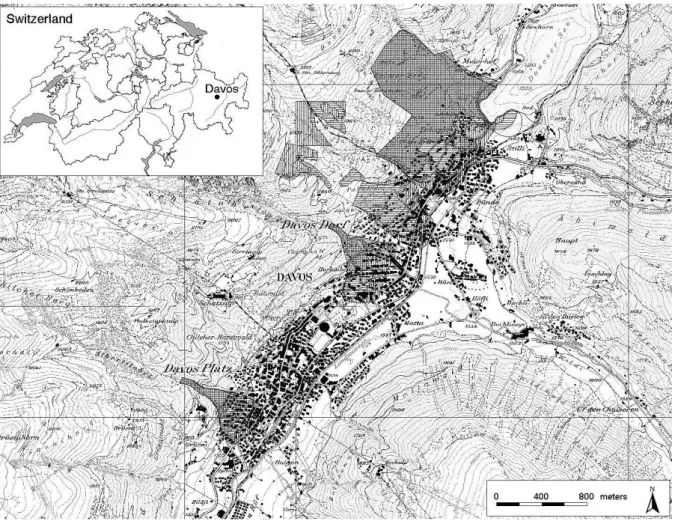
Fig. 2. The municipality of Davos, covering totally 254 km2, is located in the eastern part of Switzerland. The investigation area included those areas of the city centre that are affected by avalanches, indicated in grey raster graphics. The cross hatch represents the 30-year scenario, the lined hatch the 300-year scenario and the continuous line the outer line of powder snow avalanches. Reproduced with permission of SWISSTOPO (BA035092).
large uncertainties in the vulnerability term, which are not yet completely known, could be ignored (e.g. Cutter, 1996; Wilhelm, 1997b; J´onasson et al., 1999; Keylock et al., 1999; Keylock and Barbolini, 2001).
2.4 Calculation and comparison of risk
The principal approach is the following: the cumulative risk for the settlement area resulting from accumulation areas and damage potential in the year 1950 was compared to the sit-uation in the year 2000. Initially, the damage potential for the year 1950 was quantified (Fig. 1a). In a second step, the damage potential relating to the year 1950 was recalculated on the basis of the reduced accumulation areas applicable in 2000 (Fig. 1b). This represents the theoretical development of damage potential between the years 1950 and 2000 as it would have been without new buildings, but with the miti-gation measures realised in that period. In a third step, the process areas of the year 2000 were intersected with the ef-fective damage potential in the year 2000 (Fig. 1c). This is the development of risk, resulting from the reduction in the
accumulation areas on the one hand and the aggregation and expansion of buildings on the other hand. This procedure is theoretically applicable to any arbitrary time interval and provides, as a result, the development of risk over time.
In order to make a fundamental statement concerning the development of risk, scenarios for an avalanche event with a 30-year, a 100-year and a 300-year recurrence interval were calculated. The specifications of the avalanche sce-nario concerned were intersected with the affected inhabited area using a GIS. Subsequently, the development of risk over time could be quantified, and specific risk peaks could be depicted. The results constitute a source of information to aid decision making, measurement planning and developing methods of risk communication.
2.5 Investigation area
The investigation area is located in the municipality of Davos, Grisons, Switzerland (see Fig. 2). Davos is a typi-cal Alpine holiday region with about 13 000 permanent in-habitants during summertime and up to 60 000 people in
S. Fuchs et al.: Development of avalanche risk between 1950 and 2000 267 winter time. The residential area of Davos is located
be-tween 1500 and 1900 m asl, which illustrates the suscepti-bility of this area to avalanche damage. Between 1950 and 2000, 66 avalanche events are documented within the munic-ipal area, causing damage to a total of 171 buildings. Thirty of these events occurred in the winter of 1951, damaging 64 buildings, and 24 occurred in the winter of 1968 and damaged 85 buildings. Altogether, 21 persons went miss-ing durmiss-ing these events. For the analysis of risk, only areas of the city centre of Davos that are susceptible to avalanche events were investigated, which amounts to only about 10% of the whole building inventory within the municipality. The avalanche paths under investigation also pose a threat to the main road in town and the railway line towards the Albula valley, which is of particular importance for the tourism
in-dustry. In total, the centre of Davos is affected by four
avalanche paths.
3 Results
The development of value and number of buildings affected in the avalanche scenarios with 30-, 100- and 300-year re-currence intervals is presented in the following sections for the years 1950 and 2000. Additionally, the analysis of the number of persons affected by these scenarios is shown. The results are presented in their entirety on the one hand, and in part on the other hand, with divisions into certain building categories to highlight certain risk peaks.
3.1 Variations in the damage potential of buildings
A summary of changes in the damage potential (value and number) of buildings is shown in Table 1 and, in graphic form, in Figs. 3a and 3b.
Inside the areas affected by an event with a recurrence in-terval of 30 years, there were 83 buildings, with a total re-placement value of approximately EUR 107.6 million in the year 1950. After the construction of mitigation measures, the areas affected by the process were reduced; and the sce-nario threatened only six buildings, with a total replacement value of EUR 3.7 million. When buildings constructed or ex-tended by the year 2000 were added, a total of 33 buildings, with a total replacement value of EUR 19.3 million, were lo-cated within this area. This is nearly 40% of the buildings originally present in the status before defense structures were constructed. The insured value amounted to 18% of the en-dangered value in the year 1950. This development indicates that although an increase in the threat to the number of build-ings from originally 7.2% to 39.6% was recorded, relatively expensive buildings have been protected, because the insured value increased from 3.4% of the initial value to only 17.8%. This is in direct relation to the legally binding land-use plan, allowing only low floor space indices higher up the slope.
A similar trend can be observed in the areas affected by a 100-year avalanche event. In 1950, in the status with-out defense structures, 127 buildings, with a total
replace-ment value of EUR 173.5 million, were inside the endan-gered areas. When the implementation of mitigation mea-sures in the starting zones was taken into account, nearly 90% of the originally existent buildings were protected, leav-ing just 15 buildleav-ings exposed, with a total replacement value of EUR 12.5 million. The addition of buildings constructed or extended by the year 2000 resulted in a total of 91 build-ings, with a total replacement value of EUR 75.2 million, being located in the endangered area. This corresponds to 71.7% in number and 43.3% in assets of the initial value in the year 1950. Once again, the relatively expensive build-ings are oriented towards the valley-side of the accumulation areas.
In the year 1950, a total of 161 buildings, with an insured value of EUR 239.4 million, were located inside the area af-fected by an 300-year avalanche. With the implementation of mitigation measures, this number was reduced to 28 build-ings, with a total replacement value of EUR 20.2 million. In the year 2000, owing to the increase in the construction of new buildings, a total of 125 buildings, with an aggregated value of EUR 121.7 million, were located inside the endan-gered area, corresponding to 77.6% and 50.9% of the initial value in the year 1950, respectively.
Accordingly, the risk has undergone a change, as shown in Table 1, because the factor for the vulnerability was set to the value of 1, and thus the PML was calculated. The risk reduc-tion for the 30-year recurrence interval amounted to 60.4% concerning the number of endangered buildings and 82.1% concerning their insured value. The risk reduction for a 100-year recurrence interval amounted to barely 30% ing the number of endangered buildings and 56.7% concern-ing the correspondconcern-ing value. The risk for a 300-year recur-rence interval was reduced by about 22.4% with regard to the number of buildings and 49.1% with regard to the respective value.
The rarer an event is, the higher the risk in the year 2000 is compared to the initial state in the year 1950. This indicates that there has been an aggregation of the building develop-ment, which is thinning out towards the avalanche path.
In the following section, the results are presented for dif-ferent categories of buildings. The buildings in Davos were separated into six categories, in an effort to represent the existent damage potential in the best possible way. These categories are: residential buildings, commercial buildings, hotels and guest houses, agricultural buildings, special-risk-buildings (churches, hospitals and public administra-tion buildings) and other buildings. The analysis for the years 1950 and 2000 according to the number of buildings is presented in Table 1 and Fig. 3a. For comparison, on the right x-axis of Fig. 3a the total sum of all buildings within each scenario is presented.
As mainly commercial buildings and accommodation fa-cilities were protected by mitigation measures, there was no noticeable increase in the risk. In the zone relating to the 30-year scenario, there was no remaining risk in the year 2000. The 100-year scenario affected only one building
scenario 100 200 0 100 number commercial buildi ngs hotels/guest hou ses agricultur al buildings special-risk-build ings other buildings sum residential building s scenario 30 200 0 100 number scenario 300 200 100 0 50 100 0 50 100 0 50 0 100 number number number number
risk in the year 1950
risk in the year 2000 assuming no further buildings since 1950 risk in the year 2000 taking into account buildings constructed since 1950
scenario 100 100 200 0 50 0 100 million € million € 300 100 scenario 30 300 0 50 0 100 million € million € 200 scenario 300 100 300 0 50 0 100 million € million € 200 commerc ial buildings hotels/guest ho uses agricultur al buildings special-risk-build ings other buildings sum residential building s
a)
b)
Fig. 3. (a) Number of buildings involved in each scenario, subdivided into residential buildings, commercial buildings, accommodation
facilities (hotels and guest houses), agricultural buildings and extraneous risks (special-risk-buildings). The left (primary) ordinate illustrates the number of buildings in each category, and the right (secondary) ordinate illustrates the sum of all buildings affected by the scenario.
(b) Insured value of the buildings affected in each scenario, subdivided into residential buildings, commercial buildings, accommodation
facilities (hotels and guest houses), agricultural buildings and extraneous risks (special-risk-buildings). The left (primary) ordinate illustrates the value of buildings for each category, and the right (secondary) ordinate illustrates the sum of all values affected by the scenario.
S. Fuchs et al.: Development of avalanche risk between 1950 and 2000 269 T ab le 1. Num ber (N ) and in sured v alue (in k EUR) of th e b uil dings af fect ed by the scenari os (30 -, 100-and 3 00-ye ar av alanch e), annu al cha nge in the risk and change in the to tal ri sk v ersus the in itial risk. Th e res ults for a startin g sce nario in th e ye ar 19 50 (st arting 1950 ) and for a sc enario in th e yea r 2000 (mit ig ation 2000 ) taki ng int o acco unt m itig at ion m easure s are illustr ated. Addit ionall y, th e exis tent b uildin gs of the m itig ati on scen ario (mi tig atio n 2000) are subdi vided in to b uild ings b ui lt before 1 950 (m itig atio n ≤ 19 50) and b u ilding s b uilt aft er 1950 (mi tig atio n ≥ 1951) .
1
Table 1. Number (
N
) and insured value (in kEUR) of the building
s affe
cted b
y the scen
arios (3
0-, 100- and
300-ye
ar a
valanche
), annual
chan
ge
in the
risk and
ch
ange in the total risk v
ers
us the initial risk. The results for a startin
g sc
enar
io in the
ye
ar 1950
(
starti
ng
1950)
and fo
r
a scen
ario in the
ye
ar 20
00 (mitig
ation 2000) taki
ng
into a
ccount mitig
atio
n measures
are illustrated
. Additionall
y,
the ex
iste
nt building
s of the
mitig
ation scena
rio (mitig
ation 2000)
ar
e subdi
vided into building
s bui
lt before 1950
(mitigation
≤1950) and buildin
gs built after 1950
(mitig
ation
≥ 1951).
re si de nt ia l build ing s co m m er ci al build ing s ho te ls /g ue st ho us es ag ri cu ltu ral build ing s sp eci al -ri sk -build ing s ot he r b uil di ngs su m recur re nce inte rv al scen ar io N k € N k € N k€ N k € N k € N k€ N ri sk /y ear (N ) % o f st ar ti ng sc en ar io k€ ri sk /y ear (€ ) % o f st ar ti ng sc en ar io st ar ti ng ( 1950) 24 14 313 10 7 806 15 27 808 7 2 926 9 24 727 18 30 058 83 2. 8 100. 0 107 638 3 587 933 100. 0 m iti ga ti on ( ≤ 1950) - - - - - - 4 260 2 3 450 - - 6 0. 2 7. 2 3 710 123 667 3. 4 m iti ga ti on ( ≥ 1951) 26 14 471 -- 1 1 127 27 - - 15 598 - -30
mi ti gat io n ( 2000) 26 14 471 - - - - 4 260 2 3 450 1 1 127 33 1. 1 39. 6 19 308 643 600 17. 8 st ar ti ng ( 1950) 39 25 198 19 13 366 21 50 542 10 3 956 13 43 493 25 37 013 127 1. 27 100. 0 173 568 1 735 680 100. 0 m iti ga ti on ( ≤ 1950) 4 523 - - 1 1 994 4 260 2 3 450 4 6 285 15 0. 15 11. 8 12 512 125 120 7. 2 m iti ga ti on ( ≥ 1951) 67 58 332 - - - - 2 611 - - 7 3 784 76 - - 62 727 - -100
mi ti gat io n ( 2000) 71 58 855 - - 1 1 994 6 871 2 3 450 11 10 069 91 0. 91 71. 7 75 239 752 390 43. 3 st ar ti ng ( 1950) 51 34 980 22 17 594 27 93 768 13 4 589 14 46 833 34 41 668 161 0. 537 100. 0 239 432 798 107 100. 0 m iti ga ti on ( ≤ 1950) 8 1 138 - - 4 5 633 5 2 676 4 3 450 7 7 299 28 0. 093 17. 4 20 196 67 320 8. 4 m iti ga ti on ( ≥ 1951) 85 86 718 1 5 902 - - 2 611 - - 9 8 329 97 - - 101 560 - -300
mi ti gat io n ( 2000) 93 87 856 1 5 902 4 5 633 7 3 287 4 3 450 16 15 628 125 0. 417 77. 6 121 756 405 853 50. 9scenario 300 1,000 200 0 500 0 1,000 number number 600 1,400 hotels/guest houses commercial bu ildings special-risk-b uildings sum residential bu ildings scenario 100 1,000 200 0 500 0 1,000 number number 600 1,400 scenario 30 1,000 200 0 500 0 1,000 number number 600 1,400
risk in the year 1950
risk in the year 2000 assuming no further buildings since 1950 risk in the year 2000 taking into account buildings constructed since 1950
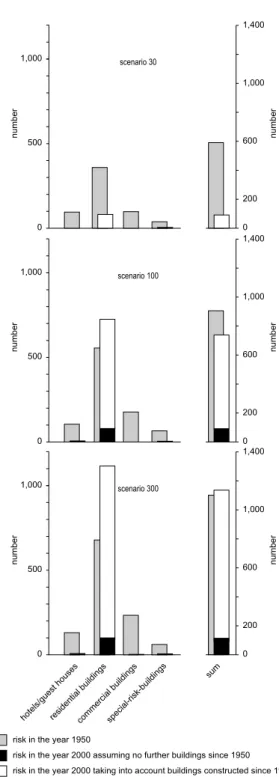
Fig. 4. Number of persons affected per scenario. On the left (primary) ordinate, the number of persons is subdivided into dif-ferent building categories (accommodation facilities (hotels and guest houses without number of beds and employees), residential buildings, commercial buildings and extraneous risks (special-risk-buildings)). On the right (secondary) ordinate, the total sum of all affected persons is illustrated.
in the year 2000. The 300-year scenario affected fourbuild-ings in the category of the hotels and guest houses, all of which had been erected before 1950, and one commercial building that was erected after 1950. The risk for
agricul-tural buildings amounted to 40% of the initial risk in the year 1950, which can be ascribed to new buildings on the one hand and to the relatively exposed position of individual haystacks and alp buildings on the other hand. Within the category of special risks, there were two buildings in each of the 30-year and the 100-year scenarios, and a total of four buildings in the area affected by the 300-year scenario.
There is a problematical development relating to the cate-gory of residential buildings. In the scenario of an avalanche with a 30-year recurrence interval, the initial risk in the year 1950 is just exceeded. In the year 2000, two additional buildings were situated in the endangered areas compared with the year 1950 with its expanded process areas. Regard-ing the 100- and 300-year scenarios, the initial risk in the year 1950 had increased in both cases by 82%.
The analysis of the corresponding insured values for each scenario is presented in Table 1 and Fig. 3b. For compari-son, on the secondary x-axis of Fig. 3b the total values of all buildings within every scenario is shown. The develop-ment of the financial risk runs more or less in analogy to that of the number of buildings. It is remarkable that in the year 2000 the risk for residential buildings within the 30-year scenario was slightly exceeded, while within the 100-and 300-year scenarios it more than doubled (2.3 times 100-and 2.5 times). Since in the case of insurance claims, from an economic point of view, the financial loss to be compensated for by the insurance is much more important than the real number of damaged buildings, the development of the risk is remarkable. In contrast, the value exposure of accommo-dation facilities and buildings in the special risks category decreased significantly during the same period. The erec-tion of one relatively expensive commercial building in the area affected by a 300-year avalanche event was noticeable, corresponding to approximately one third of the total initial risk (33.5%).
3.2 Permanent residential population in buildings
The number of the resident population affected by the differ-ent avalanche scenarios is presdiffer-ented in Table 2 and Fig. 4. The buildings were split into the categories described above, whereas agricultural buildings and other buildings are miss-ing due to the fact that they do not contain any livmiss-ing space.
In the year 1950, 591 people resided inside the area af-fected by a 30-year avalanche. In the year 2000, after the implementation of mitigation measures and the consequent reduction in the accumulation areas, 87 residents remained. The risk reduction for the 30-year scenario amounted to 85.3%, which was the highest risk reduction, when compared to the other scenarios. In the hotel and guest houses category and the commercial buildings category, the risk reduction amounted to 100%. In the residential buildings category, it amounted to only 77%, and in that of the special risks to 90%. Inside the area affected by a 100-year avalanche event, 903 persons were resident in the year 1950. In the year 2000, there were only 738, which is a decrease of 18.3%. If there had not been an aggregation and extension of the building
S. Fuchs et al.: Development of avalanche risk between 1950 and 2000 271
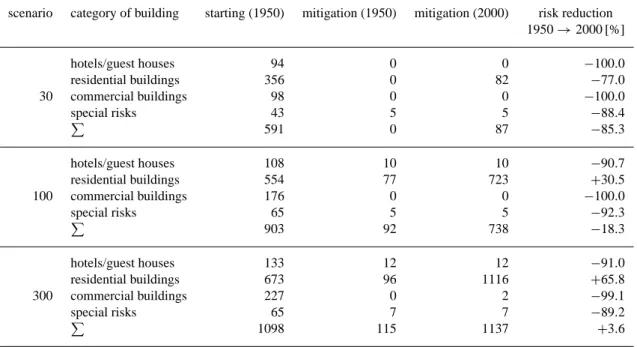
Table 2. Absolute number and relative change in the resident population of the buildings affected by the scenarios (30-, 100- and 300-year
avalanche), subdivided into the different building categories: accommodation facilities (hotels and guest houses, without number of beds and employees), residential buildings, commercial buildings and extraneous risks (special risks). In addition to the scenarios 1950 (starting 1950) and 2000 (mitigation 2000), the number of persons resident in those buildings in the scenario 2000 that were built before 1950 (mitigation 1950) is illustrated.
scenario category of building starting (1950) mitigation (1950) mitigation (2000) risk reduction 1950 → 2000 [%] hotels/guest houses 94 0 0 −100.0 residential buildings 356 0 82 −77.0 30 commercial buildings 98 0 0 −100.0 special risks 43 5 5 −88.4 P 591 0 87 −85.3 hotels/guest houses 108 10 10 −90.7 residential buildings 554 77 723 +30.5 100 commercial buildings 176 0 0 −100.0 special risks 65 5 5 −92.3 P 903 92 738 −18.3 hotels/guest houses 133 12 12 −91.0 residential buildings 673 96 1116 +65.8 300 commercial buildings 227 0 2 −99.1 special risks 65 7 7 −89.2 P 1098 115 1137 +3.6
development between the years 1950 and 2000, the number of persons would have been reduced to 92, which would cause a theoretical risk reduction of 89.9%. This clearly demonstrates the increase in damage potential due to the de-velopment of the settlement topology. Within the hotel and guest houses category and the special risks category, the risk was reduced by more than 90%. In the residential buildings category, an increase in risk of 30.5% was detectable. This development corresponds to that of the number of buildings, though the latter increased even more. This is a clear evi-dence that nowadays there are fewer residents per building than in the year 1950.
Inside the area of a 300-year avalanche event, 1098 per-sons resided in the year 1950. In the year 2000, there were 1137 persons, which was an increase in risk of 3.6%. In the commercial buildings category, the decline in risk was almost 100%. Within the hotel and guest houses category, there is, once again, a risk reduction of about 90%, as is the case in the special risks category, while in the category re-lating to residential buildings, there is an increase in risk of about 65.8%. This development correlates, once again, with that of the number of buildings.
It is apparent that with the extension of the scenarios from 30 years to 300 years and the consequent extension of the po-tential accumulation areas, the total risk reduction is decreas-ing. From this, it can be deduced that the building structure becomes sparse in direction towards the transit areas. Fur-thermore, the typical local mixed structure of development is
increasingly superseded by smaller accommodation units. In contrast, the (statistically) relatively rare event of a 300-year avalanche shows a very high damage potential nowadays, de-spite the realisation of mitigation measures and the conse-quent reduction in the accumulation areas. According to the method applied in this study the damage potential of residen-tial areas seems to be also very high.
Regarding the absolute number of persons in residential buildings for the year 2000, the risk associated with one 300-year event was 14 times higher than the risk related to one 30-year event. This means that the risk associated with the 300-year event is almost 1.4 times higher than the risk related to one 30-year event, which fits ten times into a 300-year event. For the 100-year event, this relationship is more unfavourable: here, the risk is 2.7 times higher than that of a 30-year event, based on an observation period of 100 years. From this, it can be concluded that the risk asso-ciated with the 100-year event is the most unfavourable, fol-lowed by that of the 300-year event. For the 30-year event, a relatively low risk can be detected, although 2.7 persons are still endangered on average per year. Considering fa-tality rates of 46% inside buildings (Wilhelm, 1997a), this means 1.2 demises per year; for the 300-year scenario, this value amounts to 1.7 persons. The scenario for the 100-year recurrence interval leads to 3.4 demises per year. Consid-ering those values, it is obvious that temporary preventive measures, such as evacuations, play a key role in the reduc-tion of the risk. At this point it has to be emphasised that,
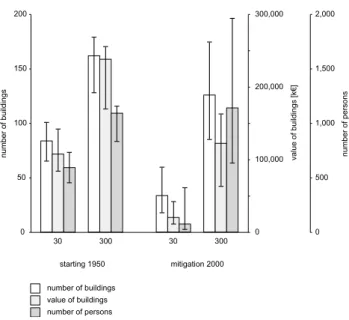
0 50 100 150 200 0 100,000 200,000 300,000
number of buildings value of buildings [k
€ ] 0 500 1,000 1,500 2,000 number of persons starting 1950 30 300 30 300 mitigation 2000 number of buildings value of buildings number of persons
Fig. 5. Illustration of the range of the 30- and 300-year scenarios of
all buildings according to the error bars on the basis of a 95% con-fidence interval for the avalanche runout length taking into account a variation of ±20 m (30 years) and ±30 m (300 years). A decrease in potential damage is detectable comparing the scenarios starting 1950 and mitigation 2000. The error increased remarkably in the rare event of the scenario mitigation 2000, which can be ascribed to the development of buildings within the avalanche prone areas until the year 2000.
because of the methodology used in the study, these values tend to be on the high side. This is due to the exclusion of reduction factors from the risk formula. Generally, the fatal-ity rate of 46% for people buried in buildings also seems to be relatively high. However, this value is generated from the database of destructive avalanches at the SLF Davos, when searching for the average risk to a person of being killed dur-ing an avalanche event that buries and damages a builddur-ing. However, as already mentioned in Sect. 2.5, 21 persons were killed during the investigation period, which corresponds to an average fatality rate of 0.42 per annum.
3.3 Error bars
The modelling of avalanche scenarios is affected by uncer-tainties, which can be divided into two groups: those result-ing from model parameters and those resultresult-ing from the input parameters used.
Regarding the input parameters of the models, the uncer-tainties are linked, in particular, to the adequate choice of the values for the friction parameters µ and ξ , although a specific combination of these parameters is found to be more suitable than others (see Christen et al., 2002b). Models are always subjective formations of the cognition of an objective reality (Ninck, 1994). Thus, a model is an attempt to describe a sys-tem, and is consequently only one possible reproduction of this system. Since the relationships within a system are very complex, they cannot be described completely. Therefore,
only those characteristics of a system that are thought to be relevant to the problem are extracted. This leads to an ac-centuation of certain characteristics and a rejection of others (K¨orner, 1980).
Fracture depth and release area are the important input pa-rameters in avalanche modelling. In fact, both variables are measurable, but the determination of the possible extent of the release area, and the average fracture depth as a function of the recurrence probability of a certain snow height are still afflicted with uncertainties (Barbolini et al., 2002). To obtain information concerning the snow height, the application of the extreme value statistics by Gumbel to the possible max-imum new snow height within three days is normally rec-ommended to extrapolate rare snowfall events (Burkard and Salm, 1992). However, as the measurements of the obser-vation stations for snow data date back only 70 years as the most, the extrapolation of rare events can be faulty. Further sources of error are the inadequate consideration of possible snowdrift when defining the fracture depth, and the correc-tion factor for the altitude, which is required in order to esti-mate the local precipitation height (Barbolini et al., 2002).
In the present treatise, the range resulting from those un-certainties within the avalanche accumulation areas is used following the suggestions in Barbolini et al. (2002) on the basis of a 95% confidence interval. The 30-year event is cal-culated, as an example, on the basis of a variation in the ac-cumulation length of ±20 m, and the 300-year event is calcu-lated on the basis of ±30 m. Thus, substantial ranges occur in both the existent insured values inside the hazard area and the number of persons present therein (see Fig. 5 for a sum-mary of all scenarios and Fig. 6 for the residential buildings). It is remarkable that the mean variation within the area of the starting scenario (1950) is less than that in the area of the mitigation scenario (2000). Within the starting scenario, the numbers for buildings, values and number of persons scat-ter at about plus/minus one third of the effective calculated numbers. In the area of the mitigation scenario, which rep-resents the present state in the municipality of Davos, the variations are much higher. Here, the sensitivity of the red hazard zone becomes apparent: when expanding this zone by 20 m, the number of the endangered buildings increases by a factor of 1.8, and the insurance value increases by a factor of 2.1. The risk for persons is 4.6 times higher. In con-trast, when reducing the area by 20 m in the direction of the release zone, the result for the number of endangered build-ings is halved, the insurance value amounts to 60% of the starting risk, and the number of persons to 40%. Concerning the 300-year scenario, the relative values scatter much less. However, regarding absolute numbers, high fluctuations oc-cur within the scenario “mitigation 2000”, which can be at-tributed to the high concentration of assets in Davos in these days. This means that the results are highly sensitive to small changes within the accumulation areas, a fact which must be considered when interpreting the results.
In contrast to this, the consideration of reduction factors in the risk formula (see Eq. 1) seems to have a rather small influence on the range of the results. Since the 1980s it
S. Fuchs et al.: Development of avalanche risk between 1950 and 2000 273 is standard practice to prescribe mandatory reinforcement
structures for building projects within endangered areas. In Davos, these regulations are applicable to those 15% of all buildings which were erected after 1980 within the areas of a 300-year avalanche event (blue hazard zone).
Assuming that such reinforced buildings are able to resist to the design event, the risk would, at the most, decline by about 15%. On the scale used in this investigation, a change of this size is to be considered negligible, when taking into account the scattering of the results due to the flexible defi-nition of the extent of the hazard zones by ±30 m.
3.4 Temporary population in accommodation facilities and
spa tourism
The number of persons at risk in hotels, guest houses and spa clinics decreased remarkably between the years 1950 and 2000. This is mainly due to the reduction in the avalanche runout zones. Since 1950, the number of sanatoriums has de-creased and the number of accommodation facilities has in-creased, since nearly all former sanatoriums have been trans-formed into hotels or guest houses.
The 1950 scenario includes 1041 guest beds in hotels and 1851 beds in sanatoriums. The average utilisation rate of the hotel and restaurant industry can no longer be determined for the winter season in 1950, so it was calculated using today’s value of 60% (Davos Tourist Board, 2002, pers. comm.). The average utilisation of the clinic facilities was 83.7% in the year 1950 (Kurverein Davos, 1951). Thus, in the year 1950, 625 guests in hotels and 1550 guests in sanatoriums were within endangered areas. Including employees, 750 persons were endangered in accommodation areas and 2590 persons in spa resorts.
In the year 2000, only 81 guest beds in the hotel and guest houses category were situated in endangered areas. Assum-ing an utilisation of 60% durAssum-ing the winter season, and takAssum-ing account of employees, this amounted to 59 persons. Sanato-riums were no longer endangered. Subdividing the utilisa-tion within the winter season into months, it became evident that the peaks in utilisation were during the Christmas period and towards the end of February. According to the analysis of the avalanche bulletin of the SLF, these periods coincided exactly with periods when there was an above-average occur-rence of days with high avalanche danger. As a result, risk peaks arose, but they did not appear as serious when consid-ering the consequences in the year 2000 as they had been in the year 1950.
4 Conclusions
In the previous sections, the development of avalanche risk in the settled area of the municipality of Davos, Grisons, Switzerland, was presented. The investigation focused on the risk to buildings and persons between the years 1950 and 2000. It has been demonstrated that contrary to the assump-tion that the vulnerability of the community has increased,
0 50 100 150 0 50,000 100,000 150,000
number of residential buildings value of residential buildings [k
€ ] 0 500 1,000 1,500 2,000 number of persons starting 1950 30 300 30 300 mitigation 2000 number of residential buildings
value of residential buildings number of persons
Fig. 6. Illustration of the range of the 30- and 300-year scenarios
concerning residential buildings according to the error bars on the basis of a 95% confidence interval for the avalanche runout length taking into account a variation of ±20 m (30 years) and ±30 m (300 years). A decrease in potential damage is detectable regarding small recurrence intervals, while a remarkable increase is detectable regarding rare events. The error increased fundamentally in the sce-nario mitigation 2000, which can be ascribed to the development of buildings within the avalanche prone areas until the year 2000.
the risk in fact decreased fundamentally, even if Davos is a center of winter sports and home to a remarkable number of sanatoriums. The sole exception regarding the development of risk was in the category of residential buildings, where an increase in risk was already detectable at medium recurrence intervals (100 years).
Presenting the risk spatially, it was evident that the major problem areas occur outside the so-called red hazard zone, which represents the outer line of an 30-year avalanche event. In this area, the erection of new buildings is forbidden by law. All buildings within the area of the 30-year scenario were erected before the building ban was implemented. The increased risk in the range of the 100-year scenario and the 300-year scenario can be ascribed to the fact that certain re-quirements, such as reinforced walls, are prescribed when building in those areas. However, there is no general pro-hibition of building development. Furthermore, almost 70% of the buildings in those areas were erected before the intro-duction of hazard maps and the appropriate implementation rules (65 residential buildings, with a total insured value of EUR 53 498 000).
When considering the development of risk to persons, the problem arises that, for seasonal reasons, the number of per-sons in the area reaches its peak just in wintertime nowadays. In contrast, in the year 1950, the main part of the risk was generated as a result of the numerous endangered sanatori-ums. Though the absolute number of endangered persons declined by 95% in the period under consideration, certain
risk peaks have to be assumed within this risk category. As a result, mitigation strategies such as the short-term evacuation of persons or the temporary closure of roads play a major role in reducing risk.
The principal development of risk within the scenar-ios showed that relatively frequent events tend to result in smaller risk than rare events with grave effects. This shows that the construction of avalanche defence structures to re-duce the accumulation areas has contributed greatly to the reduction of risk from frequent events. Compared with the situation in the year 1950, the remaining risk in the year 2000 was comparatively small. Since the introduction of the haz-ard maps, and the building ban resulting from it, the damage potential within the range of a 30-year avalanche event need not increase in the future. Thus, the remaining risk in those areas can be interpreted as socially accepted residual risk. With regard to the resident population, the remaining risk amounts to 1.3 demises per year, expressed as PML, which is according to the predefined assumptions in this study a high value compared with other risks. The corresponding PML for damage to buildings was 1.1 in figures and EUR 650 000 in actuarial value.
The investigation provides specific information regarding the development of avalanche risk in the municipality of Davos, Grisons, Switzerland. General statements referring to a larger area (canton, country) might be difficult to make, since small-scale disparities have a very important influence on the diversification of risk. The spatial distribution of dam-age potential is heavily influenced by the historical growth of settlements on the one hand and modern methods of spatial planning on the other hand. The historical development of the settlement is determined by the availability of suitable areas for development and land ownership patterns. Nowa-days it is mainly instruments of spatial planning that are used to structure this historically determined development, result-ing in the fact that certain decisions made in recent decades, relating to the choice of settlement locations, cannot be cor-rected any more. In the whole Alpine area, there are only very few examples of hazard-induced resettlements, for ex-ample the hamlet Untervalzur in the Paznaun valley in Aus-tria.
The results presented are restricted to the predefined as-sumptions. Due to existent uncertainties, the risk formula was reduced to the product of a defined recurrence interval and the corresponding extent of damage, whereas the latter was evaluated under consideration of PML. Consequently, the obtained risk represents an upper limit, which might be fallen below when taking into account the other factors pre-sented in Eq. (1). Nevertheless, the determination of tem-poral changes of PML leads to a better understanding of the development of risk in settlements. Additionally, the calcula-tion of error bars has shown how sensitive the determinacalcula-tion of damage potential reacts on small changes in the length of the avalanche runout zones. This clarifies that the results of risk analyses should contain, apart from an accurate value, the size of the range.
Since the vulnerability of buildings towards avalanches could only roughly be estimated until now, there is a par-ticular need for future research in this area. Furthermore, a level of the socially accepted risk has to be defined. Only then it can be ascertained whether or not there is a need for action due to the probable exceedance of the risk level. Acknowledgements. The authors want to thank two anonymous
reviewers for their suggestions improving the paper and P. Barnett from the University of Applied Sciences, Winterthur, for improve-ments to earlier versions of the English manuscript. M. Fischer of the GVA building insurance company of Grisons provided the necessary database. The research for this paper was partly carried out with the support of a grant from Munich Re reinsurance company, Germany.
Edited by: T. Glade
Reviewed by: H. Staftler and another referee
References
Adams, J.: Risk, Routledge, London, 1995.
Ammann, W.: Integrales Risikomanagement - der gemeinsame Weg in die Zukunft, B¨undnerwald, 5, 14–17, 2001.
Barbolini, M., Natale, L., and Savi, F.: Effects of release conditions uncertainty on avalanche hazard mapping, Natural Hazards, 25, 225–244, 2002.
Bartelt, P., Salm, B., and Gruber, U.: Calculating Dense-Snow Avalanche Runout Using a Voellmy-Fluid Model with Ac-tive/Passive Longitudinal Straining, J. Glaciol., 45, 150, 242– 254, 1999.
BfS (Swiss Federal Statistical Office) (ed.): Statistisches Jahrbuch der Schweiz 2001, Verlag Neue Z¨uricher Zeitung, Z¨urich, 2001. BfS (Swiss Federal Statistical Office): Krankenhausstatistik, http://www.statistik.admin.ch/stat ch/ber14/gewe/dtfr14i.htm, 20.07.2003.
Borter, P.: Risikoanalyse bei gravitativen Naturgefahren, Umwelt-Materialien, 107/I, II, BUWAL, Bern, 1999.
Burkard, A. and Salm, B.: Die Bestimmung der mittleren An-rissm¨achtigkeit d0 zur Berechnung von Fliesslawinen,
Eid-gen¨ossisches Institut f¨ur Schnee- und Lawinenforschung, Davos, Interner Bericht, 668, 1992.
Burton, I., Kates, R., and White, G.: The Environment as Hazard, The Guilford Press, New York, 1993.
Christen, M., Bartelt, P., and Gruber, U.: AVAL-1D: An Avalanche Dynamics Program for the Practice, Proc. INTERPRAEVENT 2002 in the Pacific Rim – Matsumoto, Oct. 14–18, 2002, 2, 715– 725, 2002a.
Christen, M., Bartelt, P., and Gruber, U.: AVAL-1D, Numerische Berechnung von Fliess- und Staublawinen, Manual zur Software, Eidgen¨ossisches Institut f¨ur Schnee- und Lawinenforschung, Davos, 2002b.
Cutter, S.: Vulnerability to Environmental Hazards, Progr. Human Geogr., 20, 4, 529–539, 1996.
Fell, R.: Landslide Risk Assessment and Acceptable Risk, Can. Geotech. J., 31, 261–272, 1994.
F¨orster, M.: Ausf¨uhrliche Dokumentation ausgew¨ahlter Staubla-winenereignisse und Bestimmung ihrer Eingangsparameter f¨ur die Verifikation von Staublawinenmodellen, Eidgen¨ossisches Institut f¨ur Schnee- und Lawinenforschung, Davos, Interner Bericht, 730, 2000.
S. Fuchs et al.: Development of avalanche risk between 1950 and 2000 275
Hollenstein, K.: Analyse, Bewertung und Management von Natur-risiken, vdf-Hochschulverlag, Z¨urich, 1997.
Issler, D.: Modelling of Snow Entrainment and Deposition in Powder-Snow Avalanches, Ann. Glaciol., 26, 253–258, 1998. J´onasson, K., Sigurdsson, S., and Arnalds, T.: Estimation of
Avalanche Risk, Icelandic Meteorological Office, Reykjavik, 1999.
Kates, R.: Natural Hazard in Human Ecological Perspective: Hy-potheses and Models, Econ. Geogr., 47, 438–451, 1971. Kates, R. and Kasperson, J.: Comparative Risk Analysis of
Techno-logical Hazards (A Review), Proc. Natl. Acad. Sci. U.S.A., 80, 7027–7038, 1983.
Keylock, C. and Barbolini, M.: Snow Avalanche Impact Pres-sure – Vulnerability Relations for Use in Risk Assessment, Can. Geotech. J., 38, 2, 227–238, 2001.
Keylock, C., McClung, D., and Magn´usson, M.: Avalanche Risk Mapping by Simulation, J. Glaciol., 45, 150, 303–314, 1999. K¨orner, H.: Modelle zur Berechnung der Bergsturz- und
Lawinen-bewegung. Proc. INTERPRAEVENT – Bad Ischl, 8–12 Septem-ber 1980, 2, 15–55, 1980.
Kurverein Davos: Gesch¨aftsbericht 1950/51, Kurverein, Davos, 1951.
Laternser, M. and Schneebeli, M.: Temporal Trend and Spatial Distribution of Avalanche Activity During the Last 50 Years in Switzerland, Natural Hazards, 27, 201–230, 2002.
Morgan, G., Rawlings, G., and Sobkowicz, J.: Evaluating To-tal Risk to Communities from Large Debris Flows, Proc. 1st Canadian Symposium on Geotechnique and Natural Hazards, Geotechnique and Natural Hazards – Vancouver, BC, Canada, 6–9 May 1992, 225–236, 1992.
Munich Re : Topics – Annual Review: Natural Catastrophes 2001, Munich Re, Munich, 2002.
Ninck, A.: Wissensbasierter und objektorientierter Ansatz zur Simulation von Mensch-Umwelt-Systemen, Geographica Bernensia, G43, 1–154, 1994.
Noethiger, C., Elsasser, H., Br¨undl, M., and Ammann, W.: Indi-rekte Auswirkungen von Naturgefahren auf den Tourismus – Das Beispiel des Lawinenwinters 1999 in der Schweiz, Geogr. Helv., 2, 91–108, 2002.
Norem, H.: Shear Stresses and Boundary Layers in Snow Avalanches, Norwegian Geotechnical Institute, Oslo, Technical Report 581240–3, 1995.
Renn, O.: Individual and Social Perception of Risk, in: ¨
Okologisches Handeln als sozialer Prozess, edited by Fuhrer, U., Birkh¨auser, Basel, 27–50, 1995.
Ritzmann-Blickenstorfer, H.: Historische Statistik der Schweiz, Chronos, Z¨urich, 1996.
Schneebeli, M., Laternser, M., F¨ohn, P., and Ammann, W.: Wech-selwirkungen zwischen Klima, Lawinen und technischen Mass-nahmen, vdf-Hochschulverlag, Z¨urich, 1998.
SLF: Neue Berechungsmethoden in der Lawinenge-fahrenkartierung, Kursunterlagen, Eidgen¨ossisches Institut f¨ur Schnee- und Lawinenforschung, Davos, 1999.
SLF: Der Lawinenwinter 1999, Eidgen¨ossisches Institut f¨ur Schnee- und Lawinenforschung, Davos, 2000.
Slovic, P.: Trust, Emotion, Sex, Politics, and Science: Surveying the Risk-Assessment Battlefield, Risk Analysis, 19, 4, 689–701, 1999.
United Nations: Living with Risk, A Global Review of Disaster Reduction Initiatives, Preliminary Version (July 2002), United Nations, Geneva, 2002.
Varnes, D.: Landslide Hazard Zonation: a Review of Principles and Practice, UNESCO, Paris, 1984.
Wilhelm, C.: Wirtschaftlichkeit im Lawinenschutz, Mitt. Eid-gen¨ossisches Institut f¨ur Schnee- und Lawinenforschung, 54, Davos, 1997a.
Wilhelm, C.: Zur Entwicklung des Lawinenrisikos in der Schweiz, Proc. Risikobewertung und Naturraumpr¨avention von Wildb¨achen und Lawineneinzugsgebieten – Universit¨at f¨ur Bo-denkultur Wien, 24–25 September 1997, 112–127, 1997b.