HAL Id: hal-01499475
https://hal-amu.archives-ouvertes.fr/hal-01499475
Submitted on 18 Apr 2018HAL is a multi-disciplinary open access archive for the deposit and dissemination of sci-entific research documents, whether they are pub-lished or not. The documents may come from teaching and research institutions in France or abroad, or from public or private research centers.
L’archive ouverte pluridisciplinaire HAL, est destinée au dépôt et à la diffusion de documents scientifiques de niveau recherche, publiés ou non, émanant des établissements d’enseignement et de recherche français ou étrangers, des laboratoires publics ou privés.
3D-printed flow system for determination of lead in
natural waters
Elodie Mattio, Fabien Robert-Peillard, Catherine Branger, Kinga Puzio,
André Margaillan, Christophe Brach-Papa, Joël Knoery, Jean Luc Boudenne,
Bruno Coulomb
To cite this version:
Elodie Mattio, Fabien Robert-Peillard, Catherine Branger, Kinga Puzio, André Margaillan, et al.. 3D-printed flow system for determination of lead in natural waters. Talanta, Elsevier, 2017, 168, pp.298-302. �10.1016/j.talanta.2017.03.059�. �hal-01499475�
3D-printed flow system for determination of lead in natural waters
1 2
Elodie Mattio1, Fabien Robert-Peillard1, Catherine Branger2, Kinga Puzio2, André Margaillan2, 3
Christophe Brach-Papa3, Joël Knoery3, Jean-Luc Boudenne1, Bruno Coulomb1*
4
1 Aix Marseille Univ, LCE, UMR 7376, Marseille, France.
5
2 University of Toulon, MAPIEM, La Garde, France.
6
3 IFREMER, LBCM, Nantes, France.
7
*Corresponding author: [email protected]
8 9
Abstract
10
The development of 3D printing in recent years opens up a vast array of possibilities in the field 11
of flow analysis. In the present study, a new 3D-printed flow system has been developed for 12
the selective spectrophotometric determination of lead in natural waters. This system was 13
composed of three 3D-printed units (sample treatment, mixing coil and detection) that might 14
have been assembled without any tubing to form a complete flow system. Lead was determined 15
in a two-step procedure. A preconcentration of lead was first carried out on TrisKem Pb Resin 16
located in a 3D-printed column reservoir closed by a tapped screw. This resin showed a high 17
extraction selectivity for lead over many tested potential interfering metals. In a second step, 18
lead was eluted by ammonium oxalate in presence of 4-(2-pyridylazo)-resorcinol (PAR), and 19
spectrophotometrically detected at 520 nm. The optimized flow system has exhibited a linear 20
response from 3 to 120 µg.L-1. Detection limit, coefficient of variation and sampling rate were
21
evaluated at 2.7 µg.L-1, 5.4% (n=6) and 4 sample.h-1, respectively. This flow system stands out 22
by its fully 3D design, portability and simplicity for low cost analysis of lead in natural waters. 23
24
Keywords: Lead determination; 3D-printed MPFS system; stereolithography; natural waters 25
1
1. Introduction
2
Lead is considered as one of the most toxic heavy metals [1] in the light of its environmental 3
[2] and health [3,4] impacts; it may cause irreversible neurological effects and digestive and 4
kidney malfunctions. Its presence in the environment and more particularly in water can be 5
mainly explained by anthropogenic sources like paints, arms and electronic [5] industries 6
products. For these reasons, the World Health Organization has identified lead as one of the 10 7
chemicals of major public health concern [6] and has recommended a guideline value of 10 8
μg.L-1 of lead in drinking water. It is therefore necessary to quantify lead by a rapid and efficient
9
method to avoid toxic consumption. 10
Many methods are already available for lead determination such as spectrophotometry [7], 11
voltammetry [8,9], graphic furnace atomic absorption spectrometry [10], or inductively coupled 12
plasma spectroscopy [11,12], but they require costly and sophisticated devices and do not allow 13
real-time and on-site measurements. In this context, mesofluidic and microfluidic systems can 14
help to meet these needs thanks to their intrinsic advantages: miniaturization and low energy 15
consumption, decreased reagents consumption and waste generation. Flow analysis offers many 16
opportunities [13,14] and Flow Injection Analysis (FIA), Sequential Injection Analysis (SIA) 17
or MultiSyringe Flow Injection Analysis (MSFIA) based systems have been successfully 18
applied for the determination of a wide range of substances in environmental matrices. Among 19
flow analysis system, pulse flow systems using solenoid diaphragm micropumps (MPFS: Multi 20
Pumping Flow System) present high flexibility, easy configuration and low cost. Another 21
advantage is that the signal peaks are higher compared to other flow techniques, due to 22
turbulences created by pump diaphragm strokes, which improve mixing between reagents and 23
sample [15]. Recently, such MPFS systems were developed for phosphorous [16] or boron [17] 24
determination in aqueous samples. 25
Several units can be combined to create a flow system in full compliance with the analytical 1
needs: solid phase extraction for pre-concentration, photo-oxidation or digestion, membrane or 2
membrane-less separation, detection and many others. To increase versatility and ease of 3
fabrication of flow systems, 3D printing is increasingly used in flow analysis [18,19]. This 4
printing technology can be divided into three main categories: Fused Deposition Modeling 5
(FDM) where a thermoplastic material is heated and extruded from a XYZ positionable nozzle, 6
Multi Jet Modeling (MJM) which is based on an inkjet head to deposit liquid photopolymer 7
(plastic resin or casting wax) layer by layer and finally stereolithography (SL) [20] invented in 8
the 1980s and which is a layer manufacturing process with liquid materials [21] as MJM. SL is 9
based on a mobile platform which dives in a resin tray, where a laser polymerizes the resin layer 10
by layer. The most frequently used material is poly(methyl methacrylate) (PMMA) which 11
allows to decrease fabrication cost and improve resolution [22]. 3D-printing technologies 12
emergence enables creation of new type of units [23,24] for microfluidic systems which can be 13
imagined and combined according to the analytical needs. 14
In this paper, the development of a novel 3D-printed multi-pumping flow system for the 15
determination of lead in natural waters is presented. The system is composed of three 3D-16
printed units: a resin column for lead solid phase extraction, a mixing coil and a classical flow 17
cell for UV-Spectroscopy. The 3 modules are connected to one another by a screw system to 18
limit tubings between the three units. Lead solid phase extraction is based on a commercial 19
crown-ethers resin (TrisKem Pb resin) and the chromogenic reagent used for the 20
spectrophotometric detection of lead is 4-(2-pyridylazo)resorcinol (PAR). The system was 21
applied to the determination of lead in real river water samples. 22
23
2. Materials and methods
24
2.1.Reagents and samples 25
All chemicals used were of analytical grade and used without further purification. Solutions 1
were prepared with ultra-pure water (Millipore, resistivity > 18 MΩ cm) and stocked in high 2
density polyethylene flasks. Lead standard solutions were prepared by dilution of a commercial 3
1 g.L-1 AAS lead stock solution (Fisher Chemical, USA) and stabilized with 1% v/v nitric acid
4
trace metal grade (Fisher Chemical, USA). A multi-metal solution (0.037 mmol.L-1 for each 5
metal) was prepared by dissolving appropriate amounts of lead nitrate and cadmium nitrate 6
(Alfa Aesar, USA), nickel nitrate and copper nitrate (Merck, Germany), iron (III) sulphate and 7
potassium chromate (VI) (Prolabo, France), cobalt nitrate, zinc nitrate, and aluminium chloride 8
(Sigma-Aldrich, USA) in ultra-pure water. 9
The commercial TrisKem Pb Resin (PB-B25-S, 50-100µm, TrisKem, France) was used for lead 10
extraction. The elution solution was prepared from ammonium oxalate (Prolabo, France). For 11
detection, a 0.01 mmol.L-1 solution of 4-(pyridyl-2-azo)-resorcinol (PAR) monosodium salt 12
(Merck, Germany) was prepared in a 1 mmol.L-1 borate buffer solution (pH = 12). 13
Freshwater samples were collected at purposely chosen points in a coastal river “The Arc” in 14
the south-east of France, near industrial or urban effluents discharge points. All samples were 15
UV-photo-oxidized with a 254 nm low-pressure mercury lamp (UVP PenRay, USA) during 30 16
minutes before analysis allowing liberation of lead linked to natural organic ligands, inorganic 17
ligands or even to anthropogenic organic ligands. 18 19 2.2.Apparatus 20 2.2.1. Flow system 21
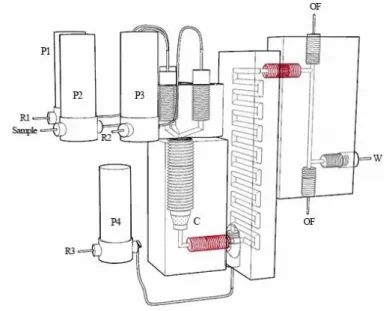
The three units of the MPFS system (Fig. 1) were designed with Rhinoceros® 5.0 3D software 22
(Robert McNeel & Associates Europe, Spain), then printed with a poly(methyl methacrylate) 23
resin on the 3D printer Form1+ (Formlabs, USA). The first unit consisted of a resin column, 24
tightly closed by a screw piece with three entry channels for injection of sample and reagents. 25
The resin was packed in this unit between two layers of glass wool. To optimize mixing of 1
eluate and chromogenic reagent used for lead detection (PAR), a second unit composed of a 2
serpentine mixing coil (1.5 mm internal diameter, 50 cm length) and of a connection for PAR 3
inlet was added to the system. Finally, the detection step was performed with a classical 4
spectroscopic flow-cell with a 5-cm optical pathlength. Sample and reagents were introduced 5
inside the system by means of four solenoid micro-pumps (Bio-ChemValve Inc., USA) that had 6
a stroke volume of 20 µL and a high frequency of 250 cycles/min. These pumps were computer-7
controlled by a MCFIA/MPFS system (Sciware, Spain) with eight digital 12V output channels. 8
For the detection, two FC-UV600 optical fibres (Ocean Optics, USA) were connected at the 9
ends of the optical pathlength, and isolated from the reaction mixture with two tailor-made 10
quartz discs, to guide the light from the source to the spectrophotometric detector. The radiation 11
of the halogen bulb of a DH-2000 UV-Vis light source (Ocean Optics, USA) was transmitted 12
to a USB2000 miniature spectrometer detector (Ocean Optics, USA). The whole system was 13
controlled by AutoAnalysis 5.0 software (Sciware, Spain). 14
15
2.2.2. Metal analysis 16
Graphite furnace atomic absorption spectrometry (GF-AAS) was used to optimize the 17
extraction/elution steps on TrisKem Pb resin and validate lead amounts in real samples (after 18
filtration on a 0.45 µm polyethersulfone membrane). The measurements were carried out on a 19
Thermo Scientific ICE3500 (USA) atomic absorption spectrometer equipped with a lead 20
hollow-cathode lamp operated at 10 mA (wavelength of 217 nm). Argon flow was 0.2 L.min-1
21
except during atomisation step (no flow). The furnace settings were: drying at 110 °C, ramp for 22
9 s, hold for 35 s; cracking at 800 °C, ramp for 5 s, hold for 20 s; atomising at 1200 °C, ramp 23
for 1 s and 3 s hold; cleaning at 2500 °C, no ramp and 3 s hold. 24
Interfering cations were determined by inductively coupled plasma–atomic emission 1
spectrometry (ICP–AES) with a Jobin YVON JY2000 Ultratrace spectrometer, equipped with 2
a CMA spray chamber and a Meinhard R50-C1 glass nebuliser. Determinations were performed 3
with the following settings: power 1000W, pump speed 20 mL.min-1, plasma flow rate 12
4
L.min-1, coating gas flow rate 0.2 L.min−1, nebuliser flow rate 0.9 L.min−1 and nebuliser 5 pressure 2.08 bar. 6 7 2.3.Flow procedure 8
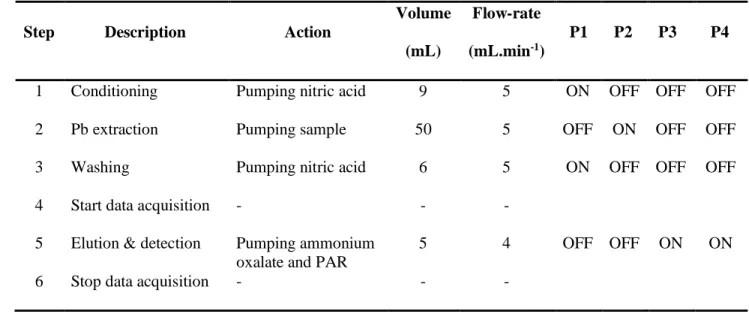
The MPFS system was operated according to the procedure in 6 steps given in Table 1: in step 9
1, 9 mL of nitric acid solution (0.05 mol.L-1) was used for conditioning the Pb resin and washing 10
the system before analysis. Then 50 mL of acidified sample were introduced in the system (step 11
2). In step 3, the resin was washed again with nitric acid solution (0.05 mol.L-1) to eliminate 12
potential interfering species extracted by the resin. 5 mL of ammonium oxalate solution (0.025 13
mol.L-1) and PAR (0.01 mmol.L-1) were simultaneously pumped through the resin to eluate
14
extracted lead and at the inlet of the mixing coil, respectively (steps 4-5). 15
Measurements were based on the peak height. The analytical signal was recorded at 520 nm 16
when the elution started. Absorbance spectra were acquired every 0.5 s, with an integration 17
time of 55 ms and an average of 3 spectra. 18
19
3. Results and discussion
20
3.1.Extraction and washing steps 21
3.1.1. Influence of concentration of nitric acid 22
The developed system was based on the spectrophotometric determination of lead in the 23
presence of PAR reagent. However, it is well known that lead determination by this simple 24
method often suffers from interferences of cadmium, copper and zinc [25]. Therefore, the 25
concentration of these interfering metals should be reduced before PAR detection to allow 1
selective determination of lead. 2
Lead determination was thus based on extraction properties of the resin TrisKem Pb resin. This 3
resin was initially developed for the separation of 210Pb and 210Po and is constituted by
crown-4
ethers diluted in isodecanol and impregnated on an inert support. The length of the carbon chain 5
of isodecanol facilitates lead elution. Its retention capacity is 29 mg Pb/g of resin. The 6
manufacturer's instructions recommend acidification of samples with 1 mol.L-1 nitric acid 7
before extraction of lead on TrisKem Pb resin. However, the first experiments carried out with 8
1 mol.L-1 nitric acid led, after a few injections, to yellowing and cracking of the inlet of
3D-9
printed column part. The effect of HNO3 concentration on the extraction of lead and potentially
10
interfering metals was thus tested in the range 0-0.1 mol.L-1 in order to preserve 3D-printed 11
parts. 12
The results in Fig. 2 showed that more than 90% of lead was extracted with HNO3 concentration
13
above 0.02 mol.L-1. The best lead extraction (97%) was obtained with HNO
3 0.1 mol.L-1.
14
Concerning the other metal cations, iron was also partially extracted (20-50%, with the highest 15
extraction at 0.1 mol.L-1). Aluminium, copper and zinc were not retained by the resin whatever 16
the acid concentration. For HNO3 concentrations of 0.02 and 0.05 mol.L-1, a very few amount
17
(≤ 5%) of cobalt, chromium, and cadmium was extracted. It can therefore be concluded that the 18
resin has an excellent selectivity for lead over other metals, except for iron for which extraction 19
is dependent on HNO3 concentration. A nitric acid concentration of 0.05 mol.L-1 appeared to
20
be sufficient to extract lead quantitatively and to limit the extraction rate of iron below 20%. 21
After metal extraction on the resin, a washing step can improve the selectivity by removing 22
potentially interfering metals without eluting the analyte of interest. This washing step has also 23
been studied with different HNO3 concentrations. Based on the previous results, only iron and
24
lead were studied. The washing solutions were collected and analysed by ICP-AES. As can be 25
seen in Fig. 3 the amount of both iron and lead washed out decreased with increasing HNO3
1
concentration. With HNO3 0.02 mol.L-1, all the iron retained within the resin was eliminated,
2
but an important lead elution rate of 42% was also observed. A nitric acid concentration of 0.05 3
mol.L-1 seems to be the best compromise between iron elimination (75%) and limited lead
4
elution rate (about 10%). 5
To summarize 0.05 mol.L-1 HNO3 may be used for both extraction and washing steps, thereby
6
limiting the number of pumps to be used in the system. 7
8
3.1.2. Sample flow-rate 9
Sample flow rate was studied from 2 to 5 mL.min-1 for a sample volume of 30 mL. Samples 10
were acidified with 0.05 mol.L-1 HNO3 before extraction. As displayed in supplementary
11
material (Fig. S1), results showed an important increase of lead extraction from 3 mL.min-1 to 12
5 mL.min-1. At the highest flow rate (5 mL.min-1) the extraction percentage of lead reached 94 13
%. 14
To avoid overpressure problem of solenoid pumps or clogging of resin column, the column 15
inner diameter and height has been set respectively at 7.8 mm and 4.5 mm, which are higher 16
than in a traditional packed column. None of the previously mentioned problems were observed 17
during analysis. Although solenoid pumps are not usually suitable for resin solid phase 18
extraction, it seems that high sample flow rates enable fluidizing of the resin bed and thus good 19
lead extraction. Therefore, a 5mL.min-1 flow rate was chosen for the system. 20
21
3.2. Elution step 22
Ammonium oxalate is recommended by the resin manufacturer for lead elution. The lead 23
elution has thus been studied at different concentrations of ammonium oxalate. The elution flow 24
rate has been adjusted at 4 mL.min-1, according to the resin manufacturer instructions. 25
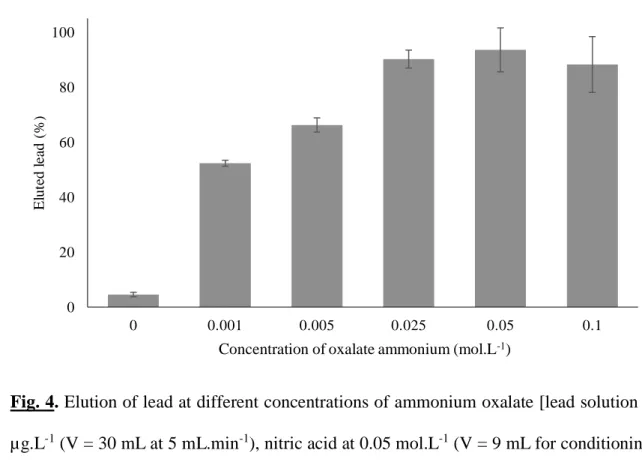
The results shown in Fig. 4 highlighted that elution efficiency increased with ammonium 1
oxalate concentration up to 0.05 mol.L-1. 2
For concentration of ammonium oxalate between 0.025 and 0.1 mol.L-1, the results obtained 3
were not significantly different. To limit reagent consumption, the concentration of ammonium 4
oxalatewas adjusted at 0.025 mol.L-1 for further experiments. 5
6
3.3. Detection 7
Lead elution profile has been studied by collecting small fractions (0.5 mL) of ammonium 8
oxalate used for elution with a flow rate of 5 mL.min-1. As can be seen on Fig.S2
9
(Supplementary material), elution was complete within one minute (elution rate of 99% of total 10
extracted lead after 5 mL). 11
Lead was detected by spectrophotometry using a PAR solution pumped simultaneously and 12
mixed with ammonium oxalate in the mixing coil. PAR solution was buffered with borate 13
solution at pH=12 in order to obtain a mixture at pH=9 (optimised for UV-Vis detection) when 14
mixed with ammonium oxalate which pH is around 6.6. 15
PAR reagent and ammonium oxalate flow rates were studied from 1 to 5 mL.min-1. 16
Optimization was carried out with a standard lead solution of 100 µg.L-1. PAR flow rate was 17
optimized using a fixed ammonium oxalate flow rate of 5 mL.min-1 and inversely. Fig. 5 showed 18
that the best absorbance was obtained with the maximum flow rate of the pumps useable for 19
the two reagents (5 mL.min-1). The absorbance increased regularly with increasing PAR flow 20
rate. The absorbance values increased slightly with an ammonium oxalate flow rate between 1 21
and 4 mL.min-1 and, strongly increased for a flow rate of 5 mL.min-1. This observation was 22
consistent with results obtained for sample flow rate with better efficiency at high flow rates. 23
However, eluent flow rate seemed to have less influence than sample flow rate. Flow rates of 24
PAR and ammonium oxalate were thus fixed at 5 mL.min-1. 25
1
3.4. Analytical features 2
Calibration curves have been constructed for various sample volumes (10, 25 and 50 mL). From 3
these data, limits of detection (LOD; 3; n=10) and coefficient of variation (CV; n=6) were 4
determined and summarized in Table S1 (Supplementary material). The analytical features 5
obtained for a 50 mL sample volume seemed adapted for typical lead concentrations in natural 6
waters: LOD was calculated at 2.7 µg.L-1, linear domain range was between 3 and 120 µg.L-1. 7
The LOD was acceptable for environmental sample analysis, but sample volume can potentially 8
be increased if lower LOD needs to be reached for water samples with very small amounts of 9
lead. An additional experiment has been carried out and a volume of 200 mL of sample has 10
been passed through the TrisKem Pb resin column. The results obtained showed that no traces 11
of lead were detected at the column outlet and that the breakthrough volume of the resin was 12
not reached. Coefficient of variation obtained with the optimal conditions (50 mL sample 13
volume), for a lead concentration of 50 µg.L-1 was 5.4 %. 14
A brief comparison of previously reported flow methods for lead determination with proposed 15
3D-printed flow system is given in Table 2. Some of these methods require complicated or 16
expensive equipment in particular for detection step [26,27,29,30]. Compared to other simpler 17
flow procedures using spectrophotometric detection [28,31], the proposed method has a lower 18
detection limit better suited for analysis of natural water samples. 19
20
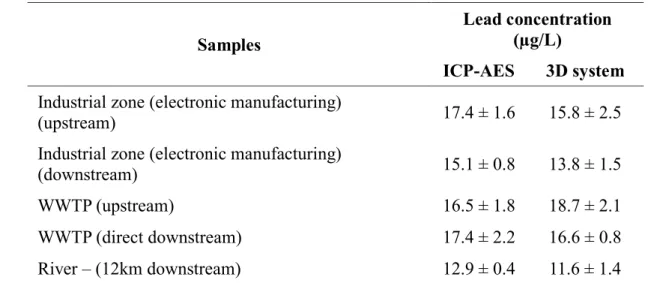
3.5. Validation 21
In order to validate the 3D-printed optimized system, five samples of freshwater have been 22
collected at purposely chosen points in a coastal river (“The Arc”, south of France) in areas 23
close to anthropogenic activities. The samples were UV-photooxidized at 254 nm during 30 24
minutes and filtered at 0.45 µm before analysis. These samples have been analyzed in duplicate 25
by ICP-AES and developed 3D-printed system with a sample volume of 50 mL, and the results 1
were summarized in Table 3. 2
The values obtained by the two methods were consistent. The mean difference between the two 3
methods was 5.8%, (min -11.2%; max 11.7%). The results obtained by the proposed system 4
were compared (t test) with the reference method values (ICP-AES) and no significant 5
differences at the 95% confidence level were found. 6
7
4. Conclusion
8
A 3D-printed system was developed for determination of lead in natural waters. Lead 9
quantification was based on the selective solid phase extraction of lead on TrisKem Pb resin 10
followed by elution with ammonium oxalate and spectrophotometric detection using 4-(2-11
pyridylazo)-resorcinol as chromophoric reagent. Interferences were eliminated by optimisation 12
of extracting and washing steps on TrisKem Pb resin. Detection limit obtained (2.7 µg.L-1) was 13
consistent with environmental samples analysis but sample volume may be increased if lower 14
detection limits are needed. The proposed flow system was compared to a reference method 15
(ICP-AES) and was satisfactorily applied to natural waters samples. The optimized 3D-printed 16
MPFS flow system could be controlled by an open-source microcontroller board to design a 17
low cost portable on-line analyzer [16,17]. 18
19
Acknowledgment
20
This work was included in the project “Lab-on-Ship” funded by the French Research Agency 21 (ANR-14-CE04-0004). 22 23 References 24 25
[1] R. Garnier, Toxicité du plomb et de ses dérivés, EMC - Toxicologie-Pathologie. 2 (2005) 1
67–88. 2
[2] M. Dikilitas, S. Karakas, P. Ahmad, Chapter 3 - Effect of Lead on Plant and Human DNA 3
Damages and Its Impact on the Environment, in: Plant Metal Interaction, Elsevier, 2016: pp. 4
41–67. 5
[3] D.R. Juberg, Lead and human health: An update, Am Cncl on Science, Health, 2000. 6
[4] F.M. Johnson, The genetic effects of environmental lead, Mutation Research 410 (1998) 7
123–140. 8
[5] M. Pecht, Y. Fukuda, S. Rajagopal, The impact of lead-free legislation exemptions on the 9
electronics industry, IEEE Transactions on Electronics Packaging Manufacturing 27 (2004) 10
221–232. 11
[6] World Health Organization | Lead poisoning and health, WHO. 12
http://www.who.int/mediacentre/factsheets/fs379/en/ (accessed November 10, 2016). 13
[7] I. Rahman, Y. Furusho, Z. Begum, R. Sato, H. Okumura, H. Honda, H. Hasegawa, 14
Determination of lead in solution by solid phase extraction, elution, and spectrophotometric 15
detection using 4-(2-pyridylazo)-resorcinol, Central European Journal of Chemistry 11 (2013) 16
672-678. 17
[8] H. Fang, F. Tang, J. Shi, H. Zheng, L. Bi, W. Wang, Determination of trace lead and 18
cadmium using stripping voltammetry in fluidic microchip integrated with screen-printed 19
carbon electrodes, Instrumentation Science & Technology 40 (2012) 590–602. 20
[9] G. Abate, J.C. Masini, Complexation of Cd (II) and Pb (II) with humic acids studied by 21
anodic stripping voltammetry using differential equilibrium functions and discrete site 22
models, Organic Geochemistry 33 (2002) 1171–1182. 23
[10] K.W. Bruland, K.H. Coale, L. Mart, Analysis of seawater for dissolved cadmium, copper 1
and lead: An intercomparison of voltammetric and atomic absorption methods, Marine 2
Chemistry 17 (1985) 285–300. 3
[11] T.-Y. Ho, C.-T. Chien, B.-N. Wang, A. Siriraks, Determination of trace metals in 4
seawater by an automated flow injection ion chromatograph pretreatment system with 5
ICPMS, Talanta 82 (2010) 1478–1484. 6
[12] M. Zougagh, A. Garcı́a de Torres, E. Vereda Alonso, J.M. Cano Pavón, Automatic on 7
line preconcentration and determination of lead in water by ICP-AES using a TS-8
microcolumn, Talanta 62 (2004) 503–510. 9
[13] V. Cerdà, J.M. Estela, R. Forteza, A. Cladera, E. Becerra, P. Altimira, P. Sitjar, Flow 10
techniques in water analysis, Talanta 50 (1999) 695–705. 11
[14] M. Trojanowicz, Advances in Flow Analysis, John Wiley & Sons, 2008. 12
[15] J.L.M. Santos, M.F.T. Ribeiro, A.C.B. Dias, J.L.F.C. Lima, E.E.A. Zagatto, Multi-13
pumping flow systems: The potential of simplicity, Analytica Chimica Acta 600 (2007) 21– 14
28. 15
[16] P. González, N. Pérez, M. Knochen, P. González, N. Pérez, M. Knochen, Low cost 16
analyzer for the determination of phosphorus based on open-source hardware and pulsed 17
flows, Química Nova 39 (2016) 305–309. 18
[17] P. González, A. Sixto, M. Knochen, Multi-pumping flow system for the determination 19
of boron in eye drops, drinking water and ocean water, Talanta 166 (2017) 399-404. 20
[18] N. Bhattacharjee, A. Urrios, S. Kang, A. Folch, The upcoming 3D-printing revolution 21
in microfluidics, Lab on a Chip 16 (2016) 1720–1742. 22
[19] A.K. Au, W. Huynh, L.F. Horowitz, A. Folch, 3D-Printed Microfluidics, Angewandte 23
Chemie International Edition 55 (2016) 3862–3881. 24
[20] A.K. Au, W. Lee, A. Folch, Mail-order microfluidics: evaluation of stereolithography 1
for the production of microfluidic devices, Lab on a Chip 14 (2014) 1294–1301. 2
[21] P.J. Bártolo, Stereolithography: Materials, Processes and Applications, Springer 3
Science & Business Media, New York, 2011. 4
[22] C. Polzin, S. Spath, H. Seitz, Characterization and evaluation of a PMMA‐based 3D 5
printing process, Rapid Prototyping Journal 19 (2013) 37–43. 6
[23] R.M. Frizzarin, E. Aguado, L.A. Portugal, D. Moreno, J.M. Estela, F.R.P. Rocha, V. 7
Cerdà, A portable multi-syringe flow system for spectrofluorimetric determination of iodide 8
in seawater, Talanta 144 (2015) 1155–1162. 9
[24] V. Cerdà, J. Avivar, D. Moreno, Chips: How to build and implement fluidic devices in 10
flow based systems, Talanta, 166 (2017) 412-419. 11
[25] R.M. Dagnall, T.S. West, P. Young, Determination of lead with 4-(2-pyridylazo)-12
resorcinol, Talanta 12 (1965) 583–588. 13
[26] C. Mitani, A.N. Anthemidis, On-line liquid phase micro-extraction based on drop-in-plug 14
sequential injection lab-at-valve platform for metal determination, Analytica Chimica Acta 771 15
(2013) 50-55. 16
[27] B. Beltran, L. O. Leal, L. Ferrer, V. Cerda, Determination of lead by atomic fluorescence 17
spectrometry using an automated extraction/pre-concentration flow system, Journal of 18
Analytical Atomic Spectrometry 30 (2015) 1072-1079. 19
[28] M. S. Di Nezio, M. E. Palomeque, B. S. Fernandez Band, A sensitive spectrophotometric 20
method for lead determination by flow injection analysis with on-line preconcentration, Talanta 21
63 (2004) 405-409. 22
[29] A. N. Anthemidis, K.-I. G. Ioannou, On-line sequential injection dispersive liquid-liquid 23
microextraction system for flame atomic absorption spectrometric determination of copper and 24
lead in water samples, Talanta 79 (2009) 86-91. 25
[30] P. Ampan, J. Ruzicka, R. Atallah, G.D. Christian, J. Jakmunee, K. Grudpan, Exploiting 1
sequential injection analysis with bead injection and lab-onvalve for determination of lead using 2
electrothermal atomic absorption spectrometry, Analytica Chimica Acta 499 (2003) 167-172. 3
[31] R.B.R. Mesquita, S.M.V. Fernandes, A.O.S.S. Rangel, A flow system for the 4
spectrophotometric determination of lead in different types of waters using ion-exchange for 5
pre-concentration and elimination of interferences, Talanta 62 (2004) 395-401. 6
7 8
1
Fig. 1. Schema of the MPFS system with the three 3D printed units. C: resin column, R1: nitric
2
acid, R2: ammonium oxalate, R3: PAR, OF: optical fiber, W: waste. In red, the screws and 3
corresponding screw threads to assemble the units. 4
1
Fig. 2. Extraction of several metals on TrisKem Pb resin for different concentrations of nitric
2
acid [multi-metal solution at 0.037 mmol.L-1 (V = 30 mL at 3 mL.min-1), nitric acid at 5 mL.min -3
1 (V = 9 mL for conditioning step, V = 6 mL for washing step), ammonium oxalate at 0.1 mol.L
-4 1 (V = 10 mL at 4 mL.min-1)]. 5 6 0 10 20 30 40 50 60 70 80 90 100 Al Cd Co Cr Cu Fe Ni Pb Zn E x tr ac ti o n ( % )
1
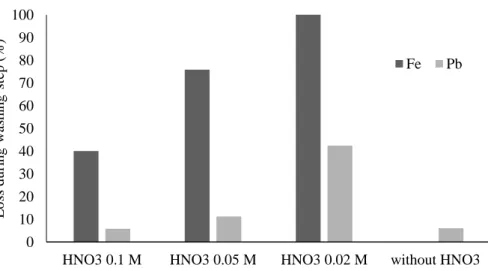
Fig. 3. Iron and lead washing out during washing step [multi-metal solution at 0.037 mmol.L-1
2
(V = 30 mL at 3 mL.min-1), nitric acid at 5 mL.min-1 (V = 9 mL for conditioning step, V = 6 3
mL for washing step), ammonium oxalate at 0.1 mol.L-1 (V = 10 mL at 4 mL.min-1). 4 5 0 10 20 30 40 50 60 70 80 90 100
HNO3 0.1 M HNO3 0.05 M HNO3 0.02 M without HNO3
L o ss dur in g wa sh in g st ep (% ) Fe Pb
1
Fig. 4. Elution of lead at different concentrations of ammonium oxalate [lead solution at 100
2
µg.L-1 (V = 30 mL at 5 mL.min-1), nitric acid at 0.05 mol.L-1 (V = 9 mL for conditioning step, 3
V = 6 mL for washing step, at 5 mL.min-1), ammonium oxalate at 4 mL.min-1 (V = 10 mL)].
4 5 0 20 40 60 80 100 0 0.001 0.005 0.025 0.05 0.1 E lut ed le ad (% )
1
Fig. 5. Absorbance versus PAR and ammonium oxalate flow rates [lead solution at 100 µg.L-1
2
(V = 30 mL at 5 mL.min-1), nitric acid at 0.05 mol.L-1 (V = 9 mL for conditioning step, V = 6 3
mL for washing step, at 5 mL.min-1), ammonium oxalate at 0.025 mol.L-1 (V = 10 mL), PAR 4 at 0.01 mmol.L-1 (V= 10 mL)]. 5 6 0.17 0.18 0.19 0.2 0.21 0.22 0.23 0.24 0.25 0.26 0.27 1 1.5 2 2.5 3 3.5 4 4.5 5 A b so rb an ce 520 n m ( a. u. )
Flow rate (mL.min-1)
PAR
Table 1 Flow procedure for lead determination in water
1
Step Description Action
Volume
(mL)
Flow-rate
(mL.min-1)
P1 P2 P3 P4
1 Conditioning Pumping nitric acid 9 5 ON OFF OFF OFF
2 Pb extraction Pumping sample 50 5 OFF ON OFF OFF
3 Washing Pumping nitric acid 6 5 ON OFF OFF OFF
4 Start data acquisition - - -
5 Elution & detection Pumping ammonium oxalate and PAR
5 4 OFF OFF ON ON
6 Stop data acquisition - - -
2 3
Table 2 Comparison of flow methods for lead determination in water samples. 1 2 Reference Flow techniquea Preconcentration modeb Detection systemc Linear range (µg.L-1) Precision (%) LOD (µg.L-1)
[26] SI-LAV LPME FAAS 6 – 300 2.9 1.8
[27] LOV SPE HG-AFS 0.014 – 20 2.4 0.004
[28] FIA SPE Vis 25 – 250 4.5 5
[29] SI DLLME FAAS 2.3 – 160 1.9 0.54 [30] SI-LOV BI ETAAS 2 – 8 1.9 0.6 [31] SI SPE Vis 50 – 300 4 25 Present work MPFS SPE Vis 3 – 120 5.4 2.7 3
a MPFS: multipumping flow system; SI-LAV: sequential injection – at-valve; LOV:
lab-4
on-valve; FIA: flow injection analysis; SI : sequential injection; SI-LOV: sequential injection 5
– lab-on-valve 6
b LPME : liquid phase micro-extraction ; SPE : solid phase extraction ; DLLME: dispersive
7
liquid-liquid micro-extraction; BI: bead injection 8
c FAAS: flame atomic absorption spectrometry; Vis: visible spectrophotometry; HG-AFS:
9
hydride generation-atomic fluorescence spectroscopy; ETAAS: electrothermal atomic 10
absorption spectrometry 11
12 13
Table 3 Lead determination in real natural water samples with optimised 3D-printed flow
1
system vs reference method (ICP-AES). 2
Samples
Lead concentration (µg/L)
ICP-AES 3D system
Industrial zone (electronic manufacturing)
(upstream) 17.4 ± 1.6 15.8 ± 2.5
Industrial zone (electronic manufacturing)
(downstream) 15.1 ± 0.8 13.8 ± 1.5 WWTP (upstream) 16.5 ± 1.8 18.7 ± 2.1 WWTP (direct downstream) 17.4 ± 2.2 16.6 ± 0.8 River – (12km downstream) 12.9 ± 0.4 11.6 ± 1.4 3 4