HAL Id: ensl-00350535
https://hal-ens-lyon.archives-ouvertes.fr/ensl-00350535
Preprint submitted on 7 Jan 2009
HAL is a multi-disciplinary open access
archive for the deposit and dissemination of
sci-entific research documents, whether they are
pub-lished or not. The documents may come from
teaching and research institutions in France or
abroad, or from public or private research centers.
L’archive ouverte pluridisciplinaire HAL, est
destinée au dépôt et à la diffusion de documents
scientifiques de niveau recherche, publiés ou non,
émanant des établissements d’enseignement et de
recherche français ou étrangers, des laboratoires
publics ou privés.
Dynamics of crater formation in immersed granular
materials
Germán Varas, Valérie Vidal, Jean-Christophe Géminard
To cite this version:
Germán Varas, Valérie Vidal, Jean-Christophe Géminard. Dynamics of crater formation in immersed
granular materials. 2009. �ensl-00350535�
Craters are part of the widespread phenomena ob-served in nature, going from impact meteorit craters to volcanic structures. Studies of crater morphologies have a wide range of applications, going from puzzling crater formation in drying paint [1] to molecular dynamics [2– 4]. Among the main applications to natural phenomena, aside from meteorit impact crater, are the formation and growth of volcanic edifices, by successive ejecta emplace-ment and/or erosion. The time-evolution and dynam-ics play a crucial role here, as the competition between volcanic-jet mass-flux (degassing and ejecta) and crater-size evolution may control directly the eruptive regime [5]. Attempts have been made to model the talus de-velopment of volcanic caldera through erosion [6], or to constraint the morphology and dynamics of pyroclastic constructs via granular-heap drainage laboratory exper-iments [7].
Crater morphology in dry granular material has been extensively studied, both experimentally and theoreti-cally [8–13]. Most of these studies investigate the fi-nal, steady, crater shape resulting from the collision of solid bodies with the material surface and scaling laws are derived [14]. Note however that some authors also reported experimental study of the crater formation dy-namics, including growth and collapse after impact, in the ”single impacting body” configuration [15, 16]. In a recent work, Wu et al. have extended these studies to a particles stream impacting a dry granular bed [17].
In immersed granular material, one reports craters generated by an underwater vortex ring [18], involving fluidized ejecta dynamics, or underwater impact-craters generated by landslide [19]. Craters in immersed granu-lar materials can result either from two-phase or three-phase flows. In particular, water or gas flowing through an immersed granular bed can induce localized instabil-ities and fluidization [20, 21], which eventually leads to the formation of craters at the free surface.
In a previous experimental study, Gostiaux et al. [22] have investigated the dynamics of air flowing through an immersed granular layer. They reported that, depending on the flow-rate, the system exhibits two qualitatively
during which bubbles escape the granular layer quite in-dependently one from another; At large flow-rate, the
open channelregime which corresponds to the formation
of a channel crossing the whole thickness of the granu-lar bed through which air escapes almost continuously. At intermediate flow-rate, a spontaneous alternation be-tween these two regimes is observed. Interestingly, they noticed the appearance of a crater around the locus of air release but did not provide any extensive study of its formation dynamics. Here, we extend these seminal observations to a quantitative study of the resulting de-formation of the free surface of the granular bed. To do so, we reproduce the previous experimental conditions in 2D: In a vertical Hele-Shaw cell, the crater is then formed by two sand piles which grow and move away from each other as time passes by. By monitoring the evolution ot the free surface through time, we investigate the effect of the different gas flow regimes on the crater dynamics. The results point out a grain-transport mech-anism that differs significantly from the one involved in dry-sand dune motion [23–26].
II. EXPERIMENTAL SETUP AND PROTOCOL
The principle of the experiment is to force air, injected locally at the base of an immersed granular bed, to flow vertically across the material. The experimental setup thus consists in a 2-mm-thin vertical-cell containing the grains and water (Fig. 1). The two vertical walls (glass plates) are 40 cm wide and 30 cm high.
The air injection is assured by a system similar to that used in [22]: air is injected, at a constant flow-rate, in a chamber connected to the bottom of the cell. In prac-tice, a small hole (diameter 1 mm) connects, at the cen-ter, the bottom of the vertical cell to the chamber, par-tially filled with water in order to tune the inner gaseous-volume V . The air flow is controlled thanks to a reducing valve which maintains a constant overpressure at the en-trance of a capillary tube: provided that the pressure drop in the capillary tube is much larger than the fluc-tuations of the pressure inside the chamber, the air flow
2
FIG. 1: Experimental setup - Air is injected at constant flow-rate Φ into a chamber (volume V ) connected to a thin vertical cell containing an immersed, initially flat, granular layer. Through time, symmetrical piles form, grow and move in opposite direction on either side of the crater. The experiment consists in observing the deformation of the granular-bed free-surface and in monitoring the overpressure ∆P inside the chamber, in order to account for the influence of the degassing process on the crater dynamics [The picture here illustrates the bubbling regime (see text).]
toward the chamber is not significantly altered by the dynamics of the granular layer and remains constant. The flow-rate Φ (ranging from 1.5 mL/s to 4.3 mL/s) is tuned by changing either the capillary tube (rough) or the pressure-difference imposed by the reducing-valve (fine) and is subsequently measured (to within 0.1 mL/s) by means of an home-made flow-meter. A sensor (MKS Instruments, 223 BD-00010 AB), connected to an acqui-sition board (National Instruments, PCI-6251), monitors the pressure difference, ∆P (to within 10 Pa), between the chamber and the outside atmosphere.
In order to account for the dynamics of the free surface, we image the system from the side. In a first configura-tion, a transparency flat viewer (Just NormLicht, Classic Line) located behind the cell is used to achieve a homoge-neous lighting of the whole bed which is imaged with the help of a Webcam (Logitech, QuickCam Express) con-nected to a PC. A small software (Astra Image Webcam Video Grabber) makes it possible to take one image of the system every 10 seconds and, thus, to record the dy-namics during several hours (typically 24 hours). In a second configuration, in order to observe the motion of the grains, we light up the sample from top with a linear light source (Polytec, DCR3) and take pictures with a high-resolution digital-camera (Nikon, D200).
Initially, Φ is set to zero. Grains and water are intro-duced in the cell. The grains consist of spherical glass-beads (USF Matrasur, sodosilicate glass) that are sieved in order to control their size (typical diameters: 100-125 or 400-500 µm). Initially, after sedimentation, the grains sit at the bottom and we make use of a thin rod to level
the immersed granular layer. We denote hg the height of
grains above the bottom of the container and hw, that of
the water free-surface above the granular bed.
The initial condition consists thus in a horizontal and flat layer of grains. After the opening of the valve, one ob-serves that air is creating several paths between the hole at the bottom and the free surface of the granular bed. During this transient regime, some air-channels merge, or cannot reach the upper layer of grains (In this case, air bubbles remain trapped within the granular layer.) After several minutes, air crosses the granular bed along the vertical and bubbles are emitted in the water from an almost fixed position. Then, through time, a crater forms, the two piles on both sides growing and moving apart one from the other (see photo Fig. 1).
III. RESULTS
We shall report the dynamics of the crater formation in regard to the gas flow regimes. First, we shall describe qualitatively the gas flow regimes (Sec. III A 1) and the associated mechanisms of the gas emission at the free surface (Sec. III A 2). Then, we shall describe qualita-tively the crater formation (Sec. III A 3) and make use of these first observations to estimate the profile of the grain deposition. We shall also discuss the effects of the finite depth of the granular bed and of the finite water height (Sec. III A 4). We finally quantitatively study the influence of the gas flux (Sec. III B 1) and of the grain size (Sec. III B 2).
injector at the base of the granular layer. On the other hand, in the open-channel regime, which is typically ob-served at large Φ, the system sustains a continuous air-flow through a channel crossing the whole granular layer. The overpressure ∆P associated with this continuous air emission is almost constant. In an intermediate range of Φ, one observes a spontaneous alternation between the two regimes: The channel forms after the emission of several bubbles and subsequently spontaneously pinches off after a finite time, leading the system back to the bubbling regime. As a consequence, activity- and rest-periods are observed in the pressure signal (Fig. 2a). The phenomenon is explained by the ability of the material to sustain a stable channel thanks to its peculiar rheology. At last, we point out that the deformation of the free surface of the granular bed does not seem to alter the gas flow process: it has been previously shown that the gas emission is mainly governed by local events occuring close to the free surface [22].
2. Bubble emission mechanisms.
A close look at the free surface of the granular bed points out two different air-release mechanisms associ-ated with the bubbling and open-channel regimes respec-tively. In the bubbling regime, a gas bubble, while grow-ing underneath the free surface, pushes up a thin layer of grains which forms the bubble head. Once it has crossed the interface, the bubble, while it rises up in the water, advects the grains in its wake (Fig. 2b). In the
open-channelregime, the air is released continuously through
the channel whose walls remain at rest. The grains are advected upwards, from the free surface, by the water flow behind the small ascending gas bubbles (Fig. 2c). From these observations, one could wonder about the rel-ative efficiency of the two regimes in forming the crater. In particular, one could expect the bubbling regime to lead to a faster growth because the explosive bursting of the bubble apparently lifts a larger quantity of grains. In the section III B, in order to answer the question, we shall report a quantitative study of the crater growth in
neous alternation between activity- and rest-periods which correspond respectively to the bubbling and open-channel regimes. The emission of the bubbles at the free surface ac-cordingly exhibits two qualitatively different behaviors : (b) In the bubbling regime, a large bubble forms underneath the free surface of the granular-bed and then bursts. The explo-sion pushes out of the bed a large number of grains, which are subsequently advected upwards in the bubble wake. (c) In the open-channel regime, the walls of the channel are stable and a continuous gas flow escapes the granular bed. In this regime the grains are only torn out from the granular bed by the water flow and subsequently advected in the wake of the small bubbles that form in water (d = 400 µm, hg = 8 cm, hw= 16 cm and Φ = 2.5 mL/s).
large range of Φ.
3. Geometrical description of the crater.
The ejection of the grains from the free surface and the subsequent deposition of the granular ejecta lead to the rapid formation of a crater, which is formed by two granular piles symmetrically positioned on each flank. Due to the permanent grain transport, the crater grows: the piles height increases while they move symmetrically away from the center (Fig. 3).
Before reporting quantitative measurements of the crater dynamics, let us mention some qualitative features of the crater formation. First, let us denote α and β the maximum angles that the piles make with the hori-zontal respectively inside and outside the crater. From direct observation (Fig. 3), one can notice immediately that α and β can differ significantly, especially at the early stages of the crater formation (Fig. 4a). We note that the inner flanks of the crater are almost straight and that α (about 28 deg.) remains constant during the whole crater growth. In contrast, the outer slopes are not straight, especially at the early stages of the crater formation, and β evolves in time.
4
FIG. 3: Temporal evolution of the crater- The black lines are the result of the automatic detection of the free-surface profile. The angles α and β denote respectively the maximum angle the inner and outer flanks make with the horizontal. We define L, the distance between the two peaks, and x, the distance from the center (d = 100 µm, hg= 8 cm, hw= 16 cm and Φ = 2.2 mL/s).
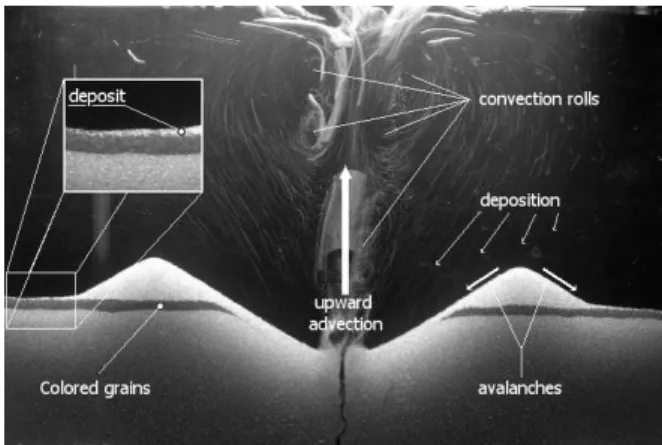
considering the grain flows (Fig. 5). Once lifted up by liquid flow, the grains are pushed away from the center by the liquid flow which mainly consists of two large con-vective rolls and then, subjected to gravity, deposit back onto the free surface at finite distance from the center. If the local slope is smaller than the angle of avalanche the grains do not move anymore once deposited. To the contrary, if the local slope is larger than the angle of avalanche, the grains flow downwards along the slope. At the center the grains are very locally torn off from the surface by the upward liquid-flow. The local slope almost immediately exceeds the angle of avalanche and grains flow downwards on both inner flanks to replace the granular material missing at the center. Thus, if a grain deposits onto the inner flank, it flows downwards toward the center, which again explains why α remains almost constant and only fluctuates between the angle of repose and the angle of avalanche (Fig. 4a). In con-strast, at the early stages of the crater formation, the outer flanks only result from the deposition of the gran-ular material. The local slope of the outer flank being everywhere smaller than the angle of avalanche, a grain, once deposited, does not move anymore. However, at a finite time t, β reaches the value of the angle of avalanche, which results in surface flows along the outer flank. As a consequence, β evolves in time (Fig. 4a) : starting from a small value at the early stages of the crater formation, β increases to reach a constant value after a finite time. We note here that β then remains slightly smaller than α, which is probably explained by the fact that α
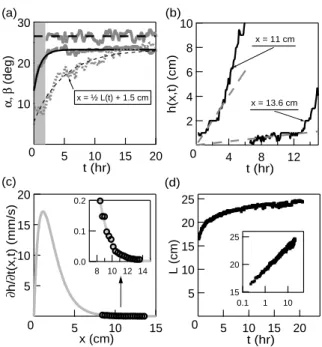
signifi-30 20 10 α, β (deg) 20 15 10 5 t (hr) 0 x = ½ L(t) + 1.5 cm 10 8 6 4 2 h(x,t) (cm) 12 8 4 t (hr) 0 x = 13.6 cm x = 11 cm 20 15 10 5 ∂ h/ ∂ t(x,t) (mm/s) 15 10 5 x (cm) 0 0.2 0.1 0.0 14 12 10 8 25 20 15 10 5 L (cm) 20 15 10 5 t (hr) 0 25 20 15 0.1 1 10 (a) (b) (d) (c)
FIG. 4: Temporal evolution of the crater geometry - (a)-Inner and outer angles α and β vs. time t (Φ = 1.67 mL/s). The grey zone marks the early stages of the crater growth during which the crater size compares with the size of the bubbles. The angle α, which is then not measur-able, remains constant during the whole experimental time. In contrast, the angle β increases continuously to reach a con-stant value after a finite time. In order to show that the slope is not constant along the outer flanks, we report the tempo-ral evolution of the slope at x = 1
2L(t) + 1.5 cm: the local slope remains smaller than β until reached by the avalanche flow. Solid and dashed lines are guidelines. (b)-Local height h(x, t) vs. time t (Φ = 2.93 mL/s). Far away from the center, the height h of the granular layer increases due to the de-position of the grains. We observe a linear increase of h(x, t) with time until the region is reached by the grains avalanching along the outer flank. (c)-Local growth velocity ∂h/∂t(x, t) vs. distance x (Φ = 2.93 mL/s). The data are successfully interpolated by ax
Lcexp (−
x
Lc) for large x, we get at a rough
estimate Lc= (1.13 ± 0.04) cm. (d)-Distance L between the summits vs. time t (Φ = 4.26 mL/s). Whereas the crater forms quite fast, we observe a drastic decrease of the growth velocity at large times. Inset : L vs. log(t). At large times, L increases almost logarithmically with time t (d = 400 µm, hg = 8 cm and hw= 16 cm).
cantly exceeds the angle of avalanche due the continuous grain-flow along the inner flanks.
At this point, it is particularly interesting to make use of these observations to estimate the spatial distribution of the deposited grains. To do so, let us now consider the local height h(x, t) of the free surface at the distance x from the center at time t (Fig. 4b). Close to the center, h(x, t) exhibits a complex behavior which results from both the deposition and the surface flows. Far from the center, h(x, t), which results from the deposition alone, evolves linearly in time. From this latter observation, we
camera. Initially, a thin layer of colored grains is deposited at the free surface of the initially flat and horizontal bed. Then, a series of ascending rolls pushes the grains away from the vertical central axis. Subsequently, the grains gently deposit back onto the free surface of the bed. Along the piles flanks, provided that the local angle exceeds the angle of avalanche, we observe continuous avalanches. Inside the crater, the flow-ing granular-material partly replaces the grains advected up-wards at the center. Along the outer flanks, the deposited granular material either flows or sits at the free surface. One can clearly observe, in the inset, that new material, deposited far away from the center forms a thin layer of material which remains at rest. The deposition flow-rate, Q(x), is estimated from the temporal evolution of the growth velocity ∂h/∂t of the deposited layer in that region (Fig. 4c) (d = 400 µm, hg= 8 cm, hw= 16 cm and Φ = 3.5 mL/s).
deduce that the advection is not significantly affected by the crater growth and that the distribution of the de-posited grains, far away from the center, is almost con-stant in time. At an intermediate distance from the cen-ter, we observe a change in the temporal evolution of h(x, t) : at small times, the dynamics is only due to the deposition whereas later, when β reaches the avalanche angle, the local dynamics results from both the deposi-tion and the surface flows. The volume, Q(x), of granular material deposited at the distance x from the center per unit distance and per unit time is proportional to the ini-tial slope ∂h(x, t)/∂t far away from the center (Fig. 4c). Seeking for a simple mathematical description of the de-position flow, we guess that the grains, pushed away from the center by the liquid flow, have a negligible probability to deposit back at the center and we propose to interpo-late ∂h(x, t)/∂t by ax
Lcexp (−
x
Lc), which makes possible
to extract a characteristic length Lc at which the grains
are deposited away from the center. We shall show in the section III B that the shape of the distribution Q(x) accounts for the evolution of the distance L(t) between the two summits as a function of the time t (Fig. 4d).
20 10 L(30 mn) (cm) 15 10 5 hw (cm) 0
FIG. 6: Distance L(30 min) vs. water height hw - For hw < L/4, the growth of the crater is limited by the wa-ter height and L(30 min) increases linearly with hw. In con-trast, for hw > L/4, the growth of the crater is not altered by the water height and L(30 min) does not depend on hw (d = 100 µm, hg = 8 cm and Φ = 3.06 mL/s).
In the same manner, the height of the piles can
obvi-ously not exceed hw. We estimate, the maximum
accessi-ble value of L, Lw
max= 2(1 +
√
2)hw/ tan α. However, we
checked experimentally that Lw
maxlargely underestimates
the finite water-height effect : Reporting L at a given,
large, time t = 30 min as a function of hw, we obtain
experimentally that the growth of the crater is limited by the water height for hw< L/4 (Fig. 6). Interestingly,
we observe, in addition, that L(30 min) does not depend of hw if hw> L/4 : The crater growth is not altered by
the water height if his latter is large enough. We shall
report experimental results obtained for hw = 16 cm so
that Lw
max∼ 64 cm is larger than the lateral width of the
cell. The growth of the crater shall thus not be limited by the finite water-height.
B. Influence of the gas flow Φ and grain size d. 1. Dependence on the air-fluxΦ.
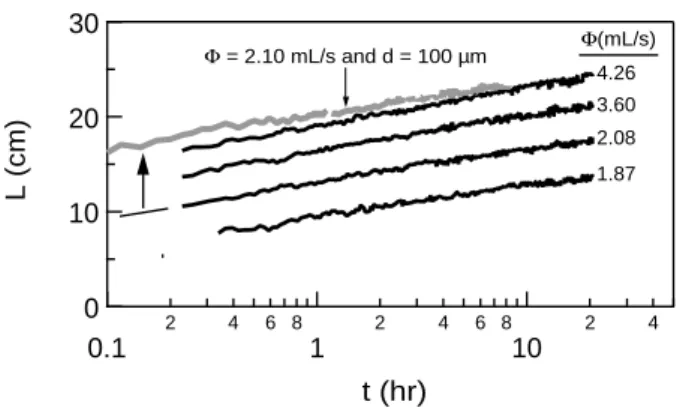
We report the distance L between the piles as a func-tion of time t, for different air flow-rates Φ (Fig. 7). We
6 30 20 10 0 L (cm) 0.1 2 4 6 8 1 2 4 6 8 10 2 4 t (hr) Φ(mL/s) 4.26 3.60 2.08 1.87 Φ = 2.10 mL/s and d = 100 µm
FIG. 7: Distance L vs. time t - The distance L between the summits increases logarithmically with time, independently from the gas emission regimes. Indeed, at small Φ, the gas flow regime consists mainly in the emission of independent bubbles, whereas it consists mainly in a continuous emission of gas at large Φ. From the interpolation of the experimental data with L/L0= log(Φt/V0), we estimate L0= (3.5±0.7) cm and V0 = (0.4±0.2) mL for d = 400 µm (black curves) whereas we estimate L0= (3.5 ± 1) cm and V0= (0.02 ± 0.01) mL for d = 100 µm (grey curve) (hg= 8 cm, hw= 16 cm).
observe that L increases logarithmically with t and we write L/L0= log(Φt/V0), V0being a typical volume.
In the bubbling regime, when the gas emission at the free surface consists of the periodic emission of indepen-dent bubbles at the free surface, a simple argument can account for the proposed dependance on the total emit-ted gas volume, Φt, alone : The dimensions of the piles, length L or height, are expected to depend on the total
number Ng of grains displaced by the water flow. Thus,
Ngbeing proportional to the number of emitted bubbles,
which itself, at a given time t, is proportional to Φt, we expect L to be a function of Φt alone, as observed experi-mentally. In addition, we observe that the relation holds true even at large Φ when the system exhibits, almost always, the open-channel regime. Thus, contrary to the intuition, the small bubbles emitted by the open-channel are as efficient as the exploding bubble of the bubbling regime in lifting the grains: This observation is again in agreement with the fact that the grains are mainly lifted by the water flow and not expelled by the explosion of the bubbles [22].
2. Dependence on the grain sized.
From the interpolation of the exprimental data, one
can estimate the typical length L0 and the typical
vol-ume V0. One observes that the length L0 does not
de-pend significantly on the grain size (The slope in the semi-log plot remains almost unchanged) and we estimate
L0 = (3.5 ± 1) cm for d = 400 µm and d = 100 µm. In
contrast, we estimate V0∼ 0.4 mL for d = 400 µm and a
significantly smaller value V0∼ 0.02 mL for d = 100 µm.
The precise dependence of L0 and V0 on d is difficult
to access experimentally as such measurements require precise knowledge of the origin of time (a delay alters significantly the slope and the offset in the semi-log plot) which we are missing. Nevertheless, V0is observed to
de-crease drastically with the grain size whereas L0remains
almost constant.
IV. DISCUSSION
The crater growth is due to the advection of the grains and to the subsequent deposition away from the location of the gas emission. From the observation of the deposit far away from the center (Sec. III A 3), we propose that the deposited flow can be written, for large distance x, Q(x) = aLxcexp (−
x
Lc). This relation accounts for the
logarithmic growth of the crater. Indeed, assuming the angle α on both sides of the piles, a simple geometrical
analysis gives the volume, v = 1
8 tan α (1+√2)2L
2 of the grains
on the outer side of one pile (x ≥ L/2). Noting that only the deposition of grains on the outer flank of the pile con-tributes to its growth, we can write dvdt = R∞
L/2Q(x) dx,
which leads to the equation governing the pile growth : 1 4 tan α (1 +√2)2L dL dt = a Z ∞ L/2 x Lc exp (− x Lc ). (1)
Provided that L ≫ Lc (which is almost always
sat-isfied experimentally), we obtain that, asymptotically, L increases logarithmically with time t according to
L(t) ≃ L0log (Φt/V0) with L0 = 2Lc and Φ/V0 =
a(1 +√2)2/tan α. The experimental rough estimates,
obtained for d = 400 µm, Lc = (1.13 ± 0.04) cm
(Sec. III A 3) and L0 = (3.5 ± 0.7) cm (Sec. III B 1) are
in fair agreement with this expectation. The same con-clusion holds true for the smaller grains, d = 100 µm, as
we measured Lc = (1.38 ± 0.04) cm for the same value of
L0.
Finally, if we interpret the volume V0as the gas volume
necessary to lift or move a given quantity of grains, one
can easily understand that V0 decreases with d. Indeed,
the advection process, whose associated force scales like d, competes with the buoyancy force which scales like d3. As a result, large grains are more difficult to lift than
small ones and the gaseous volume necessary to move them away is larger.
The advection process remains difficult to model in details. Indeed, the liquid flow in the wake of the bubbles is generally turbulent and it is barely possible to account for the advection of the solid particles in such a complex stream field. There also remains a very important open question : we observed that the growth of the crater is not altered by the water depth (if large enough). However, we observe that the vertical size of the large-scale convective-rolls compares to hw, whereas their lateral size compares
to L/2. One thus would expect the typical distance Lc
to depend on hwand, even, on time. Our study does not
[2] Z. Insepov, L. P. Allen, C. Santeufemio, K. S. Jones, and I. Yamada, Nucl. Instrum. Meth. B 206, 846 (2003). [3] Y. Yamaguchi, J. Gspann, and T. Inaba, Eur. Phys. J D
24, 315 (2003).
[4] T. Aoki, and J. Matsuo, Nucl. Instrum. Meth. B 241, 594 (2005).
[5] A. W. Woods, and S. M. Bower, Earth Planet. Sci. Lett. 131, 189 (1995).
[6] H. Obanawa, and Y. Matsukura, Geomorphology 97, 697 (2008).
[7] C. Riedel, G. G. J. Ernst, and M. Riley, J. Volcanol. Geotherm. Res. 127, 121 (2003).
[8] Y. Grasselli, and H. J. Herrmann, Gran. Matt. 3, 201 (2001).
[9] J. S. Uehara, M. A. Ambroso, R. P. Ojha, and D. J. Durian, Phys. Rev. Lett. 90, 194301 (2003).
[10] D. Lohse, R. Bergmann, R. Mikkelsen, C. Zeilstra, D. van der Meer, M. Versluis, K. van der Weele, M. van der Hoef, and H. Kuipers, Phys. Rev. Lett. 93, 198003 (2004).
[11] X.-J. Zheng, Z.-T. Wang, and Z.-G. Qiu, Eur. Phys. J. E 13, 321 (2004).
[12] K. Wada, H. Senshu, and T. Matsui, Icarus 180, 528 (2006).
[13] S. J. de Vet, and J. R. de Bruyn, Phys. Rev. E 76, 041306 (2007).
[14] A. M. Walsh, K. E. Holloway, P. Habdas, and J. R.
Lett. 96, 158001 (2006).
[16] S. Yamamoto, K. Wada, N. Okabe, and T. Matsui, Icarus 183, 215 (2006).
[17] S. M. Wu, H. P Zhu, A. B. Yu, and P. Zulli, Gran. Matt. 9, 7 (2007).
[18] A. Suzuki, I. Kumagai, Y. Nagata, K. Kurita, and O. S. Barnouin-Jha, Geophys. Res. Lett. 34, L05203 (2007). [19] H. M. Fritz, W. H. Hager, and H.-E. Minor, Exp. Fluid
35, 505 (2003).
[20] P. Rigord, A. Guarino, V. Vidal, and J.-C G´eminard, Gran. Matt. DOI 10.1007/s10035-005-0214-1 (2005). [21] F. Zoueshtiagh, and A. Merlen, Phys. Rev. E 75, 056313
(2007).
[22] L. Gostiaux, H. Gayvallet, and J.-C G´eminard, Gran. Matt. 4, 39 (2002).
[23] R. A. Bagnold. The Physics of Blown Sand and Desert Dunes. Chapman and Hall, London (1941).
[24] K. Kroy, G. Sauermann and H.J. Herrmann, Phys. Rev. Lett. 88, 054301 (2002).
[25] B. Andreotti, P. Claudin and S. Douady, Eur. Phys. J. B 28, 321 (2002).
[26] P. Hersen, K.H. Andersen, H. Elbelrhiti, B. Andreotti, P. Claudin and S. Douady, Phys. Rev. E 69, 011304 (2004). [27] T. Divoux, E. Bertin, V. Vidal and J.-C. G´eminard, Intermittent outgassing through a non-Newtonian fluid, arXiv:0810.3095v1 [cond-mat.stat-mech] (2008).