HAL Id: hal-01207486
https://hal.archives-ouvertes.fr/hal-01207486
Submitted on 5 Oct 2015
HAL is a multi-disciplinary open access
archive for the deposit and dissemination of
sci-entific research documents, whether they are
pub-lished or not. The documents may come from
teaching and research institutions in France or
abroad, or from public or private research centers.
L’archive ouverte pluridisciplinaire HAL, est
destinée au dépôt et à la diffusion de documents
scientifiques de niveau recherche, publiés ou non,
émanant des établissements d’enseignement et de
recherche français ou étrangers, des laboratoires
publics ou privés.
Another way to manage supply chains: holonic and
multicriteria approach
Lynda Mekaouche, Fouzia Ounnar, Patrick Pujo, Norbert Giambiasi
To cite this version:
Lynda Mekaouche, Fouzia Ounnar, Patrick Pujo, Norbert Giambiasi. Another way to manage supply
chains: holonic and multicriteria approach. International Journal of Logistics Systems and
Manage-ment, Inderscience, 2009, �10.1504/IJLSM.2009.022504�. �hal-01207486�
Another way to manage supply chains: holonic and multicriteria approach
Lynda Mekaouche, Fouzia Ounnar, Patrick Pujo and Norbert Giambiasi
Laboratoire des Sciences de l’Information et des Systèmes (LSIS) UMR CNRS 6168 Université Paul Cézanne
Avenue Escadrille Normandie Niemen - 13397 Marseille Cedex 20 – France Phone: (33) 04 91 05 60 10 - Fax: (33) 04 91 05 60 33
E-mail: [email protected] E-mail: [email protected] E-mail: [email protected]
E-mail: [email protected]
Abstract: Today’s suppliers are challenged to deliver quality to their customers. Managers need to create and sustain internal systems and controls to ensure that their customers-focused strategies are being implemented. Many companies increasingly turn to their core activities to improve their reactivity and to manage their costs. This paper proposes an approach for self-organized control of relations between companies in which all the members of a partnership negotiate to guarantee good quality connections between customers and suppliers. Each partner is associated with a decision- making entity named “Autonomous Control Entity” (ACE) through which he can evaluate his performance. The integration of these ACEs into a holonic control system is presented. Operations of an ACE have been modelled through the Discrete EVent system Specification (DEVS) formalism. Then, the validation of such a control system for a self-organized logistic partnership network was done through a distributed High Level Architecture (HLA) simulation environment.
Keywords: Self Organized Control, Self Evaluation, Holonic Manufacturing System (HMS), High Level Architecture (HLA), Supply Chain Network.
Reference to this paper should be made as follows: Mekaouche, L., Ounnar, F., Pujo, P. and Giambiasi, N. (2009) ‘Another way to manage supply chains: holonic and multicriteria approach’, Int. J. Logistics Systems and Management, Vol.5, No.3/4, pp.396 - 417.
Biographical notes: L. Mekaouche is currently a PhD candidate at Paul Cézanne University of Marseilles (LSIS). She obtained her Master degree in Informatic from the Faculté des Sciences de Luminy, Université de la Méditerranée – Marseilles – France in 2003.
F. Ounnar is an associate professor at Paul Cézanne University of Marseilles (LSIS) where she teaches Industrial Engineering. She holds a PhD in Automatics and Production at Joseph Fourier University of Grenoble – France in 1999. Her research interests are Supply Chain Management, self organized control, DEVS simulation, Holonic Manufacturing System. P. Pujo is an associate professor at Paul Cézanne University of Marseilles (LSIS) where he teaches Industrial Engineering since 1988. He obtained a PhD in Automatic and Robotic from the Aix-Marseilles University in 1994. His research interests include operation management, quality management, isoarchic and decentralized control, self organized control, DEVS simulation, Holonic Manufacturing System.
N. Giambiasi is full Professor at Paul Cézanne University of Marseilles from 1981. After creating a new engineer school and a research laboratory in Nîmes-France, he comes back in 1994 to the University of Marseilles in which he creates a new research team in simulation. He is now the leader of a CNRS laboratory (LSIS) in Marseilles, with more than 200 researchers. His main current interests are specification formalisms of hybrid models, discrete event simulation of hybrid systems, CAD systems and Design Automation.
1
Introduction
The evolution and the development of the economical world lead to a new competitiveness in the industrial area. Companies try to achieve the common goal of satisfying customers’ needs through partnership. Consequently, changes appear generally in customer supplier relationships: a strong evolution of partner relations has occurred since a few years in order to obtain better internal management of each partner and improved overall performance. Partnership control involves all the actions developed together in order to achieve common objectives and to timely react to any failure of any partner. Negotiation between partners is thus required involving each partner management and production organization. This situation makes difficult to obtain the best response with respect to the need of each customer.
For that, a new approach is proposed for customer-supplier relationship control, in which the partnership is considered in the context of an association of potential suppliers within a network. The goal of the partnership is to collectively ensure the dispatching of orders from different customers, while respecting each partner’s interest. The proposed approach allows data confidentiality for the different network partners. Indeed, a supplier provides only a single data to the network which is its performance value for a given CFP. Consequently, the approach can be applied within a logistic network in which there is mutual trust among the partners or in a multi-sited company. Such an approach is in the framework of the Holonic Manufacturing System (HMS) approach developed in the IMS (Intelligent Manufacturing System) (IMS, 1997).
Our approach is described with the support of the reference architecture PROSA (Van Brussels, Wyns, Valckenears, Bongaerts and Peeters, 1998) which allows to specify holonic approaches according to a breakdown into holons like Product, Resource, Order and Staff. In our case, each enterprise involved in a logistic chain becomes a Resource Holon when it is associated with a decision making entity providing the capability to interact with other enterprises. All the Resource Holons make a network of logistic partnership encompassing the concerned enterprises. The decision making entity is called ACE, standing for Autonomous Control Entity. Each ACE is modelled according to the Discrete Event system Specification (DEVS) formalism and is integrated into a High Level Architecture (HLA) simulation environment allowing to validate a self organized logistic network partnership.
In the following, a review of the work carried out on company relationship improvement is made. Then, the proposed approach is described. HLA concepts are briefly addressed and the tests that were used to validate the approach are presented.
2
Literature review
Many studies have been conducted in order to propose tools allowing companies to achieve their goals of performance improvement and profit maximization. Research was focused on time and cost reductions and on increasing product diversity and quality (Gentilli, Cicco and Santucci, 2004). Industry globalization, customer requirements evolution and appearance of complex products, allow companies to realize that internal improvement and external competitive environment improvement are important but not sufficient. These pushed researchers to go further to prove that integrating companies into a network is essential. In other words, a company development does not depend only on the improvement of its internal performance but requires the
use of external resources (Brito and Roseira, 2004; Cousins and Spekman, 2003; Faems and Van, 2003; Pradosh, Sandhya and Mrinalini, 2005). This made companies to use outsourcing to produce complex products. Through outsourcing, companies tend to gather to perform in a joint project, thus forming a supply chain network seeking to optimize customer satisfaction. With the aim to answer the objectives of enterprises involved in a network, research was focused on both network modelling and methodologies allowing modeling
of this type of network (Chen, Amodeo and Chu, 2001; Despontin, Briand and Esquiral, 2001; Villa, 1998;
Dong, Zhang and Nagurney, 2002).
On the basis that creation of reliable industrial relationships is the key for a better productivity and effectiveness, studies were conducted on the durability of customer supplier relationships (Alcouffe and Corrégé, 2004; Corrégé, 2001), on the dynamics of these relationships (Haurat, 2002) and on their influence on inter company costs (Brun and Staudacher, 2000; Harri, 2002). In addition to this work, we can mention the studies of (Toolea and Donaldsonb, 2002) on customer/supplier relationship performance and of (Nesheim, 2001; Holmlund-Rytkönen and Strandvik, 2005) on the impact of bidding on customer/supplier relationships. Other studies were rather focused on the definition of concepts in order to ensure a better cooperation between companies (Telle, 2003; Lauras, 2004).
In order to go further in the interactions and information exchanges for decision making, it is necessary to introduce inter company coordination and negotiation capabilities. Our approach proposes a Customer-Supplier (C-S) relationship control in which all (C-S) partners negotiate according to a protocol inspired from Contract-net (Smith, 1980), in order to respond as best as possible to customer requirements. In other words, our approach proposes to answer Calls For Proposals (CFPs) launched by customers, and to exploit in better ways the suppliers’ capacities (Mekaouche, Ounnar, Pujo and Giambiasi, 2005c). The ACE of each supplier allows self evaluation of his performance in order to be able to take part in negotiations within a self organized network (Ounnar and Pujo, 2005).
3
Operation of the proposed approach
The proposed approach increases the autonomy of the network entities. The entities common goal is to collectively ensure the dispatching of orders coming from different customers, while respecting everyone’s interest. This can happen only if the entities have the capability to negotiate and communicate between themselves. When a customer launches a Call For Proposals (CFP), the potential suppliers negotiate in order to provide answers to the launched CFPs and the best answer for each CFP will emerge from the negotiations. This can only be obtained if each supplier is able to self evaluate himself and to judge if he can take part in the negotiations. A customer does not negotiate with suppliers. Instead, the potential suppliers negotiate between themselves with the aim to seek the best response to a CFP launched by the customer. After the negotiation deadline given by the customer, the order related to the CFP is carried out by the supplier having the best performance. This leads to the idea of self-organized control. The concept of self organization is subordinated to use a decentralized decision structure and to take into account the specific behaviour of each component. With this approach there is no estimated organization. Self organization is akin to a real-time decision making operating mode. A common goal is necessary for the organization to work; this can be translated into cooperation and negotiation terms. At the end, the solution emerges from the negotiation that makes the components of the self organized system operating.
3.1 Holonic architecture of a self-organized control system
In a context of several enterprises linked through customer supplier relationships, product flows are generally static after a commercial negotiation. This can make flow management difficult, in particular when work overloads occur for one supplier.
In a self-organized control system of a logistic network each supply flow is considered with respect to all potential suppliers. For that, each supplier participates in a common goal achievement by organizing its own control (Ounnar and Pujo, 2001). In our proposal, decentralized self organized control is characterized with an organizational architecture of the type flat holonic form. Each Resource Holon has the capability with its ACE to self evaluate its performance for executing a proposed task, with the aim to participate in the negotiations for allocating this task. The reference architecture PROSA is used to describe our flat holonic form (Ounnar, Pujo, Mekaouche and Giambiasi, 2007). In this architecture, the basic role of the ACEs is to manage all information exchanges in the network linking the different entities and to organize information processing leading to decision making. The ACEs are in fact in the hart of the relationships between the base holons of the PROSA model:
• The Resource Holons (RH) corresponding to the enterprises of the logistic network partnership; and
which, besides the ACE capability to ensure their own control, carry production capacity characteristics;
• The Order Holons (OH) representing the organizational aspect of the product manufacturing tasks to
be performed by the resources.
• The Product Holons (PH) providing a technical description of the manufactured products.
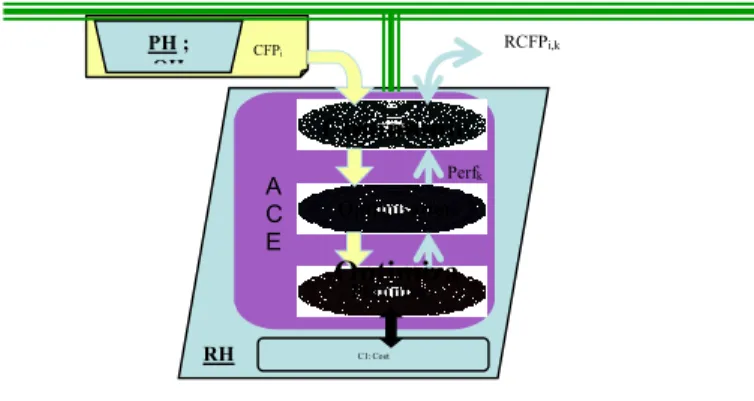
All the information needed for performance evaluation by the ACEs is in these holons. Each ACE has privileged exchanges within the Resource Holon it is associated with, which provides for instance information on its planning, its capability, etc. The data associate with the Order Holons and the Product Holons circulate in the network via Calls For Proposals (CFPs). Interactions between the base holons and an ACE are shown in figure1.
Figure 1 Interactions between the base holons – ACE
Each ACE is composed of three modules: Interaction, Optimization and Planning Modules.
Communic ation Optimiza tion Optimisation Interaction Planning A C E PH ; OH CFPi RCFPi,k Perfk RH C1: Cost Manufacturing Control
3.2 Description of the ACE modules
The different modules and the operations of an ACE are described below.
3.2.1 Interaction Module
This module ensures order assignment to the various entities (suppliers) of the network. Assignment is based on decision-making linked to competition between the entities (Mekaouche, Ounnar, Pujo and Giambiasi, 2005d) and common rules and criteria applied to all entities. The main functionalities of this module are summarized in two points:
• Publication of information about the calls for proposals and of responses to received Calls For
Proposals (CFPs).
• Sorting entities according to the received Responses to Calls For Proposals (RCFPs): for each received
new RCFP, the corresponding call for proposals is updated with this RCFP if it is the first one or if it is better than the best RCFP already received.
The order assignment process is inspired from the Contract-Net Protocol (CNP). A CFP is always launched to all the participants by an initiator entity, with a deadline. Each participant studies all the messages concerning this CFP and builds its answer. A participant answers as soon as possible and only if its proposal is better than those already sent on the network.
3.2.2 Optimization Module
This module allows self evaluation concerning a received CFP, based on quantitative and qualitative criteria, in order to estimate a participant own capacity to answer a call (Ounnar, Pujo, Mekaouche and Giambiasi, 2004). Performance evaluation is based on the multicriteria method named Analytic Hierarchy Process (AHP) (Saaty, 1980; Ounnar, 1999). AHP is a flexible decision-making tool for complex problems involving multiple qualitative and quantitative criteria. This method is also used in related domains to solve similar problems of decision-making process. For example, (Moynihan, Saxena and Fonseca, 2006) have developed a prototype decision support system for procurement including vendor selection and development of an optimal procurement strategy. The AHP method ensures the classification of CFPs according to the entity capacity to treat them. Only the CFP ranked first will be analyzed by the entity.
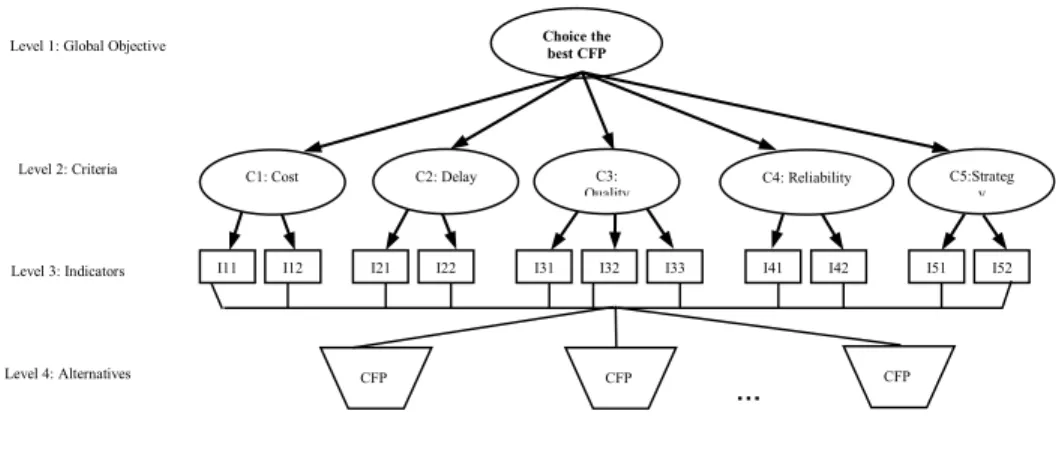
The AHP method helps decision-makers to structure the significant components of a problem in a hierarchical tree-like structure. Figure 2 represents an illustration of a decomposition of a problem into a hierarchical structure. The first level corresponds to the Global Objective (G. Ob). The second level represents the considered Criteria (Ci). Each criterion is defined by a set of Indicators (Iij) which are presented at the third level. The last level corresponds to the different Alternatives (Ak: CFPk in our case) (Mekaouche, Ounnar, Pujo and Giambiasi, 2005d). AHP is a decision-making process that directly interprets the data by forming judgments through a scale of measurement inside a hierarchical structure.
AHP has advantages over other decision-making approaches. These include the ability to: (i) handle tangible and intangible attributes; (ii) hierarchically structure the problems to gain insights into the decision-making process; and (iii) monitor the consistency of the judgments of a decision-maker. The optimization module starts to apply the AHP method when the ACE has received at least two CFPs. The method uses qualitative and
quantitative criteria to classify CFPs, among which is the operating time given by the production system planning.
Figure 2 Example of a decision-making hierarchical process
3.2.3 Planning Module
This module allows calculating the operating time related to a given CFP through the application of an analytical method based on the different planning states of the production system (Mekaouche, Ounnar, Pujo and Giambiasi, 2006). Otherwise, the planning module sends the CFP and its associated operating time to the optimization module in order to finish the application of the multicriteria method. The optimization module calculates the entity performance with respect to the CFP ranked first. Then, it sends to the interaction module the entity response to the CFP, together with its performance and its commitment date.
The planning module ensures the execution of a CFP suppression order coming from the interaction module. A CFP is suppressed from the entity planning when another entity has launched a better response concerning this CFP. After removing the CFP, the planning module re-evaluates all the CFPs downstream of the removed CFP. Then, it sends the new dates to the optimization module in order to recalculate the performance associated to these CFPs.
4
Presentation of the self evaluation process
Two filters are applied before performance calculation when a CFP is received by an ACE. The first filter deals with verification of the CFP technical feasibility by the interaction module. If feasibility is verified, the CFP is sent to the planning module via the optimization module. Then the CFP is subject to the second filter dealing with the possibility of its insertion into the planning. When insertion is possible, the ACE evaluates the entity performance related to the CFP.
A launched CFP includes information such as name of the transmitting entity (customer), description of the requested product, quantity expected by the customer, end of negotiation lead time, delivery lead time, etc. which is received by all the network ACEs. When an ACE receives a CFP, the interaction module transmits it to the optimization module which applies the AHP method in order to classify all the received CFPs, according to the entity processing capacities. Application of the method requires a set of qualitative and quantitative criteria (Ounnar, Pujo, Mekaouche and Giambiasi, 2004), some of which, such as delivery lead time, expected quantity, etc., are defined by the customer in the CFP. Other criteria are parameterized by specific supplier’s characteristics, such as lead time, order delivery time, delivery cost, order cost, etc. The operating time is one
I11 I12 I21 I22 I31 I32 I33 I41 I42 I51 I52
CFP 1 CFP 2 CFP N Choice the best CFP
Level 1: Global Objective
Level 2: Criteria Level 3: Indicators Level 4: Alternatives C5:Strateg y C4: Reliability C3: Quality C2: Delay C1: Cost Manufac turing Control … Re cep tio n of a CF P.
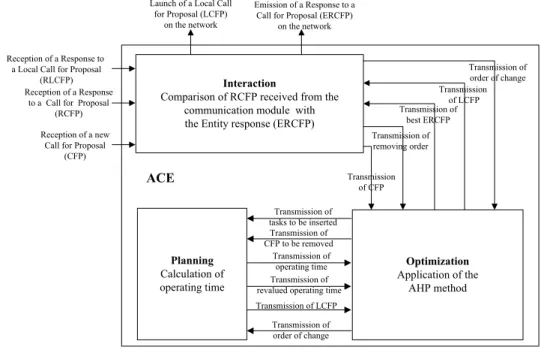
of the criteria defined by the supplier. This data, which depends on planning state and on equipment availability, is supplied by the planning module. The interaction module matches the performance given by the optimization module with the better known performance and sends it to the network if it is the best one (Figure 3). The various messages circulating on the network can be summarized as follows: CFP, RCFP, LCFP (Local Call For Proposals launched by the entity), RLCFP (Response to a local Call For Proposals: response proposed by one partner of the network), ERCFP Entity Response to a Call For Proposals launched by a partner).
Figure 3 Autonomous Control Entity incorporated into a supplier Resource Holon
Interaction
Comparison of RCFP received from the communication module with the Entity response (ERCFP)
Optimization Application of the AHP method Planning Calculation of operating time Transmission of CFP Transmission of removing order Transmission of best ERCFP Transmission of LCFP Transmission of tasks to be inserted Transmission of CFP to be removed Transmission of operating time Transmission of revalued operating time Transmission of LCFP Launch of a Local Call
for Proposal (LCFP) on the network
Emission of a Response to a Call for Proposal (ERCFP)
on the network
Reception of a new Call for Proposal
(CFP) Reception of a Response
to a Call for Proposal (RCFP) Reception of a Response to
a Local Call for Proposal (RLCFP) ACE Transmission of order of change Transmission of order of change
In the proposed approach, each network partner contributes to achieve the common goal of collectively ensuring the dispatching of orders coming from different customers through a competition between the potentially able suppliers, while respecting the interest of each partner. Because each supplier has a finite capacity, it is necessary to respect a balance between load and capacity at supplier level. As a consequence, load curve smoothing is automatically produced, which allows establishing a fair load sharing scheme among the network suppliers.
It can be noticed that network partners can have divergent interests in the proposed approach. Indeed, this is taken into account by the possibility for each customer to indicate that he prefers to work with a designated supplier, knowing the eventual productivity loss that such a decision might yield. Each supplier can define his own preferences regarding the criteria and indicators that are used to evaluate his performance for identifying the calls for proposals (CFPs) on which he will negotiate. Thus, this approach allows ensuring automatic order distribution through negotiation between potential suppliers able to respond to a CFP, based on common and impartial rules, while leaving some degrees of freedom to each partner.
With aim to verify the validity of the proposed self organized control approach, a set of tests have been performed in two steps. First, conventional operations of a whole logistic chain, working in parallel and sharing enterprise occupation in a pre-established way have been modelled and simulated with the ARENA tool. Then,
the same set of tests has been performed with the self organized environment, enhancing dynamic allocation of orders. Comparing the results obtained with the two types of simulations allows pointing out the benefit of the proposed approach.
Each ACE was modelled according to the DEVS formalism (Mekaouche, Ounnar, Pujo and Giambiasi, 2005b) in order to integrate the models into a distributed simulation environment (Ounnar, Pujo, Zahaf and Giambiasi, 2006) for the simulation of the self organized approach. In distributed simulation, the partners of a logistic chain can study the chain optimization via simulation without sharing confidential data. It is this particular advantage that lead to choose distributed simulation to validate our method. We looked at the HLA (High Level Architecture) standard which ensures synchronization between the simulations, contrary to all the other architectures (DIS, ALSP, CORBA, etc.). HLA is also characterized by the two important properties of interoperability1 and reutilisability2.
The following section includes an overview presentation of HLA and the presentation of the mock-up for self organized control of a logistic partnership network.
5
Simulation mock-up
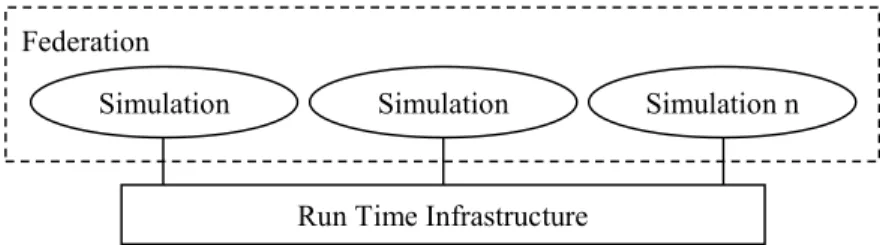
HLA (High level Architecture), which was proposed by the DMSO (Defense Modelling and Simulation Office) under the sponsorship of the US Department of Defense, is a distributed simulation environment. In HLA, each participating simulation is called federate. It is interacting with other federates within a HLA federation. The Run Time Infrastructure (RTI) is the distributed exploitation system through which all federated simulations communicate. It implements the programming interface specifications. It offers common services to all federates (Figure 4).
Figure 4 Operating principle of HLA
The HLA architecture is described on one hand by the set of rules defining responsibilities of the federates and of the federation and their relationships (IEEE P1516). On the other hand, it is described by the OMT (Object Modelling Template) (IEEE P1516.2) which provides a common standard documentation for the two types of object models specified by HLA, the Simulation Object Model (SOM) and the Federation Object Model (FOM). The first model defines all the objects and their interactions related to a federate, while the second model defines all the object models, the communication between federates and other information related to the interoperability
1 This concept implies the capability to combine simulation components on distributed platforms of different types,
often with real-time operation capability. This approach implies to rethink the way simulation components interact with each others in a traditional program on a single computer, for the context of several programs executed in distributed computers and interacting on each others through a real-time distributed exploitation system.
2 Means that the models of the simulation components can be re-used in different simulation applications. Reusable
simulation components can be combined with other components without code development. Federation
Run Time Infrastructure Simulation
of the federates within a federation. Finally, HLA is described by the HLA interface specifications (IEEE P1516.1) representing the functional interface specification between federates and the RTI. In other words, the HLA interface specifications indicate how federates interact during the execution of the federation through the RTI.
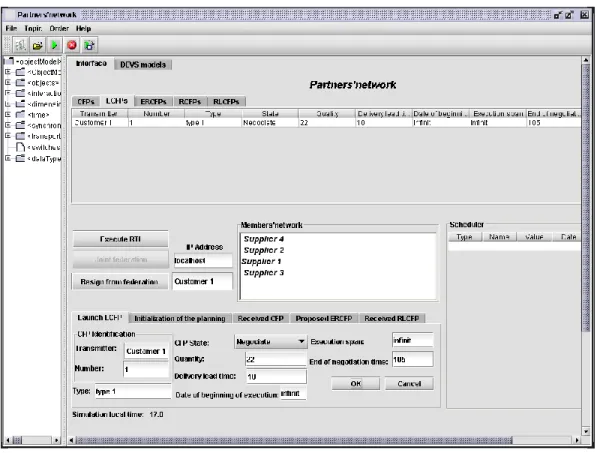
The self organized approach described in the above sections was implemented in a mock-up using JAVA language. Simulating the approach allows to illustrate the internal behaviour of an ACE and the behaviour of an ACE with other ACEs (i.e., the self organization) in their attempt to seek the best response to a call for proposals. Starting from the interface (Figure 5), a partner can become a member of an enterprise network (A) or resign from a network (B). The interface offers to each ACE the possibility to launch local calls for proposals (C). Each ACE can receive answers to local calls (D). It can also receive answers to calls for proposals launched by other members of the enterprise network.
Figure 5 ACE federate interface
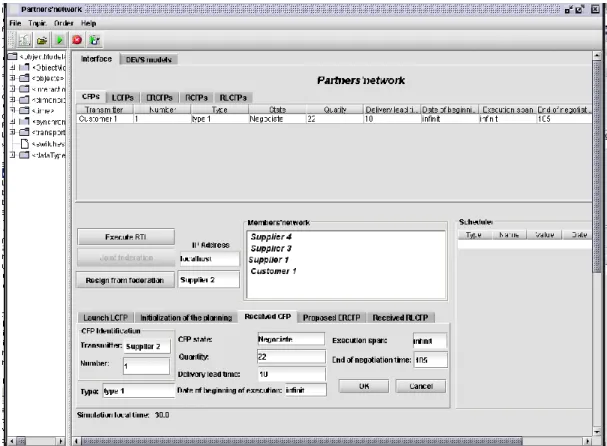
Let us suppose that a customer (customer1) on figure 5, broadcasts on the network a call for proposals containing the following information: the work type to be performed (in technical terms), the maximum expected delay (here, 10 days)… The CFP will be broadcasted to all the network partners through the HLA interactions. Figure 6 shows a CFP reception by a supplier (Supplier 2).
6
Validation
A set of realistic tests was built in order to evaluate the proposed approach. The tests were first modelled and simulated with the ARENA tool (Taïbi and Ounnar, 2006). Then, they were implemented in the self-organized environment. Comparing the results from both simulations allows pointing out the advantages of self organization.
Figure 6 Reception of a CFP by a Supplier
The tests are related to a network made of 17 enterprises (Ai, Bj, Ck, Dl, Em, Mn) whose activities are summarized in table 1.
Table 1 Enterprise activities
Activities Enterprises
Cosmetic product design and production A1, A2, A3, A4
Plastic product fabrication A1, C1, C2, C3
Product conditioning in glass containers A1, A4, D1, D2, D3
Paper and cardboard production and transformation B1, B2, E1, E2
Paper packaging of products B1, B2, B3
Printing M1, M2
Serigraphy B2, M1, M2
Plastic conditioning for products A2, C1, C2, C3
Flexible tube manufacturing D1, D2, D3
Flexible tube conditioning D1, D2, D3
These enterprises are involved at different level of the logistic chain (Figure 7) and can produce 16 types of products coming from 5 base products. An enterprise can be a customer or a supplier according to the manufactured product (for instance A2 may subcontract printing to M1 or to M2). Each enterprise is characterized with its name, activities, activity codes, load per activity, maximum capacity per activity and number of resources per activity. There are 16 logistic chains corresponding to the flows of the 16 different product types. The tests have been designed so that small perturbations with respect to nominal operations (such as the increase of ordered product quantities) generate strong organizational perturbations in flow progress (blockage, saturation).
Figure 7 Sub contracting levels
6.1 ARENA simulation: the classical approach
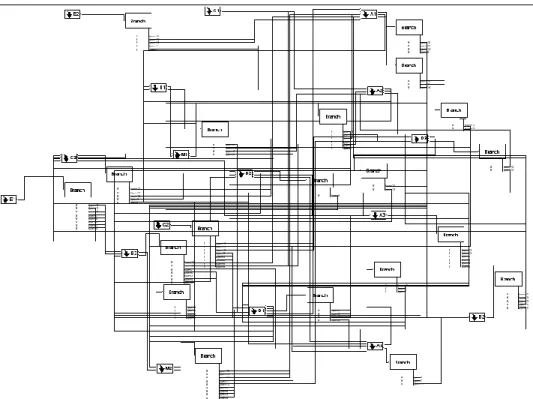
Modelling and simulation of the manufacturing of 16 product types by the 17 enterprises of the network was done with ARENA (Figure 8). The aim was to show the impact of perturbations on customer/supplier relationships all along the production cycle.
Figure 8 The global Arena Model
A1 A2 A3 A4 D1 D3 D2 C1 C3 C2 B1 B3 B2 E1 M1 E2 M2
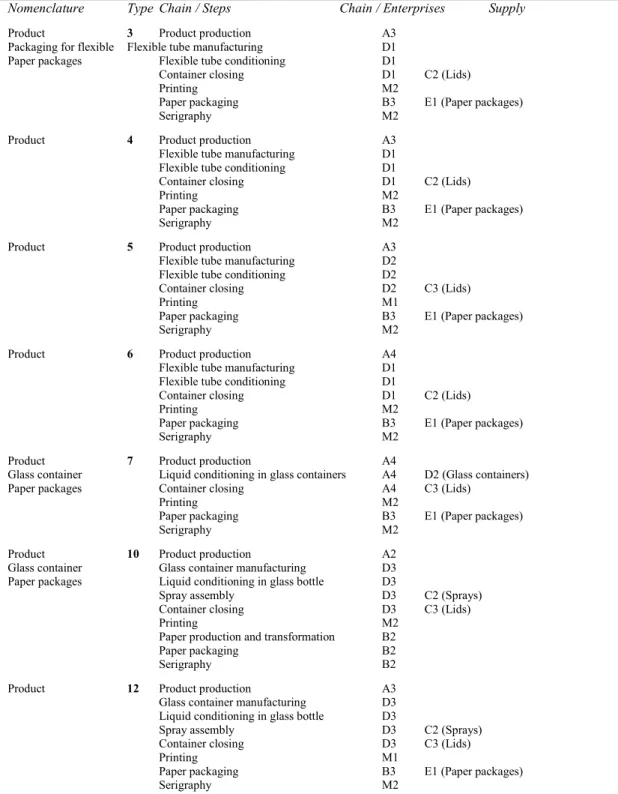
We consider in this paper a reduced number of enterprises; those for which their operations are the most sensitive to flow variations. This led to consider seven product types out of the sixteen (types 3, 4, 5, 6, 7, 10 and 12). The bill of materials and the enterprises involved in manufacturing the seven product types are shown in table 2. It can be seen that for product type 3, enterprise A3 manufactures the product and subcontracts flexible tube conditioning to enterprise D1. On its side, D1 is supplied by C2 with plastic items for container closing. Then, D1 subcontracts printing to M2 and paper packaging to B3 which is supplied with paper packages by enterprise M2.
Table 2 The selected seven product types
Nomenclature Type Chain / Steps Chain / Enterprises Supply
Product 3 Product production A3
Packaging for flexible Flexible tube manufacturing D1 Paper packages Flexible tube conditioning D1
Container closing D1 C2 (Lids)
Printing M2
Paper packaging B3 E1 (Paper packages)
Serigraphy M2
Product 4 Product production A3
Flexible tube manufacturing D1 Flexible tube conditioning D1
Container closing D1 C2 (Lids)
Printing M2
Paper packaging B3 E1 (Paper packages)
Serigraphy M2
Product 5 Product production A3
Flexible tube manufacturing D2 Flexible tube conditioning D2
Container closing D2 C3 (Lids)
Printing M1
Paper packaging B3 E1 (Paper packages)
Serigraphy M2
Product 6 Product production A4
Flexible tube manufacturing D1 Flexible tube conditioning D1
Container closing D1 C2 (Lids)
Printing M2
Paper packaging B3 E1 (Paper packages)
Serigraphy M2
Product 7 Product production A4
Glass container Liquid conditioning in glass containers A4 D2 (Glass containers)
Paper packages Container closing A4 C3 (Lids)
Printing M2
Paper packaging B3 E1 (Paper packages)
Serigraphy M2
Product 10 Product production A2
Glass container Glass container manufacturing D3 Paper packages Liquid conditioning in glass bottle D3
Spray assembly D3 C2 (Sprays)
Container closing D3 C3 (Lids)
Printing M2
Paper production and transformation B2
Paper packaging B2
Serigraphy B2
Product 12 Product production A3
Glass container manufacturing D3 Liquid conditioning in glass bottle D3
Spray assembly D3 C2 (Sprays)
Container closing D3 C3 (Lids)
Printing M1
Paper packaging B3 E1 (Paper packages)
The considered perturbation is to increase the ordered quantity of each of the seven product types. During a same period (same week), all the final customers of the seven logistic chains order product quantities larger than what they usually ask for. Increased quantities are summarized in table 3.
Table 3 Batches orders by customers
Customer Product Type Usual Batch Quantity New Batch Quantity
Customer 1 Type 3 20000 25000 Type 4 15000 17000 Customer 2 Type 5 30000 34000 Type 6 17000 21000 Customer 3 Type 7 43000 51000 Customer 4 Type 10 18000 26000 Type 12 22000 27000
A reporting system was put in place in the ARENA model of the seven chains with the objective to collect data on circulating products, such as batch arrival date or total time in enterprise, in order to study perturbation impact on the chains.
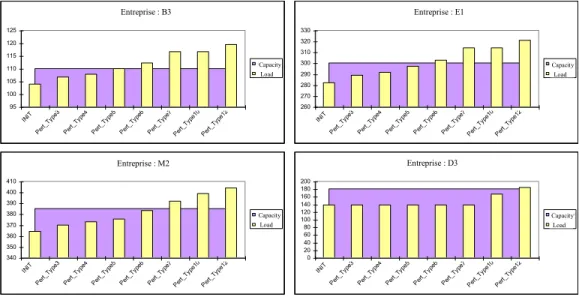
Size increase of all the ordered batches leads to exceed the maximum capacity of the enterprises belonging to several chains concerned with perturbed product flows. Figure 9 shows capacity overshoot for enterprises B3, E1 and M2 which are interacting with respect to product type flows 3, 4, 5, 6, 7 and 12. These overshoots are rather important, contrary to the capacity overshoot of enterprise D3 which is concerned only by product type flows 10 and 12.
Figure 9 Global load of enterprises B3, D3, E1, M2
The impact of batch size perturbations with the same product types is presented below for the self organized model in order to compare the classical approach with the self organized approach.
Company : B3 95 100 105 110 115 120 125 INIT Pert_ Type 3 Pert_ Type 4 Pert_ Type 5 Pert_ Type 6 Pert_ Type 7 Pert_ Type 10 Pert_ Type 12 Capacity Charge Company : D3 0 20 40 60 80 100 120 140 160 180 200 INIT Pert_ Type 3 Pert_ Type 4 Pert_ Type 5 Pert_ Type 6 Pert_ Type 7 Pert_ Type 10 Pert_ Type 12 Capacity Charge Company : E1 260 270 280 290 300 310 320 330 INIT Pert_ Type 3 Pert_ Type 4 Pert_ Type 5 Pert_ Type 6 Pert_ Type 7 Pert_ Type 10 Pert_ Type 12 Capacity Charge Company : M2 340 350 360 370 380 390 400 410 INIT Pert_ Type 3 Pert_ Type 4 Pert_ Type 5 Pert_ Type 6 Pert_ Type 7 Pert_ Type 10 Pert_ Type 12 Capacity Charge Capacity Load Capacity Load Capacity Load Capacity Load Entreprise : M2 Entreprise : D3 Entreprise : B3 Entreprise : E1 Company : B3 95 100 105 110 115 120 125 INIT Pert_ Type 3 Pert_ Type 4 Pert_ Type 5 Pert_ Type 6 Pert_ Type 7 Pert_ Type 10 Pert_ Type 12 Capacity Charge Company : D3 0 20 40 60 80 100 120 140 160 180 200 INIT Pert_ Type 3 Pert_ Type 4 Pert_ Type 5 Pert_ Type 6 Pert_ Type 7 Pert_ Type 10 Pert_ Type 12 Capacity Charge Company : E1 260 270 280 290 300 310 320 330 INIT Pert_ Type 3 Pert_ Type 4 Pert_ Type 5 Pert_ Type 6 Pert_ Type 7 Pert_ Type 10 Pert_ Type 12 Capacity Charge Company : M2 340 350 360 370 380 390 400 410 INIT Pert_ Type 3 Pert_ Type 4 Pert_ Type 5 Pert_ Type 6 Pert_ Type 7 Pert_ Type 10 Pert_ Type 12 Capacity Charge Capacity Load Capacity Load Capacity Load Capacity Load Entreprise : M2 Entreprise : D3 Entreprise : B3 Entreprise : E1
- "INIT" represent the initial load, identified for each company.
6.2 Mock-up simulation: self organized approach
Calls for Proposals (CFPs) have been launched at four levels.
First level: This is the same as for the ARENA simulation. The four customers launch seven CFPs for the manufacturing of cosmetic products: type 3 (CFP N°2), type 4 (CFP N°3), type 5 (CFP N°4), type 6 (CFP N°5), type 7 (CFP N°6), type 10 (CFP N°7) and type 12 (CFP N°8).
Enterprises A1, A2, A3 and A4 enter in competition to answer the CFPs. For that, they evaluate themselves by using the multicriteria methods AHP.
Simulation results are illustrated in table 4.
Table 4 Responses of enterprises A1, A2, A3 et A4
Results show that A1 is better for product types 3 and 7, A2 is better for product types 4 and 5 while A3 is better only for type 6. A4 is better on the two remaining product types 10 and 12.
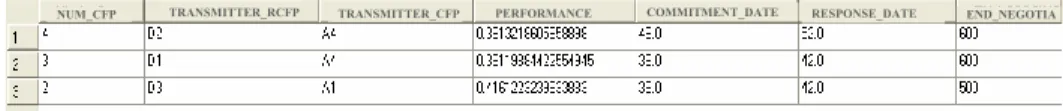
Second level: Enterprises A1, A2 and A3 launch CFPs for flexible tube conditioning concerning product types 3, 4, 5, 6 (Table 5), in the following order: type 3 (CFP N° 2), type 4 (CFP N°3), type 5 (CFP N°4) and type 6
(CFP N°5).
Table 5 Responses of enterprises D1, D2 and D3 to the CFPs for flexible tube conditioning
Contrary to the classical approach, in which the four product types are addressed by one of the two enterprises D1 or D2, the self organized approach allocates type 6 to D3, types 4 and 5 to D2 and type 3 to D1.
Furthermore, having taken product types 7, 10 and 12, enterprises A1 and A4 launch CFPs for the manufacturing of glass containers (Table 6) in the following order: type 7 (CFP N° 2), type 10 (CFP N°3) and type 12 (CFP N°4)
Table 6 Responses of enterprises D1, D2 and D3 to the CFPs for glass container manufacturing
TRANSMITTER_RCFP NUM_CFP TRANSMITTER_CFP Supplier 1 Supplier 3 Supplier 4 Supplier 2 Supplier 2 Supplier 1 Supplier 1 PERFORMANCE COMMITMENT_DATE TRANSMITTER_RCFP NUM_CFP TRANSMITTER_CFP Supplier 1 Supplier 3 Supplier 4 Supplier 2 Supplier 2 Supplier 1 Supplier 1 PERFORMANCE COMMITMENT_DATE
NUM_CFP TRANSMITTER_RCFP TRANSMITTER_CFP PERFORMANCE COMMITMENT_DATE RESPONSE_DATE END_NEGOTIATION_RCFP NUM_CFP TRANSMITTER_RCFP TRANSMITTER_CFP PERFORMANCE COMMITMENT_DATE RESPONSE_DATE END_NEGOTIATION_RCFP
NUM_CFP TRANSMITTER_RCFP TRANSMITTER_CFP PERFORMANCE COMMITMENT_DATE RESPONSE_DATE END_NEGOTIA NUM_CFP TRANSMITTER_RCFP TRANSMITTER_CFP PERFORMANCE COMMITMENT_DATE RESPONSE_DATE END_NEGOTIA
Table 6 shows that the CFPs launched by A4 for the two product types 10 and 12 are allocated respectively to D1 and D2, while enterprise D3 is given type 7.
Then, enterprise A4 launches CFPs for the fabrication of plastic items for container closing for types 10 (CFP no 2) and 12 (CFP no 3), in this order (table 7).
Table 7 Responses of enterprises A1 and C1 to the CFPs for plastic items manufacturing
Table 7 indicates that enterprise A1 is given product type 10 and C1 is given type 12.
Finally enterprise A4 launches CFPs for the manufacturing of plastic items for containers closing for both product types.
Third level: Three types of CFPs are launched for plastic product manufacturing (container lids), printing and paper packaging. These CFPs are launched by enterprises D1, D2, D3, A1 and A4. Simulation results are presented below.
CFPs for plastic product manufacturing: they concern type 3 (CFP N° 2), type 4 (CFP N°3), type 5 (CFP N°4), type 6 (CFP N°5), type 10 (CFP N°6) and type 12 (CFP N°7).
Table 8 Responses of enterprises C1, C2, C3 and A1
Table 8 shows that product types 10 and 12 are given to enterprise C3, types 4 and 6 are given to C1, C2 is given type 5 and A1 is given type 3.
Tables 9 and 10 below can be analyzed the same way.
CFPs for printing: the launching order concerns type 3 (CFP N° 2), type 4 (CFP N°3), type 5 (CFP N°4), type 6 (CFP N°5), type 7 (CFP N°6), type 10 (CFP N°7) and type 12 (CFP N°8).
Table 9 Responses of enterprises M1 and M2
CFPs for paper packaging: they concern type 3 (CFP N° 2), type 4 (CFP N°3), type 5 (CFP N°4), type 6 (CFP N°5), type 7 (CFP N°6), type 10 (CFP N°7) and type 12 (CFP N°8).
NUM_CFP TRANSMITTER_RCFP TRANSMITTER_CFP PERFORMANCE COMMITMENT_DATE RESPONSE_DATE END_NEGOTIA NUM_CFP TRANSMITTER_RCFP TRANSMITTER_CFP PERFORMANCE COMMITMENT_DATE RESPONSE_DATE END_NEGOTIA
NUM_CFP TRANSMITTER_RCFP TRANSMITTER_CFP PERFORMANCE COMMITMENT_DATE RESPONSE_DATE END_NEGOTIATION_RCFP NUM_CFP TRANSMITTER_RCFP TRANSMITTER_CFP PERFORMANCE COMMITMENT_DATE RESPONSE_DATE END_NEGOTIATION_RCFP
NUM_CFP TRANSMITTER_RCFP TRANSMITTER_CFP PERFORMANCE COMMITMENT_DATE RESPONSE_DATE END_NEGOTIATION_RCF NUM_CFP TRANSMITTER_RCFP TRANSMITTER_CFP PERFORMANCE COMMITMENT_DATE RESPONSE_DATE END_NEGOTIATION_RCF
Table 10 Responses of enterprises B1, B2 and B3
Fourth level: Paper packages should be manufactured before packaging. Since enterprise B3 cannot do it, it must launch a CFP for paper package
fabrication in relation to product type 6. Furthermore, enterprises B1 and B2 are not able to manufacture paper for all ordered product types due to full planning. They must thus launch CFPs for paper production. B1 launches a CFP for product type 10 and B2 launches a CFP for type 4. The CFPs are launched in the following order: type 10 (CFP N°1), type 4 (CFP N°2) and type 6 (CFP N°3). Table 11 shows CFP allocation to enterprises E1 and E2.
Table 11 Responses of enterprises E1 and E2
After paper packaging is done, the enterprises should undertake serigraphy for the seven product types. B2 is the only enterprise among B1, B2 and B3 to perform serigraphy. However, B2 planning does not allow performing serigraphy for the four product types. Thus, B2 launches two CFPs for the serigraphy of product types 4 and 12. Similarly, enterprise B1 launches two CFPs for product types 3 and 10 and B3 launches one CFP for product type 6. The CFPs are launched in the following order: type 3 (N°2), type 10 (N°3), type 4
(N°4), type 12 (N°5) and type 6 (N°6). Results are presented in table 12.
Table 12 Responses of enterprises M1 and M2
NUM_CFP TRANSMITTER_RCFP TRANSMITTER_CFP PERFORMANCE COMMITMENT_DATE RESPONSE_DATE END_NEGOTIATION_RCF NUM_CFP TRANSMITTER_RCFP TRANSMITTER_CFP PERFORMANCE COMMITMENT_DATE RESPONSE_DATE END_NEGOTIATION_RCF
NUM_CFP TRANSMITTER_RCFP TRANSMITTER_CFP PERFORMANCE COMMITMENT_DATE RESPONSE_DATE NUM_CFP TRANSMITTER_RCFP TRANSMITTER_CFP PERFORMANCE COMMITMENT_DATE RESPONSE_DATE
NUM_CFP TRANSMITTER_RCFP TRANSMITTER_CFP PERFORMANCE COMMITMENT_DATE RESPONSE_DATE END_NEGOTIATION_RCFP NUM_CFP TRANSMITTER_RCFP TRANSMITTER_CFP PERFORMANCE COMMITMENT_DATE RESPONSE_DATE END_NEGOTIATION_RCFP
Graphical representations have been used to show enterprise load balance. Figure 10 shows the load of each enterprise compared to its maximum capacity. Figure 11 shows the occupation rate of each enterprise with the classical approach (TO-Class) and with the self organized approach (TO-Auto), with respect to their activities (a) and with respect to the global enterprise load (b).
Figure 10 Global load for B3, D3, E1 and M2 (self organized approach)
Figure 11 Occupation rate (a): for A2, A4, B2, C2, C3, D1, D2, D3, E1, M1
(b): for B3, D3, E1 and M2
6.3 Comparison of results (classical approach versus self-organized approach)
It can be noticed that the classical approach does not give much choice to the suppliers and to the customers. Indeed, each customer has its own suppliers who are given the same orders every week. The suppliers of a given customer know ahead of time the orders to come and do not anticipate additional orders. Thus, if a customer asks for an increased quantity (like for instance for product type 12), delivery will be delayed. The delay is known by the customer who can get organized accordingly. However, if a supplier concerned with the perturbed order interacts with several production chains, he will see its capability exceeded, which will yield
Company : B3 100 101 102 103 104 105 106 107 108 109 110 111
INIT Level1 Level2 Level3 Level4
Capacity Charge Company : D3 0 20 40 60 80 100 120 140 160 180 200
INIT Level1 Level2 Level3 Level4
Capacity Charge Company : E1 270 275 280 285 290 295 300 305
INIT Level1 Level2 Level3 Level4
Capacity Charge Company : M2 350 355 360 365 370 375 380 385 390
INIT Level1 Level2 Level3 Level4
Capacity Charge Capacity Load Capacity Load Capacity Load Capacity Load Entreprise : M2 Entreprise : D3 Entreprise : B3Company : B3 Entreprise : E1
100 101 102 103 104 105 106 107 108 109 110 111
INIT Level1 Level2 Level3 Level4
Capacity Charge Company : D3 0 20 40 60 80 100 120 140 160 180 200
INIT Level1 Level2 Level3 Level4
Capacity Charge Company : E1 270 275 280 285 290 295 300 305
INIT Level1 Level2 Level3 Level4
Capacity Charge Company : M2 350 355 360 365 370 375 380 385 390
INIT Level1 Level2 Level3 Level4
Capacity Charge Capacity Load Capacity Load Capacity Load Capacity Load Entreprise : M2 Entreprise : D3 Entreprise : B3 Entreprise : E1 0 20 40 60 80 100 120 140 A2/F cos A4/C ver A4/B ouch B2/S erig C2/F plas C3/F plas D1/F ts D1/C ts D1/B ouch D2/F ver D3/F ver E1/F pap M1/ Impr M2/ Impr M2/ Serig Capacité TO_Class TO_Auto Capacity TO_Class TO_Auto 0 20 40 60 80 100 120 140 A2/F cos A4/C ver A4/B ouch B2/S erig C2/F plas C3/F plas D1/F ts D1/C ts D1/B ouch D2/F ver D3/F ver E1/F pap M1/ Impr M2/ Impr M2/ Serig Capacité TO_Class TO_Auto Capacity TO_Class TO_Auto 0 20 40 60 80 100 120 B3 D3 E1 M2 Capacité TO_Class TO_Auto Capacity TO_Class TO_Auto 0 20 40 60 80 100 120 B3 D3 E1 M2 Capacité TO_Class TO_Auto Capacity TO_Class TO_Auto
delays on the products of other customers who did not ask for additional quantities and who will thus not be informed of delays (this is the case for product types 13 and 11).
In the self-organized model, contrary to the classical model in which chains are static and customers launch orders only to their own suppliers, customers launch their CFPs on a network and potential suppliers enter into negotiation to provide the best answers to customers’ expectations. In this way, the chains for the seven products will not be the same ones as with the classical approach and new chains will be built. The new chains are progressively built as the CFP related orders are allocated to the suppliers providing the best performance. Best performance assumes that a supplier takes the CFP for which he is the best one, which guarantee improved customer satisfaction. The proposed approach generates load smoothing in each enterprise (Figures 10 and 11) and reduces the classical approach delay problems due to exceeded capacity (Figure 9).
7
Conclusion
The proposed approach provides a balance between load and capacity at the supplier level and produces a load curve smoothing among the suppliers of a network. The approach also produces sharing of earnings, optimization of resources, reduction of malfunctioning, and productivity increase for the whole supply chain. Self-organized control is characterized with an organizational architecture of the type flat holonic form. Each enterprise involved in a logistic chain becomes a Resource Holon when it is associated with a decision making entity, called ACE for Autonomous Control Entity, providing the capability to interact with other enterprises. In order to validate the proposed approach we have, in a first step, modeled the ACE using DEVS formalism (Mekaouche, Ounnar, Pujo and Giambiasi, 2005a; b). Distributed simulation was sought to enforce confidentiality of the network partners’ data. The DEVS models have been integrated into a HLA (High Level Architecture) simulation. The HLA architecture was chosen with the aim to be able to highlight the advantages of the proposed approach through simulations performed in parallel to real operations without disturbing the real system. The HLA architecture allows deploying the proposed approach on an industrial case. The integration of the DEVS models into the HLA makes a simulation mock-up for self-organized control of a logistic network. The proposed approach was compared with the classical approach. For that, a study case was built first. The case data were adjusted so that small disturbances (e.g. increase of ordered quantities by a customer to its supplier) with respect to nominal operations generate strong organizational disturbances (e.g. blocking, saturation). The classical approach for the study case was modeled and simulated with the Arena tool. Then, the study case data were implemented in the self-organized environment (Simulation mock-up). Finally, a disturbance impact analysis was performed for both approaches.
If the optimization of logistic networks is to be efficiently implemented, a change in attitude and philosophy is needed. Companies must get together to propose a general service, rather than trying to compete. They must work together in seeking better productivity. Induced new ways of supplying and subcontracting require improved dialogue and a cultural evolution relying on cooperation rather than on confrontation. This is why our work perspective is oriented towards seeking a professional sector to conduct real life experimentation.
8
References
Alcouffe, C. and Corrégé, N. (2004) 'Structures de gouvernance dans l’entreprise étendue : l’exemple AIRBUS', Notes 393 de
LIRHE.
Bongaerts, L., Monostori, L., McFarlane, D. and Kadar, B. (2000) 'Hierarchy in distributed shop floor control', Computers In
Industry, Vol 43, pp. 123-137.
Brito, C.M. and Roseira, C. (2003) 'A Model for the Understanding of Supply Chain Networks', Proceedings of the 19th annual
Industrial Marketing and Purchasing Conference, University of Lugano, 4th- 6th, Lugano, Switzerland.
Brun, A. and Portioli-Staudacher, A. (2000) 'Negotiation-driven supply chain co-ordination for small and medium enterprise', ECAI Workshop Notes – Agent Technologies and Their Application Scenarios in Logistics - Proceedings of the 14th European
Conference on Artificial Intelligence, Berlin.
Chen, H., Amodeo, L. and Chu, F. (2001) 'Modelling and performance evaluation of supply chain with Batch deterministic and stochastic petri nets', Proceedings of the 13th European Simulation Symposium, pp. 415-419.
Corrégé, N. (2001) 'Evaluation de la relation Client-Fournisseur : mise en oeuvre d'un système d'évaluation globale des
fournisseurs et sous-traitants de l'aérospatiale', PhD, Université des sciences sociales, Toulouse.
Cousins, P.D. and Spekman, R. (2003) 'Strategic supply and the management of inter- and intra- organizational relation ships',
Journal of Purchasing and Supply Management. Vol 9, No1.
Despontin, E., Briand, C. and Esquiral, P. (2002) 'Premier pas pour une aide à la coopération inter-entreprises aux niveaux opérationnels', Proceedings of the ‘GRP days’, Tarbes.
Dong, J. Zhang, D. and Nagurney, A. (2002) 'Supply chain networks with Multicriteria Decision-Makers'. Transportation and
Traffic Theory in the 21st Century, M.A.P, pp. 179-196.
Faems, D. and Looy, B.V. (2003) 'The role of inter organisational collaboration within innovation strategies : towards a portfolio approach', Proceedings of the 10th International Product Development Management Conference, EIASM, Brussels (Belgium).
Gentili, E., Cicco, A. and Santucci, J. (2004) 'Modelling of manufacturing process using Petri nets and Fuzzy logic', Proceedings
of the International Mediteranean Modelling Multiconference.
Harri, I.K. (2002) 'Accounting in customer-supplier relationships: Developing cost management in customer-supplier relationships: three case studies', Proceedings of the 3rd Conference on New Directions in Management Accounting: Innovations in
Practice and Research, Vol 2. pp. 699-716, Brussels, Belgium.
Haurat, A. (2002) 'DRE- Dynamique des relations entre enterprises : la relation donneur d’ordres – fournisseur', Proceedings of the
‘GRP days’, Grenoble.
Holmlund-Rytkönen, M. and Strandvik, T. (2005) 'Stress in business relationships', Journal of Business and Industrial Marketing, Vol 20, n°1, pp. 12-22 (11).
IEEE P1516. 'Draft standard for Modeling and Simulation (M&S) High Level Architecture (HLA) – Framework and Rules'. IEEE P1516.2. 'Draft standard for Modeling and Simulation (M&S) High Level Architecture (HLA) – Object modeling Template
(OMT) Specification'.
IEEE P1516.1. 'Draft standard for Modeling and Simulation (M&S) High Level Architecture (HLA) – Federate Interface Specification'.
IMS. (1997), Proceedings of the 4th IFAC Workshop on Intelligent Manufacturing Systems, July 21-23, Seoul, Korea. Edited by Jongwon Kim, Seoul National University, PERGAMON, ISBN 0-08-043025-2.
Lauras, M. (2004) 'Méthodes de diagnostic et d’évaluation de performance pour la gestion de chaînes logistiques : application à la
coopération maison-mére-filiale internationales dans un groupe pharmaceutique et cosmétique'. PhD, INPT, Toulouse.
Mekaouche, L., Ounnar, F., Pujo, P. and Giambiasi, N. (2006) 'Another way to manage supply chain', Proceedings of the
International Conference on Information Systems, Logistics and Supply Chain (ILS’06), Lyon, France.
Mekaouche, L., Ounnar, F., Pujo, P. and Giambiasi, N. (2005a) 'Modélisation DEVS de la gestion des appels d’offres au niveau d’un réseau de chaîne logistique auto organisé', Proceedings of the 6e Congrès International de Génie Industriel, Besançon. Mekaouche, L., Ounnar, F., Pujo, P. and Giambiasi, N. (2005b) 'Customers–Suppliers Relationship Self Organized Control
Modeling using DEVS formalism', Proceedings of the 17th IMACS World Congress Scientific Computation, Applied
Mathematics and Simulation, Paris, France.
Mekaouche, L., Ounnar, F. Pujo, P. and Giambiasi, N. (2005c) 'Management of Calls for proposals within self organized enterprises network', Proceedings of the 21st Annual Industrial Marketing and Purchasing Conference (IMP), Rotterdam.
Mekaouche, L., Ounnar, F., Pujo, P. and Giambiasi, N. (2005d) 'Self Evaluation of Company’s Performance in partnership network',
Proceedings of the International Engineering Management (IEMC) Conference, St John’s Newfoundland, Canada.
Moynihan, G.P., Saxena, P. and Fonseca D.J. (2006) ‘Development of a decision support system for procurement operations’.
International Journal of Logistics Systems and Management 2006 - Vol. 2, No.1 pp. 1 - 18.
Nesheim, T. (2001) 'Externalization of the core: antecedents of collaborative relationships with suppliers', European Journal of
Purchasing & Supply Management 7, pp. 217–225.
Ounnar, F. (1999) 'Prise en Compte des Aspects Décision dans la Modélisation par Réseaux de Petri des Systèmes Flexibles de
Production'. PhD, Institut National Polytechnique de Grenoble - Laboratoire d’Automatique de Grenoble.
Ounnar, F. and Pujo, P. (2001) 'Décentralisation des mécanismes de pilotage de la relation donneurs d’ordres / fournisseurs',
Proceedings of the 4e congrès international de génie industriel, vol.2, pp. 1175-1185.
Ounnar, F., Pujo, P., Mekaouche, L. and Giambiasi. N. (2004) 'Decentralized Self Organized Control of a Patnership Network in an Intelligent Supply Chain', Proceedings of the IMS International Forum 2004: Global Challenges in Manufacturing, Italy. Ounnar, F., and Pujo, P. (2005). Supplier evaluation process within a self-organized logistical network. International Journal of
Logistics Management, 16 (1), pp. 159-172.
Ounnar, F., Pujo, P., Zahaf, A. and Giambiasi, N. (2006) 'Interoperability of Enterprises Network Holonic Control via HLA',
Proceedings of the INCOM’06 Conference, St Etienne, France.
Ounnar. F, Pujo. P., Mekaouche. L. and Giambiasi. N. (2007). Customers-Suppliers Relationship Management in an intelligent Supply Chain. International Journal of Production, Planning and Control, to appeared.
Pradosh, N., Sandhya, G.D. and Mrinalini, N. (2005) 'Supply chain as knowledge management', International Journal of Logistic
Systems and Management, Vol. 1, Nos, 2/3.
Saaty. T (1980). 'The Analytic Hierarchy Process'. Mc Hill.
Smith, R.G. (1980) 'The contract net protocol: High-level communication and control in a distributed problem solver', IEEE
Transactions on computers, C629512°/ 1104-1113.
Taïbi, A. and Ounnar, F. (2006) 'Simulation via HLA d’un partenariat de clients fournisseurs en réseau contractuel', Rapport interne, Laboratoire des Sciences de l’Information et des systèmes.
Telle, O. (2003) 'Gestion de chaînes logistiques dans le domaine aéronautique : aide à la coopération au sein d’une relation
Donneur d’Ordres/Fournisseur', PhD, ENSAE, Toulouse.
Toolea, T. and Donaldsonb, B. (2002) 'Relationship performance dimensions of buyer–supplier exchanges', European Journal of
Purchasing & Supply Management 8, pp. 197–207
Van Brussel, H., Wyns, J., Valckenears, P., Bongaerts, L., and Peeters, P. (1998) 'Reference architecture for holonic manufacturing systems: PROSA', Computers in Industry, 37 (3), pp. 255-276.
Villa, A. (1998) 'Organizing a ‘network of entreprises’: an object-oriented design methodology', Computer Integrated