HAL Id: hal-01788931
https://hal-amu.archives-ouvertes.fr/hal-01788931
Submitted on 9 May 2018
HAL is a multi-disciplinary open access archive for the deposit and dissemination of
sci-L’archive ouverte pluridisciplinaire HAL, est destinée au dépôt et à la diffusion de documents
Optical characterizations of silver nanoprisms embedded
in polymer thin film layers
Miriam Carlberg, Florent Pourcin, Olivier Margeat, Judikaël Le Rouzo,
Gérard Berginc, Rose-Marie Sauvage, Jörg Ackermann, Ludovic Escoubas
To cite this version:
Miriam Carlberg, Florent Pourcin, Olivier Margeat, Judikaël Le Rouzo, Gérard Berginc, et al.. Optical characterizations of silver nanoprisms embedded in polymer thin film layers. Journal of Nanophotonics, Society of Photo-optical Instrumentation Engineers, 2017, 11 (4), �10.1117/1.JNP.11.043504�. �hal-01788931�
Optical characterizations of silver nanoprisms embedded in polymer
thin film layers
M. Carlberg1, F. Pourcin2, O. Margeat2, J. Le Rouzo1,*, G. Berginc3, R.-M. Sauvage4, J. Ackermann2 and L. Escoubas1
1Aix Marseille Univ, Université de Toulon, CNRS, IM2NP, Marseille, France 2Aix Marseille Univ, CNRS, CINaM, Marseille, France
3Thales Optronics, Elancourt, France 4DGA/DS/MRIS, 75015 Paris, France
ABSTRACT
The study of the light matter interaction phenomena is driven by the use of metallic nanoparticles. In this context, our work is focused on optical characterization and modeling of polymer thin films layers with inclusions of previously chemically synthesized nanoparticles, resulting in tunable optical properties in the visible wavelength range. The nanoprisms are synthesized by a two-step seed based chemical synthesis in mild conditions, i.e. in water and at room temperature. The plasmonic resonance peaks of the resulting colloidal solutions range from 360 to 1300 nm. Poly vinyl pyrrolidone polymer matrix is chosen for its non-absorbing optical properties and NP-stabilizing properties. Knowledge on the size of the NPs embedded in the spin coated layers is obtained by transmission electron microscopy imaging. The optical properties measurements include spectrophotometry and spectroscopic ellipsometry to get the reflectance, the transmittance, the absorptance and the optical indices n and k of the heterogeneous layers. A redshift in absorption is measured between the colloidal solutions and the deposited layers. FDTD simulations allow calculation of far and near field properties. The visualization of the NP interactions and the electric field enhancement, on and around the NPs, are studied to improve the understanding of the far field properties.
Keywords: Plasmonics, metallic nanoparticles, thin films, optical properties
*Judikaël Le Rouzo, Email: [email protected]
1. Introduction
The control of the light matter interaction phenomena is highly enhanced through the use of metallic nanoparticles (NPs)1,2. Silver and gold NPs are of special interest thank to their unique optical properties, induced by localized surface plasmon resonances (LSPR). At the LSPR wavelengths, the conduction electrons of the NP oscillate coherently, which induce an electric field enhancement. Therefore, the LSPR depend on the constituting material and the environment, but also on the size and shape of the NP. The incoming light at the LSPR is then either strongly absorbed by the NP and then remitted as heat or scattered. These properties make NPs interesting for optical applications in various domains where absorption or reflection of selective wavelengths are required such as in photovoltaics3, cancer diagnosis and treatment4.
Typically, absorption dominates the extinction property for small sizes, whereas scattering dominates for larger NP. In the case of silver nanospheres, absorption dominates up to a diameter of 40 nm5.
With their optical properties in mind, thin film layers with differently sized NPs should result in thin film layers with tunable optical properties, leading to applications of plasmonic thin film layers for photodetectors, imaging sensors or non-reflecting coatings6.
The highest electric field enhancement is achieved for silver NPs7. Furthermore, the LSPR occurs in the visible wavelength range. Through the advances in NP chemistry in the latest years, silver NPs of different sizes and shapes are easily made8. Taking advantage of the variety of existing syntheses, we can choose to produce NPs by a facile wet chemical synthesis at room temperature, using water as solvent. The use of different reagents leads to multiple nanoobjects. We chose to synthetize differently sized nanoprisms because of their absorption of the light through the visible band of the spectrum.
Indeed, our study focuses on the control of the optical behavior of thin film layers by modifying the imaginary part of the complex refractive index. The host matrix is therefore chosen to be transparent and non-absorbing for the absorption to be caused only by the embedded NPs.
As the surrounding material changes the NP properties, a redshift of the resonance wavelength is observed when the NPs are deposited in thin film layers compared to the resonance wavelength in the water. In the following we present the NP synthesis and deposition, the computer modeling methods, optical studies, spectrophotometer and spectroscopic ellipsometry, of thin film layers with differently shaped and sized NP inclusions. Computer modeling of the NPs using finite difference time domain (FDTD) in the different media allows us to validate our measurements.
2. Sample preparation
2.1 Synthesis of silver nanoprisms
The procedure of the two-step seed based chemical synthesis of silver nanoprisms of different sizes is taken from literature9 and slightly adapted to yield stable NPs. In the first step of the synthesis, spherical seeds are produced. By adding poly(sodium styrensulphonate) and trisodium citrates during the seed growth, defects on the seeds are induced. These defects allow the face selective growth of the prisms in the second step of the synthesis, in which silver is reduced by ascorbic acid. For the seed production, 5 ml of 0.5 mM silver nitrate solution is slowly added to a mixture of 5 ml of 2.5 mM trisodium citrate, 0.25 ml of 0.5 g/l poly(sodium styrensulphonate) and 0.3 ml of 10 mM sodium borohydride. The nanoprisms growth is done by slowly adding 3 mL of 0.5 mM silver nitrate to a mixture of 5 ml distilled water, 75 μl of 10 mM ascorbic acid and various quantities of the seed solution.
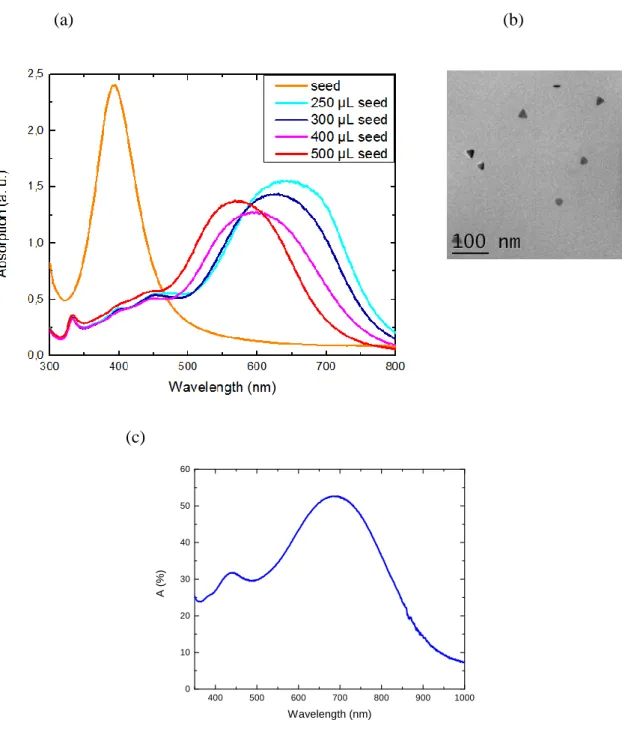
Fig. 1 (a) Absorption spectra of colloidal solutions of the spherical seeds and differently sized nanoprisms
resulting from adding various seed quantities in the second step of the synthesis, (b) TEM image of the produced nanoprisms, (c) absorption spectra of nanoprisms in PVP on glass.
(a) (b) 400 500 600 700 800 900 1000 0 10 20 30 40 50 60 A ( % ) Wavelength (nm) (c)
Fig. 1 (a) shows the absorption of the seed solution and nanoprisms grown for various seed quantity selected. The seed are spherical and have a diameter of about 20 nm, whereas the sizes of the nanoprisms vary from 10 to 50 nm edge size. By choosing a high quantity of seeds in the second step of the synthesis, i.e. 500 L of the seed solution, the produced nanoprisms are smaller than if a lower quantity of seeds is chosen, i.e. 250 L. The LSPR peak is consequently shifted from 575 nm to 650 nm. The thickness of the prisms remains constant at 10 nm for all edge sizes. By increasing the seed quantity used in the second step of the synthesis, the size of the prisms is decreasing. The nature of the different peaks is discussed in section 4.4.1.
2.2 Deposition of the nanoprisms
The NPs are washed by successive centrifugation to concentrate them and remove the unused reagents. The polymer host matrix was chosen to be poly vinyl pyrrolidone (PVP) for its NP stabilizing10 and optical properties. The PVP in solution, at 40 g.l-1, is directly added to the concentrated NPs and then deposited by spin coating on previously cleaned glass or silicon substrates. The substrates are cleaned by successive ultrasonic bath in acetone, ethanol and isopropanol followed by a treatment under ozone gas.
The spin coating speed is chosen between 500 and 1500 rpm for one minute to achieve layers of a few hundred nanometers. The thicknesses of the layers are measured by mechanical stylus profilometer (Brucker Decktak XT). The absorption spectra of the heterogeneous thin film layers are obtained by measuring the reflectance and transmittance. The absorption shown in Fig. 1 (c) is achieved by depositing the 400 L solution at low speed. A redshift of 100 nm shifts the main absorption, due to the change of surrounding medium. The high absorption intensity is due to the high density of NPs, which induces a high surface roughness. By lowering the density, the surface is smoothened, making the thin films more suitable for spectroscopic ellipsometry measurements.
3. Computer modeling
3. 1 FDTD calculations
In order to validate the optical characterizations and to gain knowledge on the properties of the NPs at the nanometer scale, finite difference time domain (FDTD) calculations are completed. The optical indices of silver were taken from Johnson and Christy11. The optical indices of the host matrix are determined by spectroscopic ellipsometry and added to the software in order to correctly model our thin film layers. The refractive index of water is set to 1.33 over the visible range.
The sizes and correct shape of the prisms are taken from TEM images acquired from the colloidal solutions, e.g. Fig. 1 (b). It is noticed that the triangular corners of the synthesized nanoprisms are not sharp, but rather rounded. Therefore, the modeled nanoprisms have rounded corners. The sharp corners are replaced by quarter cylinders of variable radius r, see insert in Fig. 2 (a). The resulting effect is studied as a slight change in the shape of the NPs induces measurable changes in the optical properties12. By rounding the corners of the nanoprisms, the size is increased. This results in a redshift of the LSPR. But, by rounding the corners the shape is also modified and the nanoprisms
shapes become closer to nanodisks. In order to determine which effect dominates, FDTD simulations are performed.
The absorption cross section abs and scattering cross section scat are calculated for single
nanoprisms of 36 nm edge size with different corners in water and in PVP to predict and validate the measured optical properties of the nanoprisms as synthesized in the colloidal solution and deposited in the polymer host matrix. The nanoprism is illuminated with a total field scattered field (TFSF) source for s- and p-polarizations normally incident on the face flat surface of the nanoprism. The simulation region is enclosed in a 32 layers perfectly-matched-layer boundary conditions volume. An override simulation mesh size of dx=dy=0.8 nm and dz=1nm is chosen to increase the precision for the curved surfaces. The simulations reached the auto shut off level before reaching 75 fs simulation time.
The total power absorbed or scattered by the NP is calculated by integrating the Poynting vector of the absorbed or scattered field over a closed surface surrounding the particle. The optical extinction is the addition of the optical absorption and scattering. To remove the size dependency of these values, abs and scat are divided by the geometrical area, giving us the absorption efficiency Qabs and
scattering efficiency Qscat. Therefore, the extinction efficiency Qext equals to Qext=Qabs+Qscat.
Fig. 2 (a) compares Qext for nanoprisms in water with a sharp corner, r=0 nm, and two differently
rounded corners, r=2 nm and r=4 nm, and shows that the corner rounding results in a blueshift of the LSPR consistent with by Ref 6.
The electric field enhancements are visualized on Fig. 2 (b). For a nanoprisms with a sharp corner the electric field is enhanced locally on the tip. Rounded corners induce an electric field enhancement on a larger area.
300 400 500 600 700 800 0 5 10 15 20 25 30 Q e x t Wavelength (nm) r=0 nm r=2 nm r=4 nm 617 nm 590 nm 578 nm r E/E0 E/E0 r=0 nm r=4nm (a) (b)
Fig 2. (a) Extinction efficiency of a nanoprism in water with different corner radius r, (b) maximum electric
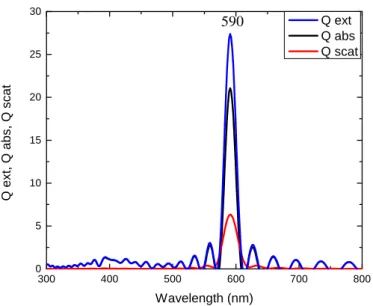
field enhancement for r=0 nm and r=4 nm. Radiation is normally incident along z, polarized along x. (c) Qext,
Qabs and Qscat for r=2 nm.
The optical extinction peak position is an important information about our synthetized nanoprisms. Nevertheless, we want to maximize the absorption of our layers by introducing these particles. By analyzing the contribution of the Qabs, it can be stated that our nanoprisms will indeed mainly absorb
the visible light.
Taken together, the rounded corners of the nanoprisms lead to a blueshift of the optical properties of the particles and the nanoprisms are suitable to be used to absorb the visible light.
4. Optical measurements
4.1 Spectrophotometer measurements
The absorption of the NPs after synthesis is analyzed by spectrophotometer measurement of the colloidal solutions, see Fig. 1 (a). The different absorption peaks on the spectra give us important information on the synthesized NPs. The peak with the highest intensity is the in-plane dipolar resonance of the NPs. The wavelength of the absorption indicates the size of the particle. The broadening of the peak is linked to the size and shape homogeneity of the particles. The intensity of the absorption peak is related to the density of the NPs in the solution. By increasing the density of the NPs, the absorption intensity will increase. When a certain threshold density is reached, the NPs
300 400 500 600 700 800 0 5 10 15 20 25 30 Q e x t, Q a b s , Q s c a t Wavelength (nm) Q ext Q abs Q scat (c) 590
The dipolar absorption peak of the seeds is situated at 393 nm. The wavelength of the dipolar resonance peak of the nanoprisms varies from 570 to 650 nm. Through FDTD calculations and the analysis of microscopy images of the solutions, origin of the two peaks at 330 nm and 450 nm has been determined. The low intensity peaks at 450 and 330 nm corresponds respectively to the in-plane and out-of-in-plane quadrupolar resonance peak of the nanoprisms. Indeed, the polarization change obtained by FDTD for nanoprisms of this particular size displays the quadrupolar arrangement. The peak at 395 nm corresponds to the dipolar absorption peak of the residual spherical seed remaining in the solutions. We noticed that it is possible to remove the residual seeds by centrifugation of the solution.
4.2 Spectroscopic ellipsometry measurements
By embedding the synthesized NPs in a PVP host matrix, the resulting thin film layer will absorb the incoming light at the resonance wavelength of the NPs. The host matrix plus NP system equals to an effective medium that accounts for the properties of the polymer matrix and the metallic NPs. The complex refractive index of this system can be obtained by spectroscopic ellipsometry measurements. It should be noted that the complex refractive index is the complex addition of the refractive index n and the extinction coefficient k: . Furthermore, the complex refractive index is closely linked to the complex dielectric function: .
Once the optical indices of the material are known, the reflectance (R) is calculated by transfer matrix method (TMM) and compared to spectrophotometric measurements of the R of the layers. To determine the correct indices, the roughness of the thin film layer should be minimized. If this cannot be achieved, it is possible to incorporate a the surface roughness correction using a Bruggeman effective medium approximation (EMA) to add a surface roughness correction using a two-layer model, where the bottom layer is a blend film and the top layer is an EMA layer composed of air and bottom layer material.
Spectroscopic ellipsometry is an efficient tool to determine the optical indices of bulk materials and thin film layers. It is based on the polarization change of the light reflected by the sample. The ratio between the Fresnel coefficients in p-polarization (rp) and in s-polarization (rs) allows extracting the amplitude and phase variations of the electric fields upon light reflection. It can be expressed as a function of the two ellipsometric angles (Ψ and Δ), as follows:
rp
rp =tanYe
iD
(3)
where tan(Ψ) = |rp|/|rs| represents the relative amplitude attenuation and Δ = arg(rp) − arg(rs) is the
phase shift between the p- and s-polarizations. This method does not allow a direct determination of the optical indices of the materials. The first step consists of measuring the Ψ and Δ spectra of the sample. In a second step, a dispersion model composed of mathematical laws is determined in order
to find the adequate dispersion model fitting the Ψ and Δ spectra. This process relies on the use of minimization algorithms to adjust the dispersion model parameters.
In a first step the polymer host matrix is analyzed. As the polymer is transparent, a Cauchy mathematical law is used to fit the data. The non-absorbing property of the material is verified, as the extinction coefficient k over the whole visible spectrum is zero. The Cauchy law has the following expression:
n(l)=n¥+ B
l2 (4)
where n¥is the refractive index at high wavelength and is constant, and B is a variable.
The absorption of the layer is only due to the metallic NPs. Therefore a Lorentz oscillator model is mathematically added to the Cauchy law. The Lorentz model influences the real (
e
1) and imaginary part (e
2) of the dielectric functione
:e1(E)=e¥+ fE02 (E02-E2 ) (E02-E2 )2+ G2E2, e2(E)= fE02GE (E02-E2 )2+ G2E2 (5)
where E0 is the energy at which the oscillator is centered,
G
is the width of the oscillator, f is thestrength of the oscillator and
e
¥is the dielectric constant at high energies and is equivalent to an offset. The parameters E0 andG
are related to the absorption wavelength and width of the plasmonicresonance of the NPs embedded in the host matrix. Therefore, these values are fixed. The constants
e
¥ and f are the variables to adjust to measured data and are related to the density of NP in theanalyzed layer.
Once the properties of the host matrix are understood, samples with nanoprisms are studied. Their introduction in the transparent and non-absorbing host matrix results in an absorption in a specific wavelength range.
The optical model therefore requires, in addition to the non-absorbing Cauchy Law, one Lorentz oscillator to account for the absorption of the nanoprisms. The Lorentz oscillator only models the dipolar absorption peak. The intensities of the remaining peaks, i.e. the quadrupolar peak and the peak of the residual seeds, are too low to be taken into account by the optical model.
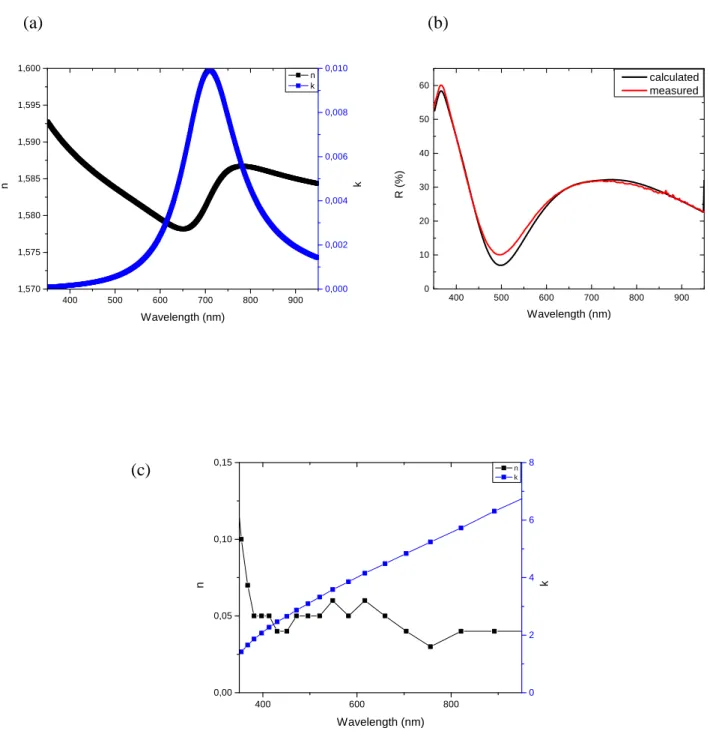
Fig. 3 (a) Measured n and k of a heterogeneous PVP layer containing in average 25 nm edge size nanoprisms
and (b) comparison of measured and by TMM calculated R, (c) n and k for bulk silver from Johnson and Christy11 for comparison.
400 500 600 700 800 900 0 10 20 30 40 50 60 R ( % ) Wavelength (nm) calculated measured 400 500 600 700 800 900 1,570 1,575 1,580 1,585 1,590 1,595 1,600 n k Wavelength (nm) n 0,000 0,002 0,004 0,006 0,008 0,010 k (a) (b) (c) 400 600 800 0,00 0,05 0,10 0,15 n k Wavelength (nm) n 0 2 4 6 8 k
Let us recall that PVP is a non-absorbing polymer. Therefore the absorbing property of the thin film layer has to be described by the Lorentzian law. The evolution of the extinction coefficient of the heterogeneous layer is seen on Fig. 3 (a). For comparison, Fig. 3 (c) displays the indices of bulk silver. The reflectance of the thin film layer is compared to the reflectance calculated using a TMM code, Fig. 3 (b). The calculated R shows a good fit to the measured R. Especially at the dipolar resonance wavelengths of the nanoprisms, around 700 nm, the measured and calculated R overlap. It is worth noting, that the described model does not take the diffusion into account. As shown in Fig. 1 (c), Qscat is low, but non-negligeable, for our nanoprisms.
Spherical metallic NPs alone or in polymer layers have been studied by spectroscopic ellipsometry. Gauss and Lorentz laws have been identified to best fit the plasmonic behavior of metallic NPs13-15. Our results showed that these laws also fit for non-spherical NPs such as nanoprisms randomly embedded in a polymer host matrix. The main advantage of nanoprisms over nanosphere is complete absorption coverage of the visible wavelength band by simple size increase.
In summary, the spectroscopic ellipsometry measurements are fitted by a mathematical addition of a Cauchy law, accounting for the properties of the non-absorbing polymer, and a Lorentz law, accounting for the absorbing property of the silver nanoprisms. This Lorentz law is centered at the absorption energy of the dipolar LSPR. The exact relationship between the density of NPs in the thin film layer and the value of these variables
e
¥ and f has still to be studied to gain a better understanding of the optical model.5. Conclusion
We have successfully synthesized silver nanoprisms of different sizes and embedded them into a polymer host matrix. Spectrophotometer measurements and spectroscopic ellipsometry measurements have been performed on the thin film layers to characterize the optical properties of the heterogeneous thin film layer. The measurements have been validated by FDTD calculations. The spectroscopic ellipsometry measurements are fitted by a Cauchy law and a unique Lorentz oscillator accounting respectively for the optical properties of the non-absorbing and transparent polymer, and the absorption property of the metallic NPs. In future work, this model will be tested on different shapes of NPs and a better understanding of the variables will be gained.
Acknowledgments
The research was supported by a DGA-MRIS scholarship to Miriam Carlberg and Florent Pourcin.
References
[1] W. L. Barnes, A. Dereux, and T. W. Ebbesen, "Surface plasmon subwavelength optics," Nature 424, 824-830 (2003).
[2] J. A. Schuller et al., "Plasmonics for extreme light concentration and manipulation," Nature materials 9, 193-204 (2010).
[3] S. Cushing, and N. Wu, "Progress and perspectives of plasmon-enhanced solar energy conversion," J. Phys. Chem. Lett. 7, 666-675 (2016).
[4] R. Tong, and D. S. Kohane, "New strategies in cancer nanomedicine," Annual review of pharmacology and toxicology 56, 41-57 (2016).
[5] Nikolai Grigor'evich Khlebtsov, "Optics and biophotonics of nanoparticles with a plasmon resonance."
Quantum electronics 38.6, 504 (2008).
[6] G. M. Akselrod et al., "Large Area Metasurface Perfect Absorbers from Visible to NearInfrared," Advanced Materials 27(48), 8028-8034 (2015).
[7] E. Hao, and G. C. Schatz, "Electromagnetic fields around silver nanoparticles and dimers," The Journal of chemical physics 120(1), 357-366 (2004).
[8] X. Lu et al., “Chemical synthesis of novel plasmonic nanoparticles,” Annual review of physical chemistry 60, 167-192 (2009).
[9] D. Aherne et al., "Optical properties and growth aspects of silver nanoprisms produced by a highly reproducible and rapid synthesis at room temperature," Advanced Functional Materials 18(14), 2005-2016 (2008).
[10] S. Malynych, I. Luzinov, and G. Chumanov, "Poly (vinyl pyridine) as a universal surface modifier for immobilization of nanoparticles," The Journal of Physical Chemistry B 106(6), 1280-1285 (2002).
[11] P. B. Johnson and R. W. Christy, "Optical Constants of the Noble Metals, " Phys. Rev. B 6, 4370-4379 (1972).
[12] N. Grillet et al., “Plasmon coupling in silver nanocube dimers: resonance splitting induced by edge rounding,” Acs Nano 5(12), 9450-9462 (2011).
[13] M. Lončarić, J. Sancho-Parramon, and H. Zorc. "Optical properties of gold island films—a spectroscopic ellipsometry study." Thin Solid Films 519.9, 2946-2950 (2011).
[14] M. N. M. N Perera, et al. "Effective optical constants of anisotropic silver nanoparticle films with plasmonic properties." Optics Letters 41.23, 5495-5498 (2016).
[15] A. Baron, et al. "Bulk optical metamaterials assembled by microfluidic evaporation." Optical Materials
Express 3.11, 1792-1797 (2013).
Caption List
Fig. 1 (a) Absorption spectra of colloidal solutions of the spherical seeds and differently sized nanoprisms resulting from adding various seed quantities in the second step of the synthesis, (b) TEM image of the produced nanoprisms, (c) absorption spectra of nanoprisms in PVP on glass. Fig. 2 (a) Extinction efficiency of a nanoprism in water with different corner radius r, (b) maximum electric field enhancement for r=0 nm and r=4 nm. Radiation is normally incident along z, polarized along x. (c) Qext, Qabs and Qscat for r=2 nm.
Fig. 3 (a) Measured n and k of a heterogeneous PVP layer containing in average 25 nm edge size nanoprisms and (b) comparison of measured and by TMM calculated R, (c) n and k for bulk silver from Johnson and Christy11 for comparison.