HAL Id: tel-00011582
https://tel.archives-ouvertes.fr/tel-00011582
Submitted on 10 Feb 2006HAL is a multi-disciplinary open access archive for the deposit and dissemination of sci-entific research documents, whether they are pub-lished or not. The documents may come from teaching and research institutions in France or abroad, or from public or private research centers.
L’archive ouverte pluridisciplinaire HAL, est destinée au dépôt et à la diffusion de documents scientifiques de niveau recherche, publiés ou non, émanant des établissements d’enseignement et de recherche français ou étrangers, des laboratoires publics ou privés.
Transferts de magma au volcan du Piton de la Fournaise
déterminés par la modélisation 3D de données
d’interférométrie radar entre 1998 et 2000
Yo Fukushima
To cite this version:
Yo Fukushima. Transferts de magma au volcan du Piton de la Fournaise déterminés par la modélisation 3D de données d’interférométrie radar entre 1998 et 2000. Geophysics [physics.geo-ph]. Université Blaise Pascal - Clermont-Ferrand II, 2005. English. �NNT : 2005CLF21633�. �tel-00011582�
UNIVERSITE BLAISE PASCAL
(U. F. R. de Recherche Scientifique et Technique)
ECOLE DOCTORALE DES SCIENCES FONDAMENTALES
N
◦475
THESE
Pr´esent´ee pour obtenir le grade de
DOCTEUR D’UNIVERSITE
Sp´ecialit´e : Volcanologie Par
FUKUSHIMA Yo
Diplˆom´e de MasterTransferts de magma au volcan du Piton de la Fournaise
d´etermin´es par la mod´elisation 3D de donn´ees d’interf´erom´etrie
radar entre 1998 et 2000
Soutenue publiquement le 16 d´ecembre 2005, devant la commission d’examen compos´ee de :
President : MERLE Olivier Universit´e Blaise Pascal Clermont II
Rapporteur : CORNET Franc¸ois-Henri Institut de Physique du Globe de Paris
Rapporteur : MASSONNET Didier Centre National d’Etudes Spatiales
Examinateur : JAUPART Claude Universit´e de Paris VII
Invit´e : DURAND Philippe Centre National d’Etudes Spatiales
Directeur de th`ese : L ´ENAT Jean-Franc¸ois Universit´e Blaise Pascal Clermont II
Abstract
After five and a half years of quiescence, Piton de la Fournaise volcano (R´eunion Island, Indian Ocean) entered into a new active period in March 1998. Synthetic aperture radar interferometry (InSAR) data show complex displacements associated with the first five eruptions that occurred between 1998 and 2000. A method was developed to find realistic geometries and overpressures of dike intrusions from the InSAR data. This method is based on a combination of a fully 3D boundary element method and a Monte Carlo inversion. The noise characteristics of the data are taken into account in the inversions. Synthetic tests show that a model is successfully retrieved within predicted narrow confidence intervals. Neglecting topography was shown to result in poor modelling at depth and in overestimation of overpressure or opening. Application of the method to each eruption requires specific parameterizations of the model(s); in some cases, a curved dike surface must be introduced, and in other cases, simultaneous inversions for two dikes are required. Most of the estimated dikes dip seaward with a typical angle of 65 degrees. The dike associated with the first eruption of the cycle (March 1998) is found to originate from sea level (2600 m below the summit), whereas those dikes associated with subsequent eruptions are estimated to be shallower than about 1000 m below the ground. Laterally elongated dikes, preeruption deformations and seismic swarms can be explained by a level of neutral buoyancy less than 1000 m beneath the ground. This is consistent with the presence of magma reservoirs at this level. For the studied period, the intruded volume amounts to 8% of the lava flow volume. The spatial periodicity of dike intrusions from the northern to the southern flank is consistent with stress transfer models. Finally, Coulomb stress analysis shows that the five eruptions modelled mostly encourage slip on potential subhorizontal planes located 1000–1500 m above sea level.
R´esum´e
Apr`es cinq ans et demi de sommeil, le volcan du Piton de la Fournaise (ˆıle de la R´eunion, Oc´ean Indien) est entr´e dans un nouveau cycle d’activit´e en mars 1998. Des donn´ees d’interf´erom´etrie radar (InSAR) montrent que des d´eplacements complexes sont associ´es aux cinq premi`eres ´eruptions du cycle survenues entre 1998 et 2000. Une m´ethode a ´et´e d´evelopp´ee pour d´eterminer des g´eom´etries r´ealistes et les surpressions des intrusions de dykes `a partir de donn´ees InSAR. Cette m´ethode est bas´ee sur la combinaison d’une m´ethode d’´el´ements fronti`eres 3D et d’une inversion de type Monte Carlo. Les caract´eristiques du bruit des donn´ees sont prises en compte dans les inversions. Des tests synth´etiques montrent qu’un mod`ele est retrouv´e avec succ`es dans la limite d’intervalles de confiance ´etroits. Il a ´et´e montr´e que n´egliger la topographie induit une erreur de mod´elisation en profondeur et une surestimation des surpressions ou des ouver-tures. L’application de la m´ethode `a chaque ´eruption requiert des param´etrisations sp´ecifiques des mod`eles. Dans certains cas, un dyke incurv´e en surface doit ˆetre introduit, dans d’autres, l’inversion simultan´ee de deux dykes est n´ecessaire. La plupart des dykes d´etermin´es ont un pendage vers la mer de 65 degr´es. Le dyke associ´e `a la premi`ere ´eruption du cycle (mars 1998) s’enracine au niveau de la mer (2600 m sous le sommet), tandis que les dykes suivants sont situ´es `a moins de 1000 m sous la surface du sol. La forme lat´eralement allong´ee des dykes, les d´eformations pr´e-´eruptives et les essaims sismiques peuvent ˆetre expliqu´es par un niveau de flottabilit´e neutre situ´e `a moins de 1000 m sous la surface. Ceci est coh´erent avec la pr´esence de r´eservoirs magmatiques `a ce niveau. Pour la p´eriode ´etudi´ee, le volume inject´e dans le volcans repr´esente 8% du volume des coul´ees de lave. La p´eriodicit´e spatiale des intrusions de dykes, du flanc nord au flanc sud, est coh´erente avec les mod`eles de transfert de contraintes. Finalement, des analyses en terme de contraintes de Coulomb montrent que les cinq ´eruptions mod´elis´ees ont principalement favoris´e le glissement sur des plans potentiels subhorizontaux situ´es entre 1000 et 1500 m au dessus du niveau de la mer.
Acknowledgements
First of all, I wish to thank Val´erie Cayol. Without her advice, support, patience and encourage-ment, it would not have been possible for me to continue working on this challenging subject for three years. Inspite of extra works she had to do for me, she has showed no sign of complaint and has been always helpful; her such attitude has been my spiritual support. (I only hope she has not worn out!)
I am deeply grateful to Franc¸ois-Henri Cornet and Didier Massonnet for having accepted to be the rapporteurs, and to Philippe Durand, Claude Jaupart and Olivier Merle for being the members of jury.
Special thanks go to Jean-Franc¸ois L´enat who has always cared about my work. He has kindly given me an opportunity to visit R´eunion Island and Piton de la Fournaise volcano. This saved me from misunderstanding that volcanoes are something I see on the computer screen. I benefited also from his expertise on the Piton de la Fournaise volcano.
This study benefited from a collaborative project between the French Centre National d’Etudes Spatiales (CNES) and the Canadian Space Agency (CSA) through the Applications Develop-ment and Research Opportunity program sponsored by CSA. I highly appreciate those who have devoted time and effort to the project, especially Didier Massonnet for launching the project, and Philippe Durand for computing the interferometric data which this thesis is based on.
I thank the staffs of the Observatoire Volcanologique du Piton de la Fournaise for having warmly greeted me during my visit to R´eunion Island, and for providing me seismicity data. Es-pecially, Thomas Staudacher further gave me useful information on what he and his colleagues observed in the field during the eruptions that I worked on. I have enjoyed fruitful discussions with Val´erie Ferrazzini and Keiiti Aki. Regretfully, Keiiti Aki has passed away in May 2005, but the memory of the dinner and talks we had is unforgettable.
I have benefited a lot from the members of the laboratory. I first acknowledge the countless helps of Jean-Luc Froger (his ground meshing program was especially useful), as well as many constructive discussions with him. Fabien Ranvier has kindly helped me get used to the tech-niques of the boundary element method when I knew nothing about it. Philippe Labazuy has supported me and let me use his Linux machine, which was very important. I also thank Thierry Souriot, who helped me in phase unwrapping at an early stage of the study. Benjamin van Wyk de Vries has supported and encouraged me throughout the period as the head of the volcanology group. I have also learnt many things from discussions with petrologists and geochemists in the laboratory: Pierre Boivin, Didier Laporte and Olgeir Sigmarsson. I have enjoyed talking to two Japanese Ken Koga and Tatsuhiko Kawamoto, not only because I could speak in my mother tongue but also because of their insights. Philippe Cacault and Thierry Souriot gave me helps on the computer enviroment.
I am grateful to Jean Battaglia for relocated seismicity data. There were lots of things to learn from discussion with Patrick Bach`elery. Nicolas Villeneuve and Aline Peltier have been
given me his note on estimation of the radius of magma conduits. Malcolm Sambridge has provided me his inversion code which I used at an early stage of the study. I should not forget the continuous supports of Takeshi Nishimura (it was him who suggested me of working with Val´erie), Motoo Ukawa, Hideki Ueda and Haruo Sato.
For the paper presented in Chapter 2, I am grateful to the contributions of the co-authors Val´erie Cayol and Philippe Durand. Franc¸ois-Henri Cornet, Ariel Provost, Jean-Franc¸ois L´enat reviewed the manuscript before submission, and Benjamin van Wyk de Vries reviewed and corrected English before and after submission. Long and thoughtful comments of the three reviewers, two anonymous and Sigurj´on J´onsson and the Associate Editor L. Mastin contributed to improve the quality of the paper.
I have enjoyed the company of my officemates: Fabien Ranvier, Jean-Franc¸ois Oehler, Pierre Tinard and Silke Lohmar. I have also enjoyed being with other Ph.D. students and postdocs, especially S´ev´erine Jannot, S´ev´erine Moune, Perrine Lebti-Paquereau and Vinciane Debaille, with whom I share the memory of these three years.
The thesis work was financially supported by a grant from the French government. I thank Madame Compte-Rome, the responsible of the grant at CROUS, for taking care of small things around me and my family.
My mother and mother-in-law have come all the way to France for taking care of house chores, when I was at a loss how to juggle both work and household, so that I could concentrate on writing the thesis. I thank my father for his discreet but thoughtful care on my life and professional career. Last but not least, I deeply thank my dear wife Aiko for her comprehension, support and encouragement (yes, she also helped me typing in the reference list), and my dear son Shotaro for giving me the energy to work on the thesis.
Contents
Abstract iii
R´esum´e v
Acknowledgements vii
1 Introduction 1
1.1 Piton de la Fournaise Volcano . . . 1
1.1.1 Geological settings . . . 1
1.1.2 Eruption monitoring . . . 4
1.1.3 Magmatic system . . . 4
1.2 Displacement Measurements by SAR Interferometry . . . 7
1.2.1 Background . . . 7
1.2.2 Production of interferograms . . . 8
1.2.3 Unwrapping of interferograms . . . 8
1.2.4 Applications . . . 9
1.3 Ground Deformation Data Modelling on Volcanoes . . . 10
1.3.1 What is modelling? . . . 10
1.3.2 Analytical models . . . 10
1.3.3 Numerical models . . . 11
1.3.4 Data inversion . . . 12
1.4 Modelling of Dike Emplacement . . . 13
1.4.1 Force of Dike Opening . . . 13
1.4.2 Direction of Dikes . . . 14
1.5 Aim of the Study . . . 16
2 Method for Realistic Dike Model Estimation - SAR Interferometry, Mixed BEM and Monte Carlo Inversion 17 2.1 Model Assumptions . . . 17
2.2 Geometry of Pressure Sources . . . 19
2.2.1 Quadrangle-like fracture with superficial segments . . . 19
2.2.2 Rectangle not reaching the ground . . . 22
2.2.3 Oblate ellipsoid . . . 22
2.2.4 Half oblate ellipsoid . . . 22
2.3 JGR Paper . . . 24
2.3.1 Introduction . . . 24
2.3.4 Application to the February 2000 eruption at Piton de la Fournaise . . . 24
2.3.5 Discussion . . . 24
2.3.6 Conclusions . . . 24
2.4 Supplements . . . 41
2.4.1 Estimation of noise characteristics . . . 41
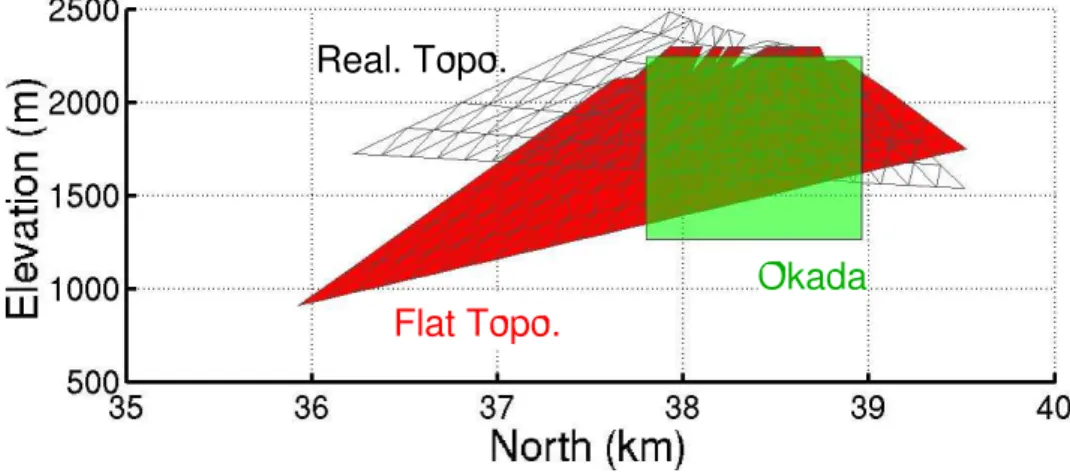
2.4.2 Topography effect . . . 42
2.4.3 Recursive unwrapping algorithm . . . 43
3 Dike Models for the Eruptions 1998–2000 45 3.1 Data . . . 45
3.1.1 Processing and selection of data . . . 45
3.1.2 Removing altitude-correlated fringes . . . 52
3.2 Analysis Strategy . . . 56
3.2.1 Treating several pressure sources . . . 56
3.2.2 Percentage of explained data . . . 56
3.3 March 1998 Eruption . . . 58
3.3.1 Overview . . . 58
3.3.2 Sources of interferometric signals in data . . . 58
3.3.3 Analysis and results . . . 60
3.4 July 1999 Eruption . . . 76
3.4.1 Overview . . . 76
3.4.2 Sources of interferometric signals in data . . . 76
3.4.3 Analysis and results . . . 76
3.5 September 1999 Eruption . . . 81
3.5.1 Overview . . . 81
3.5.2 Sources of interferometric signals in data . . . 81
3.5.3 Analysis and results . . . 82
3.6 February 2000 Eruption . . . 86
3.7 June 2000 Eruption . . . 87
3.7.1 Overview . . . 87
3.7.2 Sources of interferometric signals in data . . . 87
3.7.3 Analysis and results . . . 89
3.8 Summary . . . 96
4 Storage, Transfer, Emplacement of Magma and Volcano Growth 99 4.1 Magma Storage System . . . 99
4.1.1 Depth of the source magma reservoir . . . 99
4.1.2 Shallow magma storage at a level of neutral buoyancy . . . 102
4.1.3 Thermal viability of dikes and sills . . . 102
4.1.4 Model of magma storage system . . . 104
4.2 Magma Tranfer and Emplacement . . . 106
4.2.1 Conduit geometry at depth . . . 106
4.2.2 Size of the magma conduit . . . 108
4.2.3 Lateral propagation of dikes . . . 112
4.2.4 Pit-crater collapses . . . 113
4.3 Evolution of the Volcano . . . 117
4.3.1 Contribution of dike intrusions to volcano growth . . . 117
4.3.2 Predicting Eruption Locations . . . 117
4.3.3 Triggering of Landslides by Dike Intrusions . . . 124
5 Conclusions and Perspectives 129
List of Tables
3.1 Interferograms used in this study . . . 46
3.2 Inversion settings and results . . . 62
4.1 Minimum possible depth of spherical magma source . . . 101
4.2 Minimum possible depth of sill-type magma source . . . 101
List of Figures
1.1 Location of R´eunion Island . . . 2
1.2 Shaded relief map of R´eunion Island and surrounding bathymetry . . . 2
1.3 Geological setting of Piton de la Fournaise volcano . . . 3
1.4 Lava flows between 1972 and 2000 . . . 5
1.5 Magma reservoir model of L´enat and Bach`elery [1990] . . . . 6
1.6 Opening of a two-dimensional dike . . . 15
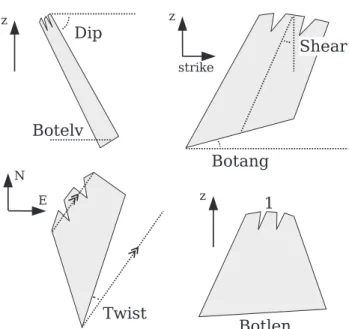
2.1 Geometries of the pressure source models . . . 19
2.2 Parameters of the bottom side geometry of the quadrangular-type source . . . . 20
2.3 Virtual top side used in the parameterization of the quadrangular-type source . . 21
2.4 Parameterization of the segmented part of the quadrangular-type source . . . . 21
2.5 Curvatures introduced in the quadrangular-type source . . . 22
2.6 Parameters of the rectangle source . . . 23
2.7 Parameters of the oblate ellipsoidal source . . . 23
2.8 Parameters of the half oblate ellipsoidal source . . . 23
2.9 Example of InSAR noise caused by atmospheric perturbation . . . 41
2.10 Example of a calculation of the autocorrelation function . . . 42
2.11 Models obtained from realistic topography and half space assumptions . . . 43
2.12 Schematic example of unsuccessful unwrapping . . . 44
2.13 Products obtained during an iteration of the recursive unwrapping algorithm . . 44
3.1 Interferogram of the March 1998 eruption . . . 47
3.2 Interferogram of the July 1999 eruption . . . 48
3.3 Interferogram of the September 1999 eruption . . . 48
3.4 Interferogram of the February 2000 eruption . . . 49
3.5 Interferogram of the June 2000 eruption . . . 50
3.6 Interferogram covering the March 1998, July and September 1999 eruptions . . 51
3.7 Example showing the algorithm of removing altitude-correlated fringes . . . . 53
3.8 Area used for removing altitude-correlated fringes . . . 54
3.9 Estimated altitude–unwrapped phase relationship . . . 55
3.10 Synthetic interferogram created assuming the altitude–unwrapped phase rela-tionship . . . 55
3.11 Interferogram corrected for the altitude-correlatd noise . . . 55
3.12 Analysis strategy for the cases where several pressure sources exist . . . 57
3.13 Location of the eruptive fissures for the eruptions of March 1998–June 2000 . . 59
3.14 March 1998: Interpretation of interferometric signals . . . 60
3.15 March 1998 (Model A): Geometry of a Y-shaped dike model and corresponding modelled interferogram . . . 65
fissures and corresponding modelled interferogram . . . 67
3.17 March 1998, Model B: Geometry of a dike model reaching the southern eruptive fissure . . . 68
3.18 March 1998, Model B: Geometry of the dike model of reduced parameters, reaching the southern eruptive fissure and corresponding modelled interferogram 69 3.19 March 1998, Model C: Geometry of a rectangular pressure source and corre-sponding modelled interferogram . . . 71
3.20 March 1998, Model C: Geometry of an oblate ellipsoidal pressure source and corresponding modelled interferogram . . . 72
3.21 March 1998, Model C: Geometries of the three pressure sources and corre-sponding modelled interferogram . . . 73
3.22 March 1998, Model D: Geometry of a deep dike model . . . 74
3.23 March 1998, Model D: Modelled interferogram assuming the deep dike . . . . 75
3.24 July 1999: Interpretation of interferometric signals . . . 77
3.25 July 1999, Model A: Geometry of a single dike model and corresponding mod-elled interferogram . . . 78
3.26 July 1999, Model B: Geometry of two dike models simultaneously inverted for and corresponding modelled interferogram . . . 80
3.27 September 1999: Interpretation of interferometric signals . . . 81
3.28 September 1999: Geometry of a single dike model and corresponding modelled interferogram . . . 83
3.29 September 1999: Geometry of the estimated dike connected to a narrower path and corresponding modelled interferogram . . . 84
3.30 September 1999: Modelled interferogram corresponding to a half oblate ellip-soidal source . . . 85
3.31 February 2000: Interpretation of interferometric signals . . . 86
3.32 June 2000: Interpretation of interferometric signals . . . 88
3.33 June 2000: Interferogram showing the displacements until one hour after the eruption onset . . . 88
3.34 June 2000, Model A: Geometry of a single dike model . . . 90
3.35 June 2000, Model A: Modelled interferogram . . . 91
3.36 June 2000, Model B: Geometry of a dike model having along-dip curvature . . 92
3.37 June 2000, Model B: Modelled interferogram corresponding to the dike model having curvature along dip . . . 93
3.38 June 2000, Model C: Geometry of two dike models simultaneously inverted for 94 3.39 June 2000, Model C: Modelled interferogram corresponding to the two dikes model . . . 95
3.40 Preferred dike models . . . 97
4.1 Modelled interferograms corresponding to a spherical deflation source . . . 100
4.2 Hypocenters of the preeruption microearthquakes . . . 101
4.3 Duration of preeruption seismic swarms . . . 103
4.4 Time required for a dike or sill to solidify . . . 104
4.5 Inferred magma storage system . . . 105
4.6 Explanation of the lack of signals of magma propagation . . . 106
4.9 Model for a magma flow through a cylindrical conduit . . . 110
4.10 Overpressure in the reservoir and the radius of the conduit . . . 111
4.11 Transition of overpressure profile . . . 113
4.12 Gravity-induced downslope magma propagation . . . 114
4.13 Model of magma transfer and emplacement . . . 115
4.14 Thickness profiles of a solidified dike . . . 115
4.15 Cumulative displacements and slope changes due to the preferred dike models . 118 4.16 Normal stress changes on potential dike surfaces . . . 121
4.16 Continued. . . 122
4.17 Cumulative normal stress changes on potential dike surfaces . . . 123
4.18 Coulomb failure stress changes on potential fault planes for µ0 = 0 . . . 126
4.19 Coulomb failure stress changes on potential fault planes for µ0 = 0.6 . . . 127
Chapter 1
Introduction
Volcanic eruptions mark the final stage of magma transfer from the mantle. In a shallow part of the crust, magma movements cause detectable changes of various physical parameters that are detectable on the ground. Geodetic measurements provide data that can be quantitatively interpreted in order to understand magma transfer mechanisms; this quantitative interpretation is carried out through modelling.
The recently developed interferometric synthetic aperture radar (InSAR) technique allows to map ground displacement field in unprecedented precision and resolution. Complex displace-ments revealed by InSAR call for numerical modelling analyses that can take into account more realistic situations than simple analytical models.
The field of work of this thesis is Piton de la Fournaise volcano, a very active basaltic shield volcano that occupies the southeastern part of R´eunion Island, Indian Ocean. From detailed analyses of the InSAR data associated with five consecutive eruptions that occurred between 1998 and 2000, this study attempts to develop a model of the magma transfer system of the volcano as well as to give inference on its volcano-tectonic structures.
In this chapter, introductions are given to Piton de la Fournaise, displacement measurements using InSAR, geodetic data modelling on volcanoes, and modelling of dike emplacements. Chapter 2 describes the development of the modelling method based on a combination of a boundary element and a Monte Carlo inversion methods. Application to the five consecutive eruptions at Piton de la Fournaise is presented in Chapter 3. Overpressure and geometry of the coeruptive magma intrusions are estimated by inverting InSAR data. Chapter 4 investigates the magma storage, transfer and emplacement mechanisms, as well as the volcano-tectonics of the volcano, based on the results obtained in Chapter 3 and complementary analyses. Finally, conclusions are given on the new findings revealed in this study.
1.1
Piton de la Fournaise Volcano
1.1.1
Geological settings
R´eunion Island is a French oversea d´epartement located about 700 km east of Madagaskar in the Indian Ocean (Figure 1.1). This island has a dimension of 70×50 km elongated in NW-SE (Figure 1.2), with a height of 7 km from the sea floor [L´enat et al., 1989b] and a volume of
75,000 km3[de Voogd et al., 1999]. The northwestern part of the island is occupied by an extinct
0 30 60 90 30 15 0 15 30 Reunion Island
Figure 1.1: Shaded relief map showing the location of R´eunion Island. Colors correspond to altitudes. 21.4 21.2 21.0 20.8 La tit ud e 55.2 55.4 55.6 55.8 56.0 Longitude Piton de la Fournaise Piton des Neiges
Figure 1.2: Shaded relief map of R´eunion Is-land and surrounding bathymetry. Colors cor-respond to altitudes, except for white area in submarine part where data are missing. [Cour-tesy of Jean-Franc¸ois Oehler for the DEM data.]
three cirques that open toward the ocean. On the southeastern part of the island lies our field of work, Piton de la Fournaise (2631 m; Figure 1.2).
The origin of R´eunion Island volcanism is a hot spot. This hot spot may be the one that created Deccan Trapp (India) 65 Ma ago [Courtillot et al., 1986], or a recent one (less than 10 Ma) of which activity is only restricted to this island [Burke, 1996; Sheth, 2005].
Piton de la Fournaise started its activity more than 530,000 years ago [Gillot and Nativel, 1989]. It has a caldera-like depression that opens to the ocean called Enclos-Fouqu´e caldera (Figure 1.3). This depression, at least its western part, formed 5000 years ago [Bach`elery, 1981]. On the caldera floor, a central cone has two summit craters called Bory and Dolomieu.
The volcano also has arcuate rift zones, oriented N10◦ and N170◦ with respect to the summit,
where surface fractures and eruptive vents are preferentially located.
Bory crater already existed and was close to its present state in 1766 [L´enat and Bach`elery, 1990], whereas the Dolomieu crater, on the contrary, has been experiencing numerous collapses and refillings [Bach`elery, 1981]; the most recent pit crater formation in Dolomieu took place in December 2002 and partial refillings of Dolomieu occurred in May to June and December 2003. The summit craters have concentric fissures that are normally noneruptive, and whose origin is probably related to crater collapses [Bach`elery, 1981].
Piton de la Fournaise is often compared with Hawaiian volcanoes, which are also basaltic shield volcanoes of hot-spot origin. The characteristics of the rift zones, however, are signif-icantly different. Hawaiian rift zones are associated with numerous vertical dike intrusions, resulting in distinct ridges that extend for tens of kilometers. In contrast, those of Piton de la Fournaise open seaward and there is no ridge structure. Since 1644, about five percent of the eruptions occurred outside Enclos-Fouqu´e caldera [Stieltjes and Moutou, 1989], with the most recent ones in 1977 and 1998 to the north and in 1986 to the south (Figure 1.4).
The submarine part of R´eunion Island provides important information on the volcano-tectonic evolution of Piton de la Fournaise. The age and volume of landslide materials on the
30 35 40 45 N or th ( km ) 175 180 185 190 East (km) In di an O ce an Dolomieu Crater Bory Crater G ra nd B ru le G ra nd es P en te s Enclo
s Fouque Caldera
10 00 2000 North -East R ift Zone So uth-E ast Rift Zone
Figure 1.3: Map showing the geological setting of Piton de la Fournaise volcano. Colors corre-spond to altitudes. Contours are drawn every 100 m. The summit craters, Bory and Dolomieu, are outlined. The coordinates are given in Gauss-Laborde kilometric coordinates.
submarine eastern flank of the volcano clearly indicate recurrent seaward landslides [Labazuy, 1996]. It is still under debate whether the most recent one, associated with the formation of Enclos-Fouqu´e caldera, was caused by a single landslide [Labazuy, 1996; L´enat and Bach`elery, 1990; L´enat et al., 2001], or by a coupled mechanism involving a landslide close to the ocean (the Grand-Brˆul´e area, Figure 1.3) and a collapse in the central area [Bach`elery, 1995; Bach`elery
and Mairine, 1990; Chevallier and Bach`elery, 1981; Duffield et al., 1982]. Merle and L´enat
[2003] showed by analogue experiments that the latter scenario is possible when the core of the volcano is hydrothermally altered.
A drilling in the Grand-Brˆul´e area evidenced a large intrusive and cumulate complex [Ranc¸on
et al., 1989] 1000 m beneath the ground. Gravitational and geomagnetic data [L´enat et al., 2000,
2001] strongly support the presence of such a complex. According to L´enat et al. [2001], this complex is related to an ancient volcano (named the Aliz´es), and it may have provided the basal plane for the eastward landslides of Piton de la Fournaise.
1.1.2
Eruption monitoring
Quantitative eruption monitoring started when a volcano observatory l’Observatoire Volcanologique
du Piton de la Fournaise was installed in 1980. As of October 2005, it maintains dense seismic
(short period and broad band), deformation (tiltmetry, extensometry, distansometry and con-tinuous and campaign GPS), radon probe and magnetometric networks (information from the website of the observatory: http://volcano.ipgp.jussieu.fr:8080/reunion/stationreu2.html). Data of these networks have largely contributed to the understanding of the eruption dynamics.
InSAR provides an excellent complement to the geodetic monitoring networks. Although this technology is not useful for short-term eruption forecasts, which require continuous mon-itoring, it instead measures precise displacements in the area uncovered by vegetation with resolution of 20 m. This advantage has enabled us to model the dike emplacements at Piton de la Fournaise in detail [Froger et al., 2004; Fukushima et al., 2005; Sigmundsson et al., 1999]. Since 1995, SAR images on Piton de la Fournaise have been captured by the satellite RADARSAT-1 lauched by the Canadian Space Agency. It is these data that the present study benefits from. In March 2002, the European Space Agency launched a satellite ENVISAT. At the Laboratoire Magmas et Volcans, interferograms are systematically computed and archived for all the eruptions after August 2003.
1.1.3
Magmatic system
In the last two centuries, Piton de la Fournaise experienced more than 200 eruptions; this corre-sponds to one eruption in every ten months on average [Stieltjes and Moutou, 1989]. The mean
lava output rate is about 0.32 m3/s, which is one order less than that at Kilauea and comparable
to that at Etna [Bach`elery, 1999].
Since the installation of the observatory, geodetic data showed no clear preeruptive inflation and posteruptive deflation that show evidence of a common magma reservoir responsable for all or majority of the eruptions. (However, in the last several years, systematic preeruptive inflation of typically several weeks is observed, A. Peltier, personal communication, 2005.) The hypocenters of the preeruption volcano-tectonic microearthquakes are, in many cases, restricted above sea level, and do not always occur in the same region. These observations led L´enat and
Bach`elery [1990] to propose the presence of a shallow magma reservoir that consists of many
Figure 1.4: Lava flows between 1972 and 2000. [From the website of Observatoire Vol-canologique du Piton de la Fournaise.]
Figure 1.5: Magma reservoir model proposed by L´enat and Bach`elery [1990]. It consists of many storage units of dikes and sills, connected to each other (After L´enat and Bach`elery [1990]).
summit (Figure 1.5). Carter [2004] proposed an existence of a magma reservoir 1 km below the Dolomieu floor from applying field fracture observation to the result of analogue experiments on crater formation of Roche et al. [2001]. Recent pit-crater formations [Longpr´e et al., 2004] show evidence of magma storage at a very shallow level.
In contrast, seismic and geodetic (InSAR and photogrammetry) data suggest a deeper magma reservoir. A seismic tomography found a low velocity zone of 1.5 km in diameter at a depth of 1.5 km below sea level, which was proposed as a magma chamber [Nercessian et al., 1996]. Aki
and Ferrazzini [2000] proposed a model that consists of relatively deep reservoirs and channels
(between 0 and 5 km below sea level), from their analyses on coda localization and preeruption long-period events. Cayol and Cornet [1998a] estimated the shallower limit of the depth of the magma reservoir that fed the 1983–1984 eruption at 19 km, from the fact that no deflation source was indicated by photogrammetric data. Sigmundsson et al. [1999] calculated interfer-ograms from RADARSAT-1 images for pre-, co- and post-eruption displacements associated with the March 1998 eruption at Piton de la Fournaise, and modelled them. These interfero-grams did not also show any deflation, which led them to conclude that magma should have been transported from more than 7 km depth below sea level.
Geochemical and petrological studies indicate at leat two levels of magma storage beneath the volcano. Vlast´elic et al. [2005] studied the Pb isotopes and trace elements of the lava emitted during 1998 and 2002, and found two levels of magma storage: one at the level of oceanic crust and the other at a shallower level in the edifice. Bureau et al. [1998] proposed, from a study of
melt inclusions in olivine phenocrysts, that magmas were stored at different depths, from shal-low levels to 15 km or more, beneath the summit. Similarly, Boivin and Bach`elery [2003] found two populations of clinopyroxene in the lavas emitted between 1977 and 1998, indicating that the magma evolution took place at two different, intermediate and shallow, depths. The shallow storage system is probably located within the edifice, as evidenced by the interactions of magma with hydrothermally-altered materials. Data dispersion of Al/Ti ratio further suggested the evo-lution in different isolated storage units (at the same depth level), which supports the L´enat and Bach`elery model (Figure 1.5). Sigmarsson et al. [2005] identified two different magma storage depths from analyses of residence times using U-series disequilibria. They concluded that the deeper reservoir system is poorly replenished and magma resides on timescales of the order of 1000 years, whereas the shallower one is consistent with a residence time of 25 years and
a volume of 0.35 km3. The latter, according to them, might correspond to the reservoir at the
volcanic edifice–oceanic crust interface (7 km beneath the summit).
1.2
Displacement Measurements by SAR Interferometry
1.2.1
Background
Radars, as the origin of the word radio detecting and ranging indicates, detect distant objects and determine their position and velocity [see e.g. Zebker et al., 2000]. The processed radar image, called Single Look Complex, contains the amplitude and phase of radar career sig-nals (electromagnetic waves). The principle of interferometry is to compare the phase in two radar images in order to map range changes, where range means the distance between the radar antenna and the object. Its first applications in the 1970s and 1980s concerned topography map-ping [see Massonnet and Feigl, 1998, for a review]. After technical developments in the late 1980s [Gabriel et al., 1989; Massonnet, 1985], geophysical applications of radar interferometry to measure small (of the order of 1 cm) ground displacements have exploded in the early 1990s and thereafter, with the launches of ERS-1 satellite and successors.
InSAR is revolutionary with respect to conventional geodetic methods in that it can map surface motions with fine resolution (20–100 m) over large swaths (tens of kilometers), and that no instrument is needed on the field. The former characteristic obviously contributes to better constraining geophysical models of the deformation source, while the latter enables studying volcanoes that lack on-site deformation monitoring networks (due to remoteness of the volcano, financial limitations, etc.), as in Aleutian and Alaska [Lu et al., 2000a,b,c, 2002, 2003; Mann
et al., 2002; Masterlark and Lu, 2004], Gal´apagos [Amelung et al., 2000a; J´onsson et al., 1999,
2005; Yun et al., 2005], and the Andes [Pritchard and Simons, 2002, 2004a,b].
Since its birth, InSAR has experienced persistent and rapid methodological developments. Permanent Scatterers [Feretti et al., 2001; Salvi et al., 2004] or Persistent Scatterers [Hooper
et al., 2004] (PS) technique can detect displacements on terrestrial spots where backscattering
characteristics change little with time, even in regions where incoherency of signals dominates. PS can also be used to enhance the signal-to-noise ratio of interferograms [Lyons and Sandwell, 2003]. Efforts have also been made to obtain a fine time series of InSAR data [Bechor and
Zebker, 2004; Lundgren et al., 2001; Schmidt and B¨urgmann, 2003]. It is, in principle, possible
to develop a time series of InSAR data with temporal resolution equivalent to the repeat period of the satellite. Apart from interferometry which treats the phase information, amplitudes of backscattered radar signals can also be useful. By detecting the offsets of corresponding points
in two images, ground displacements in azimuth (direction parallel to the satellite’s traveling direction) can be extracted [Michel et al., 1999a]. Despite relatively large uncertainty in data of typically several tens of centimeters, this technique often provides complementary data in a horizontal direction for studying large earthquakes [Feigl et al., 2002; Fialko et al., 2001b;
J´onsson et al., 2002; Michel et al., 1999a,b].
1.2.2
Production of interferograms
Resolution of a radar depends on its aperture. Synthetic aperture radars are designed for particu-lar signal processings to synthesize a particu-large aperture, that is, to have a fine resolution. Taking the difference of career signal phase in two processed images (Single Look Complex) acquired at different times generates fringes that are associated with topography, ground displacements that accumulated between data acquisitions, and difference in atmospheric properties (principally water vapor distribution; Hanssen [2001]). Here, one fringe corresponds to half the wavelength of the radar career signal. The phase differences caused by topography (topographic fringes) are removed by forming synthetic fringes from a digital elevation model (DEM). Those created by the difference in atmospheric properties, on the contrary, are in many cases difficult to remove, and they normally put limitation on the precision of an interferogram (order of one to several centimeters; e.g., Hanssen [2001]; Massonnet and Feigl [1998]).
Theoretically, two images taken from the same viewpoint should generate fringes that are uncorrelated with topography. In reality, this condition is never met and the satellite is posi-tioned at slightly different locations for the two acquisitions. The larger the difference in view angles of the two images, the more sensitive the interferogram is to topography. This sensitivity
is often expressed through the altitude of ambiguity ha, the elevation difference that corresponds
to a fringe (2π phase change) [Massonnet and Rabaute, 1993] ha∼
Rλ tan θ 2Bh
(1.1)
where Bh is the horizontal separation between the image acquisition points (the horizontal
baseline), R is the observation range, θ is the incidence angle, and λ is the wavelength.
1.2.3
Unwrapping of interferograms
For data inversions, it is normally desirable to convert the phase values (known only modulo 2π) to physically-meaningful displacements along the line-of-sight direction of the satellite, by counting the phase cycles (fringes). This conversion is called phase unwrapping (or simply
unwrapping). For a phase value of a pixel at i-th row and j-th column φij of a two-dimensional
array, the unwrapped displacement at the corresponding pixel uij can be written as
uij = λ 2
nijφij
2π + l, (1.2)
where λ is the wavelength of the radar signal, nij is an integer, and l is a constant. Unwrapping
consists of determining nij for all combinations of i and j. The constant l can be determined
in such a way that the displacements far from deformation sources are zero, or as done in this study, that the discrepancy between observed and modelled displacements becomes minimum (Section 2.3.4).
Numbers of unwrapping algorithms exist, but they all assume that the true unwrapped dis-placement field varies slowly enough that in most places, neighboring phase values are within one-half cycle (π rad) [Chen and Zebker, 2000]. Unwrapping intrinsically includes a risk of
errors because supplementary information (integers nij at all the pixels) is added to the
orig-inal phase data. It is therefore important to check if unwrapping was properly done. Proper unwrapping provides smooth displacements consistent with the number of fringes in the origi-nal interferogram where no displacement discontinuity is expected, and discontinuity correlated with geological features (earthquake faults, for example).
1.2.4
Applications
Applications of InSAR covers various fields: tectonic deformation, volcanism, subsurface fluid movement, terrain classifications, glacial processes, landslides, and so on [B¨urgmann et al., 2000; Massonnet and Feigl, 1998]. B¨urgmann et al. [2000] gives an exhaustive review on previous works (before 2000) that used InSAR data of coseismic, postseismic and interseismic deformation, volcano deformation including inflation and deflation of magma chambers and dike and sill intrusions, and land subsidence. Indeed, more than 90 papers have been published in these research areas from major journals at the time of writing (July 2005).
The fine spatial resolution of InSAR data allows estimating a detailed slip distribution of an earthquake fault [e.g. J´onsson et al., 2002; Pedersen et al., 2003, see also the next section]. Ma-jor studied regions are: California (Landers in 1992 [e.g. Massonnet et al., 1993], Hector Mine in 1999 [e.g. J´onsson et al., 2002]), Alaska (Nenana Mountain in 2002 [Wright et al., 2003] and Denali in 2002 [Wright et al., 2004]), Iceland [Pagli et al., 2003; Pedersen et al., 2001], Turkey (˙Izmit in 1999 [Bos et al., 2004; Feigl et al., 2002], D¨uzce in 1999 [B¨urgmann et al., 2002]), and Bam earthquake in 2003 [Fialko et al., 2005; Talebian et al., 2004]. Besides the studies of coseismic deformation, postseismic deformation is also actively studied using InSAR because it can reveal valuable information about the rheology of the Earth’s crust. InSAR studies in this category include afterslips following major earthquakes [e.g. Jacobs et al., 2002; Peltzer et al., 1998], poroelastic rebound [e.g. Peltzer et al., 1998],viscoelastic deformation [e.g. Pollitz et al., 2000], and reactivated slip on nearby faults [Fialko et al., 2002].
On volcanoes, InSAR elucidated complex displacement fields that originate from inflation and deflation of magma chambers, dike and sill intrusions, lava flow subsidences, and geother-mal activities. In addition, InSAR also drew great attention as a means of eruption monitoring of remote and “non-equiped” volcanoes. Studied volcanic systems include Etna [e.g. Briole
et al., 1997; Froger et al., 2001; Lundgren and Rosen, 2003; Massonnet et al., 1995; Ranvier,
2004], Campi Flegrei [e.g. Avallone et al., 1999; Lanari et al., 2004; Lundgren et al., 2001], Alaskan volcanoes [e.g. Lu et al., 2000a,b,c], Icelandic volcanoes [e.g. Pedersen et al., 2003;
Sigmundsson et al., 1997], volcanoes and geothermal field in Western United States [e.g. Fi-alko and Simons, 2001; FiFi-alko et al., 2001c; Wicks et al., 1998], Kilauea volcano [Cervelli et al., 2002], the Andes [Pritchard and Simons, 2002, 2004a,b], Gal´apagos volcanoes [Amelung et al., 2000a; J´onsson et al., 1999; Yun et al., 2005], Piton de la Fournaise [Froger et al., 2004; Fukushima et al., 2005; Sigmundsson et al., 1999], Fogo [Amelung and Day, 2002] and some
others.
On R´eunion Island, volcanic deformation at Piton de la Fournaise and local landslides at Piton des Neiges have been studied using InSAR. Sigmundsson et al. [1999] estimated a seaward-dipping dike from an interferogram that recorded the coeruptive displacements of the March 1998 eruption at Piton de la Fournaise. Fukushima et al. [2005], the paper presented
in Chapter 2, developed a method based on a 3D mixed boundary element method [Cayol and
Cornet, 1997] and a Monte Carlo inversion algorithm [Sambridge, 1999a,b]. They applied the
method to interferograms of the Februrary 2000 eruption. Froger et al. [2004] studied the Au-gust 2003 eruption from the interferograms calculated from ENVISAT images with the method of Fukushima et al. [2005]. Raucoules et al. [2003] identified landslides in the Salazie Cirque (northeast cirque of Piton des Neiges). They worked on interferograms computed from both JERS-1 (L-band: wavelength 23.5 cm) and RADARSAT-1 (C-band: wavelength 5.7 cm) im-ages, and concluded that data from L-band satellites would be useful to monitor landslides at R´eunion Island.
1.3
Ground Deformation Data Modelling on Volcanoes
Dvorak and Dzurisin [1997] compiled the geodetic measurements and modelling studies that
had been made on active magmatic systems until 1997 (i.e., before the extensive applications of InSAR), with the major findings obtained from the modelling studies. According to them, the dawn of ground deformation measurements of active volcanoes dates back to 1819 on Campi Flegrei. Since then, monitoring networks have been developed on about 50 volcanic areas and a considerable amount of knowledge has been achieved through modelling. Today, we are in the next stage of great advance in modelling of volcanic systems with the aid of the new technologies of GPS and InSAR.
1.3.1
What is modelling?
In scientific contexts, a model, when used as a noun, means a schematic and simplified de-scription of a phenomenon or an object. To model means, depending on the context, either to (conceptually) construct a model, or to quantitatively explain data based on a model.
In the domain of geodesy, modelling (in both meanings) gives light on the characteristics of the source of signals, such as the position, spatial dimensions, amount of dislocation, as well as on the rheology of the medium. Namely, modelling helps explaining the physical processes that occur beneath the ground. Modelling first requires a mathematical, numerical or empirical expression (model) that predicts signals when characteristics of the source is known. Obtain-ing this relation is referred to as forward problem. Several assumptions are made at this step because we have to approximate or idealize the complex Earth as a simple body. Once such an expression is obtained, the next problem is to infer the characteristics of the buried source, which are normally unknown, from the observed (known) signals. This kind of problem is referred to as inverse problem; we invert data to know about their source. Solving an inverse problem is called inversion (Section 1.3.4).
See Chevallier and Verwoerd [1988] and De Natale and Pingue [1996] for a review of the methods and problems in modelling of ground deformations in volcanic areas.
1.3.2
Analytical models
Mogi [1958] developped an analytic formulation for the ground deformation due to the inflation
of a deep magma body, by considering a point pressure source of radial expansion in an elastic half-space. Because of its simplicity, Mogi’s model has been extensively applied to inflation or deflation of a magma chamber or a geothermal source [e.g. Bj¨ornsson et al., 1977; Dvorak et al.,
1983; Furuya, 2004; Lu et al., 2000a,b,c, 2002, 2003; Mogi, 1958; Pritchard and Simons, 2002, 2004a,b; Sigmundsson et al., 1997; Vadon and Sigmundsson, 1997; van Dalfsen et al., 2004;
Yokoyama, 1986]. Other analytical expressions for a volumetric pressure source in elastic media
have been developed for a finite sphere [McTigue, 1987], an oblate ellipsoid [Yang et al., 1988] with applications by several workers [Fialko and Simons, 2000; Lanari et al., 2004; Lundgren
et al., 2001; Pritchard and Simons, 2004a], and a penny-shaped fracture [Fialko et al., 2001a]
with applications by Fialko et al. [2001c] and Fialko and Simons [2001]. By distributing point sources in a 3D space, Vasco et al. [1988], Vasco et al. [2002], Mossop and Segall [1999], and
Masterlark and Lu [2004] modelled an arbitrary shape of pressure source.
Okada [1985] formulated analytical expressions for the ground displacements due to a
fi-nite rectangular dislocation (having both slip and tensile components) in an elastic half-space. Okada’s model has also been extensively applied to dike and sill intrusions [e.g. Amelung et al., 2000b; J´onsson et al., 1999, 2005; Lundgren and Rosen, 2003; Okada and Yamamoto, 1991;
Okamura et al., 1988; Owen et al., 1995, 2000; Sigmundsson et al., 1999; Ueda et al., 2005; Wicks et al., 1998, 2001] and fault slips [e.g. Amelung and Bell, 2003; Cervelli et al., 2001; Fujiwara et al., 1998; Lohman et al., 2002; Pagli et al., 2003]. When enough data points are
located close to a deformation source, we can go further and estimate the opening distribution for intrusions [Amelung et al., 2000a; Aoki et al., 1999; Pedersen and Sigmundsson, 2004a,b;
Troise et al., 1999; Yun et al., 2005] or the slip distribution for earthquakes [e.g. B¨urgmann et al., 2002; Feigl et al., 2000; J´onsson et al., 2002; Nishimura et al., 2001; Pedersen et al.,
2003; Segall and Harris, 1986; Ward and Barrientos, 1986; Wright et al., 2003] on an assumed source geometry. Most of these studies first invert for the geometry of the rectangular source by assuming a constant slip, and then invert for the slip distribution on the determined fault. Some studies chose more appropriate approach; they grid-searched for some of the optimum source geometry parameters, with a slip (opening) inversion for each set of model parameters defining the source geometry [Fialko, 2004; Fialko et al., 2005; Simons et al., 2002; Yun et al., 2005].
Williams and Wadge [2000] and others developped an approximate analytical technique for
including topographic effects. Relaxing the assumption of linear elasticity, analytical solu-tions are obtained also for a point source in viscoelastic [Bonafede et al., 1986], thermoelastic [Bonafede, 1990; Furuya, 2005] and anisotropic media.
1.3.3
Numerical models
Numerical model computations are time consuming compared to analytical ones, but this dis-advantage is becoming less crucial with recent advances in computer performance. Numerical models can, depending on their functionalities, incorporate several structures of arbitrary shape, topography, and take into account various rheological characteristics.
One of the main applications of numerical modelling methods is to investigate the effects of complex conditions, such as complex source geometries, often to assess the limitations of more simplistic analytical models. Using a finite element method, Dieterich and Decker [1975] examined the effects of different geometries of either axisymmetric or plane strain (two dimen-sional) sources. Pollard et al. [1983] made two-dimensional boundary element calculations to obtain useful empirical relationships between the parameters that define dike characteristics and the ground displacements. Cayol and Cornet [1998b], Williams and Wadge [2000] and
Lun-garini et al. [2005] investigated the effects of topography with an application to Mount Etna. Masterlark [2004] systematically examined the possible biases of model estimation that result
[1987] applied a two-dimensional numerical method called “Bloc”, derived from a finite ele-ment method, to the landslide of Mount St. Helens in 1980. This method can take into account anisotropy, heterogeneity, linear and nonlinear elasticity, elastoplasticity of the media, as well as fractures.
Another main axis of applications of numerical models is the inversion of data for which the position and/or geometry of the source is relatively constrained a priori. By applying the mixed boundary element method, Cayol and Cornet [1998a] and Beauducel et al. [2000b] searched for the overpressure and a combination of the overpressure and shear stress on a fixed pressure source that best explain data, and Cayol et al. [2000] searched also for the source geome-try. Beauducel and Cornet [1999] performed an inversion for the source location and volume change, though with limited iterations. Rubin [1992] studied the normal faulting induced by dike propagation and resulting graben subsidence in volcanic rift zones, with application on lev-eling data at Krafla, Iceland, by using a three-dimensional boundary element method. Cervelli
et al. [2002] used a boundary element method to model a dike of uniform overpressure, after
inverting for the best fitting uniform opening source, in pretty much the same way as the “two step inversions” made for estimating an opening distribution described in Section 1.3.2. Yun
et al. [2005] tested a diapiric geometry for a magmatic source with a boundary element method
and compared the result with their sill model determined from inversions of analytic sources. The present study belongs to the latter axis of applications, but performs a thorough inver-sion on the dike geometry associated with fissure eruptions at Piton de la Fournaise. This has become possible by the combination of an optimized boundary element calculation procedure and an efficient inversion algorithm. This method was successfully applied to the August 2003 eruption at Piton de la Fournaise [Froger et al., 2004].
1.3.4
Data inversion
Suppose that we have n data points and that a given model explains the data with m parameters. If we define the data vector d = (d1, d2, ..., dn) and the model vector m = (m1, m2, ..., mm),
we can write that
F(m) = d, (1.3)
where F is an operator that relates the model vector to the data vector. To solve such problems, m should be equal to or less than n. When F consists of linear equations, then Equation 1.3 can be solved by a linear least-square method. If the operator F cannot be expressed by linear equa-tions, then the problem is called nonlinear, and the word inversion normally refers to solving such nonlinear problems.
In inversions, a misfit function, or a cost function, is defined to quantify the discrepancy between observation and model expectation. An inversion algorithm then searches for model(s) that minimizes the misfit function in the model space which can be bounded by predefined model parameter limits.
Since measured data are given as an input, inversions are inherently concerned with uncer-tainty that stems from measurement uncertainties. In geophysical applications, we normally have, in addition to measurement uncertainties, modelling uncertainties that come from model assumptions. Moreover, ground observations in two dimensions obviously put a limitation for resolving three-dimensional processes. Due to these features, inverse problems generally have non-unique solutions. We must therefore bare in mind that inversions only give possible solu-tions in the assumed condisolu-tions. A model that well explains data is not necessarily realistic, and
even worse, a model that looks realistic might not correspond to what is happening in the Earth. To deduce reliable results from inversions, it is important to know the applicability limit of the assumptions, and also to compare obtained results with other data including field observation and expectations from theoretical studies.
To solve an inverse problem, one must choose between derivative (gradient) based or Monte Carlo (direct) algorithms. The former are generally suitable when the problem is expected to have a simple data-model relationship (a concave misfit function) as they require fewer model calculations than Monte Carlo methods. When the relationship becomes complex, the misfit function will increase complexity with multiple local minima of the function. In this case, Monte Carlo methods are favoured because they are (1) more reliable in the optimiza-tion/parameter search stage (a derivative based search would normally converge to a local minimum), and (2) usually more reliable in the estimation of uncertainties [Sambridge and
Mosegaard, 2002].
The neighbourhood algorithm [Sambridge, 1999a,b] used in this study is one of the Monte Carlo methods. It consists of two stages: search and appraisal. The search stage aims to pref-erentially search good data-fitting (low misfit) regions in the model space, rather than find a single optimal model [Sambridge, 1999a]. This algorithm has been used in crustal deformation inversions [Froger et al., 2004; Fukushima et al., 2005; Lohman et al., 2002; Pritchard and
Simons, 2002, 2004a,b]. The appraisal stage can estimate the statistical characteristics of the
model parameters, such as uncertainties and trade-offs, without further forward model calcula-tions (which are more time-consuming for numerical modelling methods than anlytical ones) that are required in other appraisal methods [Sambridge, 1999b].
1.4
Modelling of Dike Emplacement
1.4.1
Force of Dike Opening
A number of theoretical solutions have been derived on the shape of a stationary fluid-filled crack [e.g. Pollard, 1976; Rubin and Pollard, 1987; Secor and Pollard, 1975; Weertman, 1971]. Such solutions can be compared to the shape of an actual dike [e.g. Delaney and Pollard, 1981;
Pollard and Muller, 1976; Reches and Fink, 1988] by assuming that the dike was in equilibrium
at the end of its emplacement, more specifically, that the dike was emplaced while being molten and solidified while keeping its shape. The present study is also based on this assumption (see also Section 2.1). It should be noted that, for accurate modelling of dike propagation, i.e., its spatio-temporal evolution, one should consider a more complex system including the dynamics of magma flow [e.g. Fialko and Rubin, 1998; Lister and Kerr, 1991; M´eriaux and Jaupart, 1995, 1998; Turcotte et al., 1987], fracturing at the dike tip [e.g. Ingraffea, 1987; Khazan and Fialko, 1995; Rubin, 1993b], heat transfer including viscous dissipation (heat generated by viscous flow) [e.g. Fialko and Rubin, 1998, 1999; Rubin, 1993a], and so on; see also a review of Rubin [1995] on propagation of magma-filled cracks and the references therein.
For a dike connected to the magma reservoir to remain open, the overpressure of internal magma, defined by the magma pressure subtracted by the normal stress on the dike surface, should be positive on majority of the dike wall. The overpressure is first created at the magma reservoir, by oversaturation of volatile species in the reservoir [Tait et al., 1989] or by replen-ishment of the reservoir from a deeper level. During ascent, magma can change its density by vesiculation and degassing [e.g. Jaupart, 2000]. The geometry of the dikes arrested in the
edifice can be, therefore, determined by several different processes.
When the dike reaches the ground, i.e., when an eruption starts, the situation greatly changes. To explain the behaviour of dikes in such a case, a two-dimensional vertical dike is considered
(Figure 1.6). For simplicity, host rock and magma are assumed to have constant densities of ρr
and ρm. Magma is subject to buoyancy [Rubin, 1995]
∆ρg + d(∆Sn)/dz, (1.4)
where ∆ρ = (ρr − ρm), g is the gravitational acceleration, and ∆Sn is the deviation of the
horizontal stress from the vertical lithospheric stress Sn− ρrgz. The term d(∆Sn)/dz) can be
several times ∆ρg within the brittle crust [Rubin, 1995]. For this reason, buoyancy cannot be solely discussed in terms of the density contrast ∆ρ in this thesis which works on the shallowest several kilometers of the crust.
For positive buoyancy, magma can ascend with any value of reservoir overpressure. The buoyancy provides an overpressure for dike opening such that the overpressure is larger for shallower depth. The shape of the dike reflects such an overpressure profile (Figure 1.6a, b). If, on the other hand, magma is submitted to negative buoyancy, then the magma flow is driven solely by the overpressure at the reservoir. In this case, the dike is submitted to an overpressure such that the greater the depth, the larger the overpressure (Figure 1.6c, d).
Dikes submitted to negative buoyancy should not be able to propagate upward to the ground [Rubin and Pollard, 1987]. Observations indicate that Piton de la Fournaise start with lava fountaining, sometimes associated with a whistling noise [Villeneuve, 2000], which is consistent with very low density and large buyoyancy of magma. On the other hand, gravity measurement performed after a dike emplacement [L´enat et al., 1989a] suggests that dikes are denser than the surrounding rock. These observations indicate that dikes open because of buoyancy forces associated with a gas rich magma and that this magma is progressively replaced by a denser magma.
1.4.2
Direction of Dikes
Theoretical studies predict that dikes intruding into intact rock should propagate perpendicular to the direction of the minimum principal stress [e.g. Anderson, 1938]. Several field studies found, on the other hand, dikes that intruded on faults or other preexisting fractures [e.g.
De-laney and Gartner, 1997; Gudmundsson, 1983]. By calculating the stress at the dike tip, Ziv et al. [2000] investigated the ability of magma to propagate along preexisting fractures oblique
to the least principal stress. They concluded that dikes can intrude into preexisting fractures if one or more of the following conditions are satisfied: (1) the fracture is nearly perpendicular to the least principal stress, (2) the resolved shear stress on the fracture is small compared to the excess magma pressure, (3) the effective ambient dike-normal stress is small compared to the rock tensile strength. These conditions make dikes difficult to intrude into faults at midcrustal to lower crustal depths [Ziv et al., 2000].
At Piton de la Fournaise, numerous dry fractures are observed on the ground [Carter, 2004], with a slight preferential distribution along the rift zones. Anomalies in spontaneous polariza-tion, which reflect fractured zones in which fluids are preferentially channeled, are consistent with this surface fracture distribution [Michel and Zlotnicki, 1998]. Considering the in situ compressive strength of rocks and the gravitational stress field, open fractures may exist down to about 1 km beneath the ground [Rubin, 1995]. Existence of these open fractures are not ex-pected to modify the direction of dikes since the fractures themselves should have been created
Figure 1.6: Cross-sectional sketches for a two-dimensional vertical dike. Dike thickness is greatly exaggerated. When the buoyancy is positive, the dike opening reflects the positive over-pressure gradient toward the ground and vice versa. (a) Buoyancy is positive, dike reaching the ground. (b) Buoyancy is positive, dike far from the ground. (c) Buoyancy is negative, dike reaching the ground. (d) Buoyancy is negative, dike far from the ground.
by the similar stress field as the dikes are subjected to. Therefore, it can reasonably be con-sidered that dikes are emplaced perpendicular to the direction of the minimum principal stress even at these superficial levels.
1.5
Aim of the Study
The first aim of this study is to develop a method to estimate the overpressure and detailed geometry of intrusions from InSAR data. The mixed boundary element method [Cayol and
Cornet, 1997] is used to model the ground displacements caused by intrusions. This method
can take into account arbitrary geometries of intrusions as well as topography, which allows complex and realistic modelling. The neighbourhood algorithm [Sambridge, 1999a,b] is cho-sen as an inversion method, because it efficiently samples the model space with a small number of forward calculations, and also because it offers a model appraisal without any supplemen-tary forward calculations, which is important for a problem using a time-consuming numerical modelling method.
The second, and broader, aim is to get a better image of the magmatic and volcano-tectonic systems of Piton de la Fournaise from analyzing the displacements associated with the five eruptions that occurred between 1998 and 2000. Dike geometries estimated from InSAR data give direct evidence on the path in which magma had propagated, as well as the direction of the minimum principal stress. InSAR data can further detect the presence of any shallow magma reservoir that fed an eruption. Dike intrusions also lead to volcano growth and instability; it is important to consider the cumulative effect of such intrusions for predicting future development of the volcano.
Chapter 2
Method for Realistic Dike Model
Estimation - SAR Interferometry, Mixed
BEM and Monte Carlo Inversion
This chapter presents a method to find realistic and detailed dike models from InSAR data, using a combination of the mixed BEM and a Monte Carlo inversion algorithm. A dike model, in this thesis, constitue an ensemble of dike position, geometry and overpressure. First of all, assumptions on dike emplacements and mechanical state of the edifice are presented. Next, a paper published by Journal of Geophysical Research [Fukushima et al., 2005] describes the method with application to the February 2000 eruption at Piton de la Fournaise. The paper also discusses the magma storage system and tectonics of the volcano, which will be resummarized in the following chapter. Figures and explanations that complement the description of the paper are added at the end.
2.1
Model Assumptions
This study models the coeruptive ground displacements by assuming pressurized fractures in an elastic medium. This assumption is validated by large aspect ratios of basaltic dikes and by short time scales (order of a few days) associated with their formation [Lister and Kerr, 1991;
Rubin, 1993c]. Viscous effects (ductile flow) of host rock would become important for more
viscous magma at greater depth and larger time scale of deformation, in which case magma ascends as a diapir instead of a dike [Rubin, 1993c]. Theoretical studies predict that some plastic deformation or microcracking should occur at the dike tip region (called process zone) [Delaney et al., 1986; Maaloe, 1987; Pollard, 1987]. Indeed, inelastic deformation, associated with the formation of joints, breccias, fluidized clastic rocks, etc., is sometimes observed to extend from tens of centimeters to tens of meters from eroded dikes [Rubin, 1995]. This pro-cess zone, however, little affects the shape and dynamics of propagating dikes [Maaloe, 1987]. During a fissure eruption, the dike, being the magma path, is in a mechanical equilibrium; and it can solidify retaining its shape (Section 1.4). Moreover, no time-dependent displacement is observed after eruptions (dike formations) at Piton de la Fournaise, except for those associated with magma contraction due to cooling, suggesting that time-dependent viscoelastic and poroe-lastic deformations need not to be considered. With the above reasons, the formation of dikes can be suitably analyzed by elastostatic models.
![Figure 1.5: Magma reservoir model proposed by L´enat and Bach`elery [1990]. It consists of many storage units of dikes and sills, connected to each other (After L´enat and Bach`elery [1990]).](https://thumb-eu.123doks.com/thumbv2/123doknet/14535182.724003/25.892.112.789.122.567/figure-magma-reservoir-model-proposed-consists-storage-connected.webp)