O
pen
A
rchive
T
OULOUSE
A
rchive
O
uverte (
OATAO
)
OATAO is an open access repository that collects the work of Toulouse researchers and
makes it freely available over the web where possible.
This is an author-deposited version published in :
http://oatao.univ-toulouse.fr/
Eprints ID : 14006
To link to this article : doi:
10.1016/j.jnoncrysol.2011.06.009
URL :
http://dx.doi.org/10.1016/j.jnoncrysol.2011.06.009
To cite this version : Capsal, Jean-Fabien and Dantras, Eric and
Dandurand, Jany and Lacabanne, Colette
Molecular mobility in
piezoelectric hybrid nanocomposites with 0–3 connectivity: Volume
fraction influence
. (2011) Journal of Non-Crystalline Solids, vol. 357
(n° 19-20). pp. 3410-3415. ISSN 0022-3093
Any correspondance concerning this service should be sent to the repository
administrator:
[email protected]
Molecular mobility in piezoelectric hybrid nanocomposites with 0–3 connectivity:
Volume fraction influence
Jean-Fabien Capsal
a, Eric Dantras
b,⁎
, Jany Dandurand
b, Colette Lacabanne
b aPiezotech S.A.S., 9 rue de Colmar, 68220 Hésingue, FrancebPhysique des Polymères, Institut CARNOT-CIRIMAT, Université Paul Sabatier, 31062 Toulouse, France
a b s t r a c t
Keywords: Polymer; Piezoelectric; Composite; Barium titanate; PolyamideThermo Stimulated Current and Dynamic Dielectric Spectroscopy studies were carried out on hybrid ferroelectric Polyamide 11/Barium Titanate to investigate dielectric relaxation modes. The correlated results obtained by both methods allow us to describe precisely the molecular mobility of this 0–3 nanocomposite; in this work we will focus on the influence of the 700 nm nanoparticles volume fraction. The dielectric spectroscopy shows that the molecular mobility associated with the liquid dynamic is not influenced by the volume fraction. The evolution of low frequency relaxation, observed by depolarization currents techniques, have been attributed to the decrease of Cooperative Rearranging Region size and the increase of intra/inter macromolecular interactions in the soft amorphous phase.
1. Introduction
Since the discovery of the ferroelectric behavior of some class of polymers[1–6], these materials have attracted great interest for their good piezo/pyroelectric properties, low permittivity, lightweight and ductility. These materials have potential applications in sensor and electromechanical transduction. However, the poling field required to give a ferroelectric property to these materials is high[7–9]. This high poling field could restrict their use in some particular cases. Ferroelectric ceramics such as Barium titanate are commonly known for their high electroactive properties and low poling field[10,11]. To overcome the disadvantage of high poling field of organic ferroelec-trics, inorganic particles are dispersed in a polymeric matrix to obtain a 0–3 connectivity composite in Newnham notation[12]. Previous works have shown that the piezo/pyroelectric properties of these composites have a poling field more than 20 times lower than ferroelectric polymers[13–17]. The final electroactive properties of these composites are close to organic materials and conserve the ductility of the matrix[18].
As far as we know, very few works have been devoted to the influence of the inorganic phase on the physical structure of the organic amorphous phase. In this study we report the volume fraction influence of inorganic ferroelectric barium titanate (700 nm) on the molecular dynamics of the amorphous phase of a polyamide 11. Broadband Dielectric Spectroscopy and Thermo Stimulated Current
have been used to check the physical structure of these composites at a nanometric scale in a wide frequency range.
2. Experimental 2.1. Samples elaboration
The mean diameter of Barium titanate (BaTiO3) nanoparticles is
700 nm. Polyamide 11 (PA 11) powder was dissolved in a solution of dimethyl acethyl amide (DMAc) and the required barium titanate powder was dispersed to form a mixture by ultrasonic stirring. The samples were dried over night at 110 °C to remove the solvent. The nanocomposites were hot pressed to form thin films of 70 to 100 μm thick. Volume fractions (ϕ) of nanoceramic in nanocomposite films were ranging from 0.03 to 0.45.
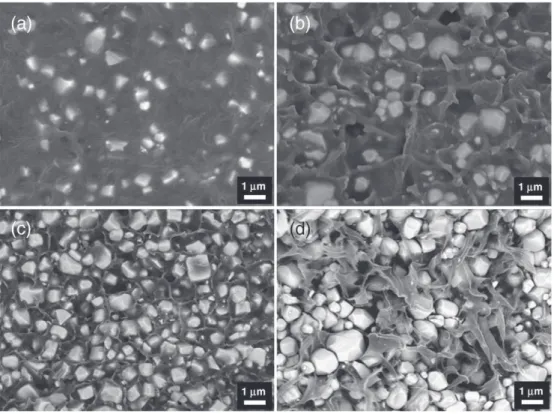
The dispersion of barium titanate nanopowder in the polymeric matrix has been studied by Scanning Electron Microscopy (SEM) in order to check the experimental protocol. Fig. 1 shows cryo-cut images of PA11/BaTiO3700 nm nanocomposites for 12%, 24%, 45% and
58% in volume. A homogeneous dispersion at nanometric scale is observed until a volume fraction of 45%. For ϕ = 58%, nanoparticles aggregation is observed; that could be responsible of a decrease of mechanical properties.
2.2. Dielectric experiments
Thermostimulated Currents (TSC) thermograms were carried out on a TSC/RMA Analyser. For complex thermograms, the sample was polarized by an electrostatic field during tp=2 min over a temperature
range from the polarization temperature Tp=90 °C down to the freezing ⁎ Corresponding author.
E-mail address:[email protected](E. Dantras).
temperature T0. Then the field was turned off and the depolarization
current was recorded with a constant heating rate (qh=+7 °C·min−1),
the equivalent frequency of the TSC spectrum was feq~10−2–10−3Hz.
Elementary TSC thermograms were performed with a poling window of 5 °C. Then the field was removed and the sample cooled at a temperature Tcc=Tp− 30 °C. The depolarization current was recorded with a constant heating rate (qh=+7 °C·min−1). Each elementary thermogram was
recorded by shifting the poling window 5 °C toward higher temperature. Dynamic dielectric spectroscopy (DDS) were performed using a BDS400 covering a frequency range of 10−2Hz − 3.106Hz with 10
points per decade. Experiments were carried out in a temperature range from −150 °C to 150 °C. Dielectric isothermal spectra were measured every 2 °C. Before each frequency scan, temperature was kept constant to ±0.2 °C. The real ε′Tand imaginary ε″Tparts of the
relative complex permittivity ε*T were measured as a function of
frequency f at a given temperature T. The complex dielectric permittivity ε⁎ was fitted by the Havriliak–Negami function: εð Þ = εω ∞+
εs−ε∞
ð Þ
1 + iωτð ÞβHN
γHN
Where εsis the static permittivity, ε∞is the permittivity at high
frequency, and βHN,γHNare the Havriliak–Negami parameters.
3. Results
In this section, the volume fraction influence of 700 nm BaTiO3
nanoparticles is observed by DDS and TSC on the molecular mobility of the PA 11 amorphous part. The volume fraction ϕ of BaTiO3in PA 11
is ranging from 0% to 58%.
3.1. Dielectric relaxation modes in dynamic spectroscopy
The isothermal relaxations modes have been characterized by DDS. Prior to measurements and to prevent any plasticization phenomena causes by water absorption of aliphatic polyamides[18]the composites were dehydrated along 4 h at 110 °C. Volume fraction influence on the
conservative (ε′) and dissipative part (ε″) of the dielectric permittivity have been studied.
Fig. 2a shows the frequency dependence of ε′ for the isotherm T = 26 °C. The volume fraction is ranging from 0% to 45%. The conservative part of the polyamide 11 dielectric permittivity is ε′=2.5 at f = 1 kHz and slightly decrease with the frequency. Barium titanate is known for its high dielectric permittivity[19](ε′~1500 at 25 °C). As the inorganic BaTiO3nanoparticles are dispersed into the organic matrix, the
dielectric permittivity of the composite highly increases with ϕ. Dielectric permittivity is increasing from 3 for 3% to 10 for 45% in volume. In the same way the frequency evolution of the permittivity between 0.1 Hz and 1 MHz (Δε=ε′ (1 MHz)−ε′ (0.1 Hz)) is enhanced by the volume fraction of inorganic phase; i.e. Δε=0.75 for polyamide 11 and is multiplied by 2 for 24% in volume.
As the conservative part of the permittivity, the dielectric loss ε″ is modified by the inorganic volume fraction. Fig. 2b shows the frequency dependence of ε″ at T = 26 °C. The dielectric loss of the polyamide matrix at 1 MHz is ε″ = 0.035. As the volume fraction of barium titanate increases from 3% to 24%, the dielectric losses increase from 0.042 to 0.07. For 45%, ε″ slightly decrease but is still higher than the dielectric loss of the matrix.
Fig. 3reports the thermal dependence of the dielectric permittivity of PA11/BaTiO3 (58% in volume) for various frequencies ranging from
74 kHz to 1 MHz. Two dielectric phenomena are pointed out. The first one is attributed to the dielectric manifestation of the polyamide glass transition (α mode). The second one at 130 °C cannot be distinguished until a volume fraction up to 45%. This relaxation is not thermally activated and so can be associated with the inorganic phase. The temperature position and frequency dependence of this phenomenon are consistent with the dielectric manifestation of the nanoparticles Curie transition[19,20]. Below 45% in volume, the dielectric behavior of PA11/BaTiO3 700 nm composites is governed by the organic phase
predominantly. Above ϕ= 45% a competition between inorganic and organic component appears; a complex dielectric spectra is composed of both phases responses results.
The analytical fit of the dielectric permittivity ε* (ε* =ε′ −iε″) with Havriliak–Negami equation [21] allows us to extract the
relaxations times τHN associated with the polyamide 11 dipolar
relaxations. As previously report [20], in this temperature and frequency range PA 11 is characterized by 4 modes called γ, β, α and α′. In this study we focus on the dielectric relaxations γ, α and α′. The β mode, generally associated with the water amide complex has not been studied due to inherent evolution of this relaxation mode
with water. Heterogeneous systems such as semi-crystalline polymers are generally characterized at low frequency and high temperature by an important increase of the dielectric permittivity. This process is known as Maxwell–Wagner– Sillars (MWS) phenomenon[22]. The increase of ε″ due to MWS process could hinder dipolar relaxation involved at high temperature. In order to avoid this issue, the dielectric modulus formalism has been used to extract the relaxations times of high temperature dielectric relaxation (α′ and MWS).
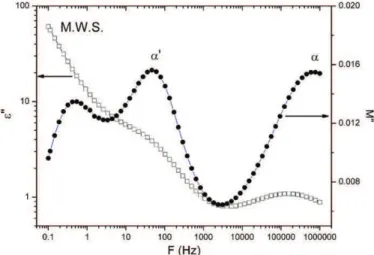
Fig. 4shows a high temperature isotherm T = 80 °C of dielectric loss for permittivity (ε″) and modulus (M″) for PA11/BaTiO3700 nm
composite with ϕ=24%. For dielectric permittivity two relaxations modes are pointed out (α and α′) with an important increase of ε″ in the low frequency range (MWS process and/or conductivity phenomenon). With dielectric modulus formalism, three dielectric phenomena are identified. This formalism allows a better resolution of α′. The MWS process is characterized by a peak which gives an opportunity to follow the influence of particles volume fraction on this process.
The Arrhenius diagram of the composites is reported inFig. 5as function of ϕ. The relaxation times of the γ, α, α′ modes and MWS are reported. γ and α relaxations have been fitted in the permittivity formalism; α′ and MWS in the modulus formalism.
The γ mode has an Arrhenius behavior while α is characterized by a Vogel–Tammann–Fulcher (VTF) temperature dependence. The pre-exponential factor τ0, the activation energy Eaand the VTF parameters
are reported inTable 1. The activation energy of sub vitreous γ relaxation of PA 11 is Ea=49 kJ·mol−1with a pre-exponential factor τ0= 1.10−7s.
The activation energy slightly decreases with the introduction of the barium titanate particles: from 46 kJ·mol-1for ϕ=12% to 38 kJ·mol-1
for ϕ=45%. The evolution with ϕ of τ0is opposite. τ0increases from
4.10-17s to 8.10-16s respectively. VTF parameters of the α mode are not
dependant from the volume fraction. The dielectric relaxation associated with the dielectric manifestation of the glass transition is not influenced by the volume fraction.
The α′ mode follows a VTF behavior. This relaxation process is attributed to the molecular mobility of constrained amorphous phase near the PA 11 crystalline regions. The dispersion of BaTiO3into the
polyamide has a weak influence on the molecular dynamic of this mode. Nevertheless the α′ relaxation times are slightly shifted toward higher times with ϕ increases; it has been associated with a weak decrease of this constrained amorphous phase molecular mobility.
The MWS contribution is strongly influenced by the introduction of the BaTiO3particles. As the particles volume fraction increases, the
relaxation times of this relaxation process are shifted toward longer times indicating that free carriers require more thermal energy to be trapped in the amorphous/crystalline boundaries of the organic phase.
Fig. 3. Real part of the dielectric permittivity versus temperature of PA 11/BaTiO3700 nm
nanocomposites with ϕ= 58%.
Fig. 4. Frequency dependence of the dissipative part of the dielectric permittivity ε″ (□) and dielectric modulus M″ (●) measured at T = 80 °C for ϕ = 24%.
Fig. 2. Frequency dependence of ε′ (a) and ε″ (b) measured at T = 26 °C for ϕ = 0%, 12%, 24% and 45%.
3.2. Dielectric relaxation modes in thermal analysis
The evolution of the non isothermal relaxation processes have been characterized by TSC. Prior to the measurements, the samples were heated up to 140 °C for 30 min to prevent any plasticization effect due to water absorption of the polyamide. As we only focus on the influence of the BaTiO3particles on the molecular mobility of the
organic matrix, TSC thermograms were normalized to the volume fraction of organic phase.
Fig. 6shows the TSC thermograms of PA11/BaTiO3700 nm in a
temperature range from −150 °C to 0 °C with ϕ ranging from 3% to 24%. The samples have been polarized under an electric field of 3 MV·m−1(t
p= 2 min) at 0 °C and then short-circuited at −160 °C.
In this temperature range, only one relaxation β1has been pointed out
for polyamide 11 at Tβ= −50 °C. This process is attributed to the
dipolar relaxation of the free amide groups in the amorphous phase. A shoulder in low temperature tail Tβ2= −80 °C of the TSC thermogram
is observed. This mode is associated with the mobility of “water-amide” complexes. BaTiO3particles do not influence the temperature
position of the relaxation processes. However, the β relaxations amplitude (σβmax) decreases; i.e. σβmaxof PA11/BaTiO3with ϕ = 24%
is diminished by 50% compare to polyamide.
Complex TSC thermogram of the β modes with ϕ = 12% and the elementary processes associated with this relaxation are shown in
Fig. 7a. Elementary processes follow the global thermal evolution of the complex thermogram. Two maxima attributed to β1 and β2
dipolar relaxations are pointed out. From the fractional TSC thermo-grams the characteristic activation parameters of these processes are extracted.
The activation enthalpies ΔH (with an uncertainty of 5%) as function of temperature for PA11/BaTiO3composites are reported on
Fig. 8. The null activation entropy dependence of the enthalpies[23]
(called Starkweather “line”) is also reported. β modes are character-ized by a linear dependence of ΔH. Whatever the volume fraction of inorganic phase in the composite the enthalpies of these processes
Fig. 5. Relaxation map of PA 11/BaTiO3700 nm composites extract from Havriliak–
Negami equation using the dielectric permittivity formalism for γ and α relaxations (full symbols) and the dielectric modulus formalism for α′ relaxation and MWS (open symbols).
Table 1
Arrhenius parameters of γ relaxation and VTF parameters of α relaxation of PA11/BaTiO3
composites with ϕ=0%, 12%, 24%, 45%. Volume
fraction ϕ
γ model γ mode α mode α mode α mode α mode
τ0(s) Ea(kJ/mol) τ0(s) α (K−1) T0(K) D = 1/αT0
PA 11 1 · 10−17 49 ± 1 8 · 10−11 2 · 10−3 293 ± 15 1.9
12% 4 · 10−17 46 ± 0.5 6 · 10−12 1 · 10−3 275 ± 10 3.5
24% 8 · 10−17 42 ± 1 1 · 10−10 2 · 10−3 292 ± 3 1.9
45% 8 · 10−16 38 ± 0.5 7 · 10−10 3 · 10−3 308 ± 7 1.03
Fig. 6. Low temperature TSC thermograms normalized to the volume fraction of organic phase for PA 11 and ϕ = 3%, 12% and 24% (Tp= 0 °C, T0= −160 °C).
Fig. 7. TSC thermogram (gray line) and elementary thermograms (black line) of (a) β mode for ϕ = 12% and (b) α mode for ϕ = 24%.
follow the Starkweather “line”. It means that the molecular mobility of β relaxations remains localized and not influenced by BaTiO3.
For high temperature TSC experiments, the composites were polarized under an electric field Ep= 0.5 MV·m−1at Tp= 80 °C and
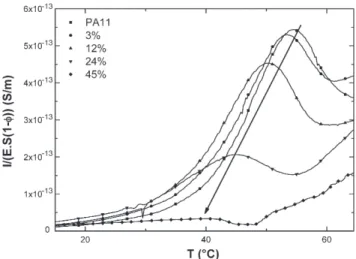
short-circuited at Tcc= 0 °C. Fig. 9 shows the high temperature
thermograms of PA11/BaTiO3composites with ϕ ranging from 0% to
45%. Only one relaxation mode (α mode) is pointed out whatever the volume fraction. This primary relaxation is occurring at Tα= 55 °C for
PA11. As Tαis in the same temperature range than the calorimetric
glass transition, the α relaxation is attributed to the dielectric manifestation of PA11 glass transition. Tαand σmaxlinearly decreases
with ϕ. For ϕ = 24%, the decrease of Tαis 10 °C and σmaxis reduced by
50% compare to pure PA 11.
Fig. 7b reports the fractional and complex TSC thermograms of composites with ϕ = 24%. The shape of elementary thermograms is coherent with the complex thermogram. From the fractional experiments, activation enthalpies ΔH of each elementary relaxation is determined and reported onFig. 8for ϕ ranging from 0% to 24%. For α relaxation activation enthalpies diverged from the null activation entropy line. It is consistent with delocalized cooperative mobility. However, the maximum enthalpy ΔH decreases with ϕ which indicates that the molecular mobility is more localized as ϕ increases.
4. Discussion
4.1. Slow relaxation processes
The relaxations times obtained by DDS and associated with the MWS phenomena are influenced by the dispersion of inorganic particles. As ϕ increases, τHN(MWS) are shifted toward longer relaxation times. MWS
is attributed to free charges carriers trapping at the boundaries of heterogeneities below the glass transition temperature. This process is highly dependent from the conductivity of the composite above Tg. BaTiO3is an electrically insulate material. When the volume fraction
increases, the high temperature conductivity of the composite decreases and so it requires more thermal energy for free carriers to be trapped near the heterogeneities. Due to time-temperature equivalence, more thermal energy means longer relaxation times. So the evolution of MWS with ϕ is attributed to the influence of the particles on the electric conductivity of the composites.
4.2. PA 11/BaTiO3700 nm composites connectivity
Fig. 10shows the real part of the dielectric permittivity ε′ versus the volume fraction of BaTiO3particles (room temperature, f = 1 kHz).
The experimental values have been fitted with the Bruggeman model
[24]. For ϕ b 45%, the experimental data are well fitted. According to this model, one can extract the dielectric permittivity of the inorganic part of the composite. From Bruggeman model, ε′ of BaTiO3700 nm is
evaluated to be nearly 1500. This value is in good agreement with bulk ceramic sintered from BaTiO3700 nm nanoparticles using Spark
Plasma Sintering technique. For ϕ N50%, the experimental points departs from the Bruggeman model. For these high volume fractions the connectivity [12] of the biphasic system is modified by the agglomeration of nanoparticles. 0–3 connectivity, in Newnham notation, does not govern the physical properties of the composite. For ϕ N 50%, 3–3 connectivity described the dispersion of inorganic nanoparticles in the polyamide matrix. This point is in good agreement with the observation of the Curie dielectric manifestation of the inorganic phase for ϕ N 50%, and with Scanning Electron Microscopy analysis.
4.3. Structural evolution of the organic amorphous phase
The decrease of the α mode amplitude obtained by TSC with the increase of inorganic phase has been attributed to the immobilization of a polyamide amorphous phase fraction. This point is in good agreement with Differential Scanning Calorimetry measurements performed on these composites [17]. ΔCp associated with Tg decreases with the
Fig. 8. Enthalpy versus temperature extract from elementary TSC thermograms for ϕ = 0%, 3%, 12% and 24% (symbols) and Starkweather“line” (dashed line).
Fig. 9. High temperature TSC thermograms normalized to the volume fraction of organic phase for PA 11 and ϕ = 3%, 12% and 24% (Tp= 80 °C, T0= 0 °C).
Fig. 10. Conservative part of the dielectric permittivity ε′ versus volume fraction ϕ and analytical fit with the Bruggeman model (solid line).
increase of ϕ. Due to the low interactions between inorganic and organic phase of the composites, the immobilization of polyamide amorphous phase has been attributed to the increase of intra and inter macromolecular interactions induced by high densification of the matrix with ϕ.
The main influence of the nanoparticles on the polyamide matrix reports in this study concerned the variation of dipolar relaxation enthalpies of the amorphous phase, extracted from elementary TSC thermograms, near the vitreous transition. An important decrease of the maximal and minimal enthalpies of the α relaxation mode with ϕ is shown on composites.
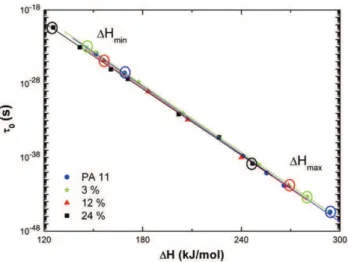
Fig. 11 illustrates the evolution of the pre-exponential factor τ0
(proportional to activation entropy ΔS) versus activation enthalpy extracted from fractional TSC thermograms of α mode as function of ϕ. For each volume fraction a compensation phenomenon is pointed out. The compensation times τcand compensation temperature Tc
deduced for PA 11 are τc= 2 · 10−2s and Tc= 75 °C (Tg+ 20 °C). The
volume fraction does not influence the compensation parameters of α mode. Open circles onFig. 11mark the maximum and minimum values of activation enthalpy. PA 11 has a maximal enthalpy ΔHmax=
293 kJ·mol−1 and a minimal one ΔH
min=151 kJ·mol−1. As ϕ
in-creases, the maximum and minimum ΔH values decrease; i.e. ΔHmax
decreases from 279 kJ·mol−1for ϕ =3% to 246 kJ·mol−1for ϕ= 24%.
In a same way, ΔHminis decreased by 30% for a volume fraction of 24%.
The decrease of activation enthalpies values with ϕ is attributed to the reduction of Cooperative Rearranging Regions (CRR) size[25]due to the high densification of the matrix with the inorganic phase content. However, the BaTiO3700 nm particles are assumed to have
an infinite size compare to CRR (few nanometers[26]).
5. Conclusion
The present study describes the influence of inorganic nanofillers on the physical properties of the polymeric matrix of PA11/BaTiO30–3
nanocomposites. The volume fraction of BaTiO3particles increases the
conservative and dissipative part of the dielectric permittivity. The evolution of ε′ with ϕ is well described by Bruggeman model until ϕ = 45%. Above this inorganic content, a divergence between experi-mental data and Bruggeman model is observed mainly caused by a change in connectivity from 0–3 to 3–3. The molecular mobility in the liquid state is not perturbed by BaTiO3fillers. In the glassy state, a slight
evolution of the soft organic amorphous phase has been pointed out. The important densification of the composite with ϕ induces a decrease of the CRR size observed thanks to enthalpy values. The amplitude of the TSC α mode decreases with ϕ which is consistent with an immobili-zation of a part of the amorphous phase of the polyamide matrix caused by an increase of intra/inter macromolecular interactions.
Acknowledgements
The authors acknowledge the financial support of DGCIS and Région Midi-Pyrénées under NACOMAT program.
References
[1] H. Kawai, Japanese Journal of Applied Physics 8 (1969) 975. [2] A.J. Lovinger, Science 220 (1983) 1115.
[3] M. Oshiki, E. Fukada, Journal of Materials Science 10 (1975) 1. [4] L. Ibos, A. Bernes, C. Lacabanne, Ferroelectrics 320 (2005) 48. [5] R.J. Klein, J. Runt, Q.M. Zhang, Macromolecules 36 (2003) 7220.
[6] H.M. Bao, J.F. Song, J. Zhang, Q.D. Shen, C.Z. Yang, Q.M. Zhang, Macromolecules 40 (2007) 2371.
[7] G.A. Samara, F. Bauer, Ferroelectrics 135 (1992) 385.
[8] J.I. Scheinbeim, J.W. Lee, B.A. Newman, Macromolecules 25 (1992) 3529. [9] J.F. Capsal, E. Dantras, J. Dandurand, C. Lacabanne, Polymer 51 (2010) 4606. [10] T.A. Perls, T.J. Diesel, D.W. Dobrov, Journal of Applied Physics 29 (1958) 1297. [11] W.R. Cook, D.A. Berlincourt, F.J. Scholz, Journal of Applied Physics 34 (1963) 1392. [12] R.E. Newnham, D.P. Skinner, L.E. Cross, Material Research Bulletin 13 (1978) 525. [13] K.A. Hanner, A. Safari, R.E. Newnham, Runt, J Ferroelectrics 100 (1989) 255. [14] T. Furukawa, K. Fujino, E. Fukada, Japonese Journal of Applied Physics 15 (1976) 2119. [15] C.J. Dias, D.K. Das Gupta, IEEE Transactions on Dielectrics and Electrical Insulation
3 (1996) 706.
[16] J.F. Capsal, E. Dantras, L. Laffont, J. Dandurand, C. Lacabanne, Journal of Non- Crystalline Solids 356 (2010) 629.
[17] J.F. Capsal, C. Pousserot, E. Dantras, J. Dandurand, C. Lacabanne, Polymer 51 (2010) 5207.
[18] H.W. Starkweather Jr., G.E. Moore, J.E. Hansen, T.M. Roder, R.E. Brooks, Journal of Polymer Science 21 (1956) 189.
[19] S.G. Fritsch, M. Boulos, B. Durand, V. Bley, T. Lebey, Journal of the European Ceramic Society 25 (2005) 2749.
[20] J.F. Capsal, E. Dantras, J. Dandurand, C. Lacabanne, Journal of Non-Crystalline Solids 353 (2007) 4437.
[21] S. Havriliak, S. Negami, Polymer 8 (1967) 161.
[22] F. Kremer, A. Schönals, Broad Band Dielectric Spectroscopy, Springer, Berlin, 2003. [23] H.W. Starkweather, Macromolecules 14 (1981) 1277.
[24] D.A.G. Bruggeman, Annalen der Physik 24 (1935) 636. [25] E. Donth, Journal of Non-Cristalline solids 307 (2002) 364.
[26] A. Saiter, N. Delpouve, E. Dargent, J.M. Saiter, European Polymer Journal 43 (2007) 4675.
Fig. 11. Pre-exponential factor (τ0) versus enthalpy extract from elementary TSC
thermograms of α mode for PA11/BaTiO3700 nm composites with ϕ = 0%, 3%, 12% and
![Fig. 8. The null activation entropy dependence of the enthalpies [23]](https://thumb-eu.123doks.com/thumbv2/123doknet/3667547.108512/5.892.474.836.114.377/fig-null-activation-entropy-dependence-enthalpies.webp)