Lire
la
première partie
Chapter 6
Chapter
6
Optimization of Pore
Morphology of
Scaffolds for
Connective Tissue
Engineering
This chapter consist of two parts, first two PLAs and two PLGAs were foamed by using the wet and dry method techniques in order to see the difference in pore morphology, structure and anisotropy. The influence of scCO2 foaming parameters was studied in detail with respect to each polymer and process. The
effect of each process parameter was taken into account to analyze the scaffolds and optimize their porosity and equivalent pore diameter. The mechanical properties of the optimized foams were also tested. Second we will present the optimized foaming results obtained by adding surface modifier to the polymer by co-grinding to improve the surface adhesion of the blend foam. A focus on pore morphology and their characteristics will be emphasized as it plays an important role in cell seeding, differentiating and growth in the scaffold.
1 Optimization of PLA’s Foams Processed by Wet and Dry Methods
In this chapter, we have used PL,DLA (PABR L 68), PL,DLLA (Resomer®
LR 704), PLGA85:15
(DL-PLG), and PLGA50:50 (PDLG 5010). These polymers have been characterized in detail in chapter 5.
First, pellets prepared by both methods were foamed with supercritical fluid to make scaffolds. Secondly, a comparative study was made to analyze the porosity and pore morphology created by wet and dry method. In the first part, we will discuss the two PLAs in which, one is amorphous while the other is semi-crystalline.
1.1 Experimental Procedure
1.1.1 Preparation of Pellets by Wet and Dry Methods
A soluble solvent, acetone, was used to make a homogenous solution with polymer powders. Transparent solution was poured in petri dish of 7cm diameter. The solution was dried for 48 hrs and then pellets of 12mm diameter and ~1 − 1.2mm thickness was cut with die cutter. Further details of the wet
method pellet preparation are reported in chapter 4 section 1.5. In parallel pellets of 13 mm diameter and ~1.2 mm thickness were also prepared by dry method as described earlier in section 1.4, chapter 4.
1.1.2 Taguchi’ Design for Foaming
Taguchi’ design was considered for these experimentations. We have chosen L9 table. As a result,
4 process parameters were optimized: the pressure, the temperature, the time of saturation and the rate of depressurization. The domain of definition of this Taguchi design is presented in Table 6.1. A wide range of all the four parameters were kept in the initial plan.
Table 6.1: Initial Taguchi plans for scCO2 foaming of pellets prepared by wet and dry method.
Nr 1 2 3 4 5 6 7 8 9 Tsat ( o C) 40 40 40 45 45 45 50 50 50 Psat (bar) 100 200 300 100 200 300 100 200 300 tsat (min) 30 40 20 40 20 30 20 30 40 dP/dt (bar/s) 1 3 5 5 1 3 3 5 1
SEPAREX® SFC6 scCO2 laboratory plant was used for foaming scaffold during this
experimentation. As the pressure chamber capacity is 6 liters, multiple pellets were placed inside the chamber for one process condition. Single perforate plate was adopted for foaming process by placing 4 pellets (2 wet plus 2 dry) for one process condition.
1.2 P
L,DLA Foams Processed by Wet and Dry Methods: Initial Taguchi Plan
Foams of PL,DLA pellets, prepared by wet and dry methods, were produced by adapting initial
Taguchi plan. After making the dimensional observations for geometric porosity calculations, SEM analysis for all the foams was done. Four to six micrographs were taken for each foam at different magnifications at different positions on the sample.
The equivalent pore diameter obtained from SCION® Image analysis of the SEM micrographs and the geometric porosity calculated from the dimensional data of pellets and foams are reported on Table 6.2. The highlighted and underlined values in the table are the optimum values. SEM micrographs of PL,DLA
foams are presented in Figure 6.1. The process conditions for foams in the micrograph are saturation temperature, saturation pressure, saturation time and depressurization rate.
Table 6.2: PL,DLA foams pore data of wet and dry method by initial Taguchi’ plan.
PL,DLA
scCO2 Parameters Geometric
Porosity P (%)
Equivalent Pore Diameter
de (m)
Tsat Psat tsat dP/dt
(°C) (bar) (min) (bar/s) Wet Dry Wet Dry
P1 40 100 30 1 56.5 55.8 50 60 P2 40 200 40 3 59.1 63.3 15 40 P3 40 300 20 5 69.3 68.9 20 25 P4 45 100 40 5 63.5 83.6 25 65 P5 45 200 20 1 74.4 57.1 20 50 P6 45 300 30 3 75.2 59.5 10 80 P7 50 100 20 3 77.2 72.5 100 125 P8 50 200 30 5 91.6 57.8 10 50 P9 50 300 40 1 64.8 63.0 20 25
The pore diameter was heterogeneous (small and large) in the foams obtained hence the maginification was different for some of the foams. Higher and low magnification was done for foam
micrographs with small and large pore diameters. Most of the images presented in Figure 6.1 are of magnification 100× and 250×.
Wet Method Dry Method Wet Method Dry Method
Condition:01--200× [40 oC - 100 bars - 30 min - 1 bar/s]
Condition:01--100× [40 oC - 100 bars - 30 min - 1 bar/s]
Condition:02--250× [40 oC - 200 bars - 40 min - 3 bar/s]
Condition:02--100× [40 oC - 200 bars - 40 min - 3 bar/s]
Condition:03--100× [40 oC - 300 bars - 20 min - 5 bar/s]
Condition:03--100× [40 oC - 300 bars - 20 min - 5 bar/s]
Condition:04--250× [45 oC - 100 bars - 40 min - 5 bar/s]
Condition:04--100× [45 oC - 100 bars - 40 min - 5 bar/s]
Condition:05--100× [45 oC - 200 bars - 20 min - 1 bar/s]
Condition:05--50× [45 oC - 200 bars - 20 min - 1 bar/s]
Condition:06--100× [45 oC - 300 bars - 30 min - 3 bar/s]
Condition:06--100× [45 oC - 300 bars - 30 min - 3 bar/s]
Condition:07--100× [50 oC - 100 bars - 20 min - 3 bar/s]
Condition:07--50× [50 oC - 100 bars - 20 min - 3 bar/s]
Condition:08--100× [50 oC - 200 bars - 30 min - 5 bar/s]
Condition:08--100× [50 oC - 200 bars - 30 min - 5 bar/s]
Wet Method Dry Method
Condition:09--100× [50 oC - 300 bars - 40 min - 1 bar/s]
Condition:09--100× [50 oC - 300 bars - 40 min - 1 bar/s]
1.2.1 Effect of Process Parameters on Equivalent Pore Diameter (de)
The effect of each process parameter on equivalent pore diameter and porosity was calculated for both wet and dry methods. Figure 6.2 presents a comparison between average effect on the equivalent pore diameter for wet and dry methods.
Optimum Parameters : Taguchi Plan-I
Process Condition [Tsat-Psat-tsat-dP/dt]
Tsat (°C ) 40 45 50 Psat (bar) 10 0 200300 tsat ( min) 20 ' 30' 40' dP/d t (ba r/s) 1 3 5 de ( m) 0 20 40 60 80
Optimum Parameters : Taguchi Plan-I
Process Condition [Tsat-Psat-tsat-dP/dt]
Tsat ( °C) 40 45 50 Psat (bar) 10 0 200300 tsat (min ) 20' 30' 40' dP/d t (b ar/s ) 1 3 5 de ( m) 0 20 40 60 80 100
(A)-Foam processed by wet method. (B)-Foam processed by dry method.
Figure 6.2: Average effect of each parameter on equivalent pore diameter of PL,DLA foams.
From these graphs (cf. Figure 6.2-A and B), the optimized parameters on equivalent pore diameter for both methods are as follows.
Wet method: Tsat = 50oC, Psat = 100 bars, tsat = 20 min and dP/dt = 3 bar/s
Dry method: Tsat = 50oC, Psat = 100 bars, tsat = 20 min and dP/dt = 3 bar/s
The equivalent pore diameter of scaffolds is comparable between both methods (125 m for wet method and 100 m for dry method). Optimal conditions are same for both wet and dry methods.
1.2.2 Effect of Process Parameters on Geometric Porosity
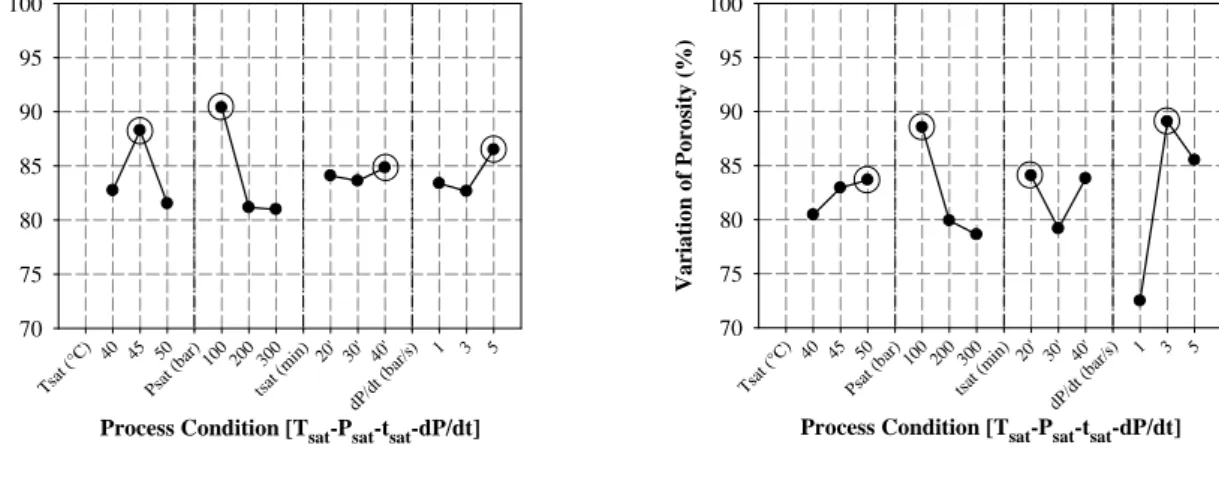
Taking into account the average effect of each process parameter on geometric porosity (cf. Figure 6.3-A and B), the optimized parameters for both methods are as follows.
Wet method: Tsat = 50 o
C, Psat = 200 bars, tsat = 30 min and dP/dt = 5 bar/s
Dry method: Tsat = 45 o
C, Psat = 100 bars, tsat = 40 min and dP/dt = 5 bar/s Optimum Parameters : Taguchi Plan-I
Process Condition [Tsat-Psat-tsat-dP/dt] Tsat (°C ) 40 45 50 Psat ( bar)100200300 tsat ( min ) 20' 30' 40' dP/dt (bar/ s) 1 3 5 Vari ation o f Poro si ty (%) 50 55 60 65 70 75
80 Optimum Parameters : Taguchi Plan-I
Process Condition [Tsat-Psat-tsat-dP/dt] Tsat (°C ) 40 45 50 Psat ( bar)100200300 tsat ( min ) 20' 30' 40' dP/dt (bar/ s) 1 3 5 Vari ation o f Poro si ty (%) 50 55 60 65 70 75 80
(A)-Foam processed by wet method. (B)-Foam processed by dry method.
For wet method foam maximum geometric porosity is 91.6%, while for dry method it is 83.6%. The optimized scCO2 foaming conditions for equivalent pore diameter and geometric porosity for both wet
and dry methods are different.
1.3 P
L,DLA Foams Processed by Wet and Dry Methods: Complementary Taguchi’
Plan
After analysis of the results of initial plan, it was decided to make a complementary plan with modified process parameters to obtain maximum pore size and porosity. Complementary plan with different process parameters is presented in Table 6.3. The saturation pressure range was narrowed and moved to lower values as high pressures generates small pore diameters, the saturation temperature was kept unchanged, the time of saturation range was also narrowed and moved to lower values. The rate of depressurization ranges was broaden to analyze the effect of high and low dP/dt rates on the equivalent pore diameter, porosity and pore morphology of PL,DLA foams.
Table 6.3: Complementary Taguchi plans for scCO2 foaming of pellets prepared by wet and dry method.
Nr 1 2 3 4 5 6 7 8 9 Tsat ( o C) 40 40 40 45 45 45 50 50 50 Psat (bar) 75 100 150 75 100 150 75 100 150 tsat (min) 20 25 15 25 15 20 15 20 25 dP/dt (bar/s) 6 2 4 4 6 2 2 4 6
The equivalent pore diameter obtained from SCION® image analysis of the SEM micrographs and the geometric porosity calculated from the dimensional data of pellets and foams are reported on
Table 6.4.
Table 6.4: PL,DLA foams pore data of wet and dry method by complementary Taguchi plan.
PL,DLA
scCO2 Parameters Geometric
Porosity P (%)
Equivalent Pore Diameter
de (m)
Tsat Psat tsat dP/dt
(°C) (bar) (min) (bar/s) Wet Dry Wet Dry
P1 40 75 20 6 51.4 84.3 5
40
P2 40 100 25 2 47.6 84.5 1550
P3 40 150 15 4 41.0 72.1 530
P4 45 75 25 4 51.4 78.0 540
P5 45 100 15 6 43.2 74.0 3030
P6 45 150 20 2 55.1 65.6 6065
P7 50 75 15 2 67.3 82.8 4050
P8 50 100 20 4 74.9 88.3 25100
P9 50 150 25 6 84.1 75.3 2540
SEM micrographs of PL,DLA foams obtained for complementary plan are presented in Figure 6.4.
Observing the micrographs of these foams and Compairing to the micrographs of initial Taguchi plan, we found that at low pressure and temperature ranges the pores generated are of very small diameter. At higher temperature ranges the pore diameter observed is higher. Comparaing the results of porosities of wet method
foams they are comparatively at lower side to the initial Taguchi plan values. Comparison of both plans will give a more comprehensive picture about the effect of each process parameter on the equivalent pore diameter and geometric porosity.
Wet Method Dry Method Wet Method Dry Method
Condition:01--250×
[40 oC - 75 bars - 20 min - 6 bar/s] [40 oC - 75 bars - 20 min - 6 bar/s] Condition:01--250× [40 oC - 100 bars - 25 min - 2 bar/s] Condition:02--250× [40 oC - 100 bars - 25 min - 2 bar/s] Condition:02--100×
Condition:03--250×
[40 oC - 150 bars - 15 min - 4 bar/s] [40 oC - 150 bars - 15 min - 4 bar/s] Condition:03--100× [40 oC - 75 bars - 25 min - 4 bar/s] Condition:04--100× [40 oC - 75 bars - 25 min - 4 bar/s] Condition:04--100×
Condition:05--250× [45 oC - 100 bars - 15 min - 6 bar/s]
Condition:05--100× [45 oC - 100 bars - 15 min - 6 bar/s]
Condition:06--100× [45 oC - 150 bars - 20 min - 2 bar/s]
Condition:06--100× [45 oC -150 bars -20 min - 2 bar/s]
Condition:07--100× [50 oC - 75 bars - 15 min - 2 bar/s]
Condition:07--50× [50 oC - 75 bars - 15 min - 2 bar/s]
Condition:08--250× [50 oC - 100 bars - 20 min - 4 bar/s]
Condition:08--100× [50 oC - 100 bars - 20 min - 4 bar/s]
Wet Method Dry Method
Condition:09--100× [50 oC - 150 bars - 20 min - 6 bar/s]
Condition:09--100× [50 oC - 150 bars - 20 min - 6 bar/s]
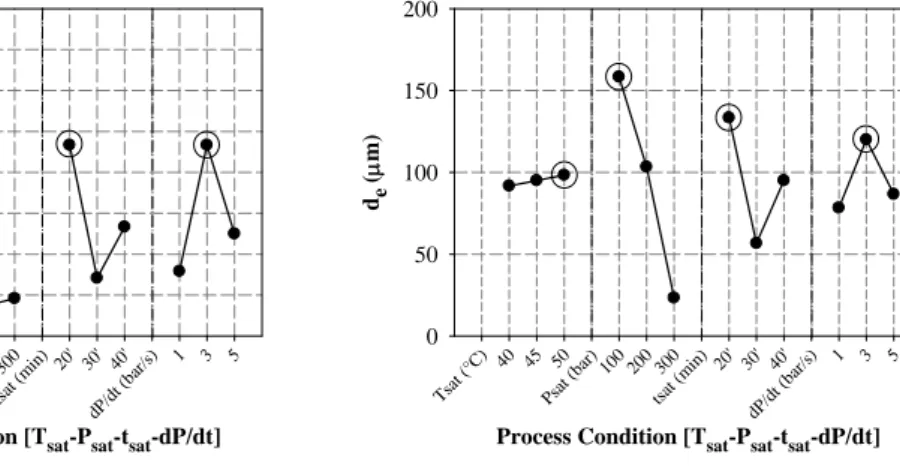
1.3.1 Effect of Process Parameters on Equivalent Pore Diameter (de)
Figure 6.5 presents a comparison between the average effect on equivalent pore diameter for wet and dry methods.
Optimum Parameters : Taguchi Plan-I
Process Condition [Tsat-Psat-tsat-dP/dt]
Tsat (° C) 40 45 50 Psat (bar ) 75 100150 tsat (m in) 15 20 25 dP/dt (bar /s) 2 4 6 de ( m) 5 10 15 20 25 30 35 40
Optimum Parameters : Taguchi Plan-II
Process Condition [Tsat-Psat-tsat-dP/dt]
Tsat (° C) 40 45 50 Psat (bar ) 75 100150 tsat (m in) 15 20 25 dP/dt (bar /s) 2 4 6 de ( m) 0 20 40 60 80
(A)-Foam processed by wet method. (B)-Foam processed by dry method
Figure 6.5: Average effect of each parameter on equivalent pore diameter of PL,DLA foams.
The maximum and optimized value of average equivalent pore diameter is 60 m for wet method and 100 m for dry one. The value is higher in dry than in wet method. The conditions are stated as follows.
Wet method: Tsat = 45oC, Psat = 150 bars, tsat = 20 min and dP/dt = 2 bar/s
Dry method: Tsat = 50oC, Psat = 100 bars, tsat = 20 min and dP/dt = 4 bar/s
1.3.2 Effect of Process Parameters on Geometric Porosity
The average effect of each process parameter on porosity (cf. Figure 6.6-A and B), is obtained for the following scCO2 process conditions.
Optimum Parameters : Taguchi Plan-I
Process Condition [Tsat-Psat-tsat-dP/dt] Tsat (°C ) 40 45 50 Psat ( bar) 75 100150 tsat ( min ) 15 20 25 dP/dt (bar/ s) 2 4 6 Vari ation o f Poro si ty (%) 30 40 50 60 70
80 Optimum Parameters : Taguchi Plan-I
Process Condition [Tsat-Psat-tsat-dP/dt] Tsat ( °C) 40 45 50 Psat (bar ) 75 100150 tsat ( min ) 15 20 25 dP/d t (b ar/s ) 2 4 6 Variatio n of P o rosity (% ) 50 60 70 80 90
(A)-Foam processed by wet method. (B)-Foam processed by dry method.
Figure 6.6: Average effect of each parameter on variation of geometric porosity of PL,DLA foams.
Wet method: Tsat = 50 o
C, Psat = 150 bars, tsat = 25 min and dP/dt = 6 bar/s
Dry method: Tsat = 50 o
The maximum values obtained are 84.1% and 88.3% for wet and dry method. The highest values of porosities for both methods are obtained at higher temperature and higher dP/dt values.
1.4 P
L,DLLA Foams Processed by Wet and Dry Methods: Initial Taguchi Plan
SEM micrographs of foams processed by initial plan are presented in Figure 6.7.
Wet Method Dry Method Wet Method Dry Method
Condition:01--100× [40 oC - 100 bars - 30 min - 1 bar/s]
Condition:01--250× [40 oC - 100 bars - 30 min - 1 bar/s]
Condition:02--100× [40 oC - 200 bars - 40 min - 3 bar/s]
Condition:02--500× [40 oC - 200 bars - 40 min - 3 bar/s]
Condition:03--250× [40 oC - 300 bars - 20 min - 5 bar/s]
Condition:03--250× [40 oC - 300 bars - 20 min - 5 bar/s]
Condition:04--100× [45 oC - 100 bars - 40 min - 5 bar/s]
Condition:04--100× [45 oC - 100 bars - 40 min - 5 bar/s]
Condition:05--250× [45 oC - 200 bars - 20 min - 1 bar/s]
Condition:05--250× [45 oC - 200 bars - 20 min - 1 bar/s]
Condition:06--250× [45 oC - 300 bars - 30 min - 3 bar/s]
Condition:06--250× [45 oC - 300 bars - 30 min - 3 bar/s]
Condition:07--100× [50 oC - 100 bars - 20 min - 3 bar/s]
Condition:07--100× [50 oC - 100 bars - 20 min - 3 bar/s]
Condition:08--250× [50 oC - 200 bars - 30 min - 5 bar/s]
Condition:08--250× [50 oC - 200 bars - 30 min - 5 bar/s]
Wet Method Dry Method
Condition:09--250× [50 oC - 300 bars - 40 min - 1 bar/s]
Condition:09--250× [50 oC - 300 bars - 40 min - 1 bar/s]
Figure 6.7: Micrographs of PL,DLLA foams processed by wet and dry methods.
The equivalent pore diameter obtained from SCION® image analysis on the SEM micrographs, and porosity data by geometric method from the dimensional observations of the PL,DLLA pellets and foams
are presented in Table 6.5.
Table 6.5: PL,DLLA foams pore data of wet and dry method by initial Taguchi’ plan.
PL,DLLA
scCO2 Parameters Geometric
Porosity P (%)
Equivalent Pore Diameter
de(m)
Tsat Psat tsat dP/dt
(°C) (bar) (min) (bar/s) Wet Dry Wet Dry
P1 40 100 30 1 80.0 63.8 15 30 P2 40 200 40 3 82.8 68.7 20 25 P3 40 300 20 5 83.1 65.4 5 15 P4 45 100 40 5 78.9 94.3 15 50 P5 45 200 20 1 85.8 66.9 20 35 P6 45 300 30 3 83.9 97.8 5 20 P7 50 100 20 3 82.7 85.4 30 75 P8 50 200 30 5 88.9 85.1 10 15 P9 50 300 40 1 82.3 83.0 5 20
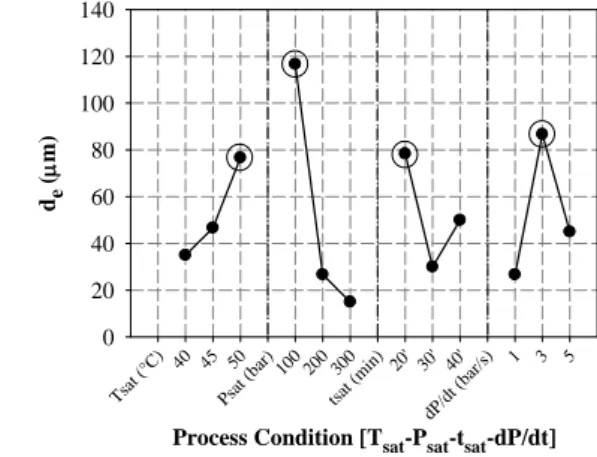
1.4.1 Effect of Process Parameters on Equivalent Pore Diameter (de)
The effect of each process parameter on equivalent pore diameter and porosity was calculated for both wet and dry methods and the graph is presented below.
Optimum Parameters : Taguchi Plan-I
Process Condition [Tsat-Psat-tsat-dP/dt]
Tsa t (°C ) 40 45 50 Psat ( bar)100200 300 tsat (m in) 20' 30' 40' dP/dt (b ar/s ) 1 3 5 de ( m) 0 5 10 15 20 25 30
Optimum Parameters : Taguchi Plan-I
Process Condition [Tsat-Psat-tsat-dP/dt]
Tsat (° C) 40 45 50 Psat (bar ) 100200300 tsat (m in) 20' 30' 40' dP/ dt (b ar/s ) 1 3 5 de ( m) 0 10 20 30 40 50 60
(A)-Foam processed by wet method. (B)-Foam processed by dry method.
Figure 6.8: Average effect of each parameter on equivalent pore diameter of PL,DLLA foams.
Figure 6.8 presents the comparison between the equivalent pore diameter effect for wet and dry methods. The optimized parameters obtained on the basis of equivalent pore diameter for both methods are stated as follows.
Wet method: Tsat = 50 o
C, Psat = 100 bars, tsat = 20 min and dP/dt = 3 bar/s
Dry method: Tsat = 50 o
C, Psat = 100 bars, tsat = 20 min and dP/dt = 3 bar/s
The value of equivalent pore diameter at these optimum conditions is 30 m for wet method and 75 m for dry method. For both the methods we can observe that optimum condition is same. However the pore diameter in wet method is even less than half of pore diameter in dry method. In wet method after being
saturated with scCO2 during the depressiurization step, desorption phenomenon is for a very short time in
the polymer leading in low pore diameter as compared to dry method.
1.4.2 Effect of Process Parameters on Geometric Porosity
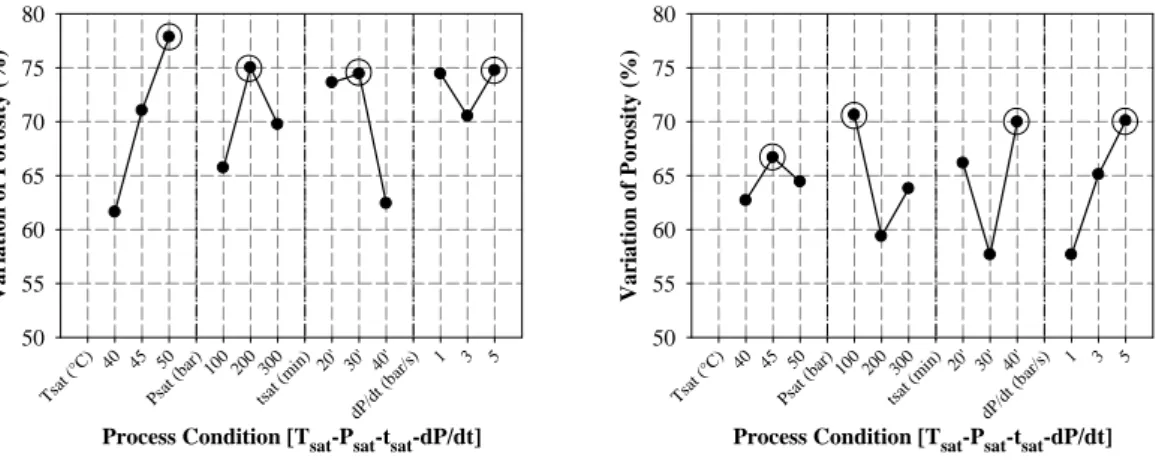
Taking into account the effect of each process parameter on geometric porosity (cf. Figure 6.9-A and B), the optimized parameters for both methods are as follows:
Wet method: Tsat = 50 o
C, Psat = 200 bars, tsat = 30 min and dP/dt = 5 bar/s
Dry method: Tsat = 45 o
C, Psat = 300 bars, tsat = 30 min and dP/dt = 3 bar/s
There is a difference in the optimized parameter for wet and dry methods. We obtain maximum foam porosity value of 88.9% and 97.8% for wet and dry method.
Optimum Parameters : Taguchi Plan-I
Process Condition [Tsat-Psat-tsat-dP/dt] Tsat (°C) 40 45 50 Psa t (bar ) 100200300 tsat (min ) 20' 30' 40' dP/d t (ba r/s) 1 3 5 Variatio n of P o rosity (% ) 70 75 80 85
90 Optimum Parameters : Taguchi Plan-I
Process Condition [Tsat-Psat-tsat-dP/dt]
Tsat (°C) 40 45 50 Psa t (bar ) 100200 300 tsat (min ) 20' 30' 40' dP/d t (ba r/s) 1 3 5 Va ria tio n of Po ro sity (%) 60 70 80 90 100
(A)-Foam processed by wet method. (B)-Foam processed by dry method.
Figure 6.9: Average effect of each parameter on variation of geometric porosity of PL,DLLA foams.
1.5 P
L,DLLA Foams Processed by Wet and Dry Methods: Complementary Taguchi’
Plan
The equivalent pore diameter obtained from SCION® image analysis on the SEM micrographs and geometric porosity calculated from the dimensional data of pellets and foams are reported on Table 6.6.
Table 6.6: PL,DLLA foams pore data of wet and dry method by complementary Taguchi plan.
PL,DLLA
scCO2 Parameters Geometric
Porosity P (%)
Equivalent Pore Diameter
de(m)
Tsat Psat tsat dP/dt
(°C) (bar) (min) (bar/s) Wet Dry Wet Dry
P1 40 75 20 6 70.8 55.7 5 50 P2 40 100 25 2 76.2 73.1 15 75 P3 40 150 15 4 83.2 65.4 25 30 P4 45 75 25 4 90.8 72.8 55 20 P5 45 100 15 6 58.2 56.1 10 5 P6 45 150 20 2 85.5 79.5 15 55 P7 50 75 15 2 83.8 63.2 80 40 P8 50 100 20 4 72.0 67.5 20 125 P9 50 150 25 6 78.2 53.3 40 75
It can be observed from the data of gemetric porosity that in wet method porosities of
foams obtained is higher than the porosities of foams in dry method. Where as the pore diameter
obtained is compareably higher in the dry method. In this plan the optimum conditions for both wet
and dry methods are different for equivalent pore diameter and porosity.
SEM micrographs of PL,DLLA foams processed by complementary plan are presented in Figure
6.10.
Wet Method Dry Method Wet Method Dry Method
Condition:01--250× [40 oC - 75 bars - 20 min - 6 bar/s]
Condition:01--250× [40 oC - 75 bars - 20 min - 6 bar/s]
Condition:02--250× [40 oC - 100 bars - 25 min - 2 bar/s]
Condition:02--250× [40 oC - 100 bars - 25 min - 2 bar/s]
Condition:03--250×
[40 oC - 150 bars - 15 min - 4 bar/s] [40 oC - 150 bars - 15 min - 4 bar/s] Condition:03--250× [40 oC - 75 bars - 25 min - 4 bar/s] Condition:04--250× [40 oC - 75 bars - 25 min - 4 bar/s] Condition:04--250×
Condition:05--100×
[45 oC - 100 bars - 15 min - 6 bar/s] [45 oC - 100 bars - 15 min - 6 bar/s] Condition:05--100× [45 oC - 150 bars - 20 min - 2 bar/s] Condition:06--250× [45 oC - 150 bars - 20 min - 2 bar/s] Condition:06--250×
Condition:07--100× [50 oC - 75 bars - 15 min - 2 bar/s]
Condition:07--100× [50 oC - 75 bars - 15 min - 2 bar/s]
Condition:08--100× [50 oC - 100 bars - 20 min - 4 bar/s]
Condition:08--50× [50 oC - 100 bars - 20 min - 4 bar/s]
Condition:09--100× [50 oC - 150 bars - 20 min - 6 bar/s]
Condition:09--100× [50 oC - 150 bars - 20 min - 6 bar/s]
Figure 6.10: Micrographs of PL,DLLA foams processed by wet and dry methods.
1.5.1 Effect of Process Parameters on Equivalent pore diameter (de)
Average effect of each process parameter on equivalent pore diameter and geometric porosity for both methods are presented in Figure 6.11 and Figure 6.12.
Optimum Parameters : Taguchi Plan-II
Process Condition [Tsat-Psat-tsat-dP/dt]
Tsa t (°C ) 40 45 50 Psat (b ar) 75 100 150 tsat (m in) 15 20 25 dP/dt (b ar/s ) 2 4 6 de ( m) 10 20 30 40 50
60 Optimum Parameters : Taguchi Plan-II
Process Condition [Tsat-Psat-tsat-dP/dt]
Tsat (°C ) 40 45 50 Psat ( bar) 75 100 150 tsat (m in) 15 20 25 dP/dt (bar /s) 2 4 6 de ( m) 0 20 40 60 80 100
(A)-Foam processed by wet method. (B)-Foam processed by dry method.
Figure 6.11: Average effect of each parameter on equivalent pore diameter of PL,DLLA foams.
From Figure 6.11 we deduced the scCO2 parameters which permit to optimize the average
equivalent pore diameter for both methods.
Wet method: Tsat = 50 oC, Psat = 75 bars, tsat = 15 min and dP/dt = 2 bar/s
Dry method: Tsat = 50oC, Psat = 100 bars, tsat = 20min and dP/dt = 4 bar/s
From these values we obtain equivalent pore diameter of 80 m for wet method and 125 m for dry method.
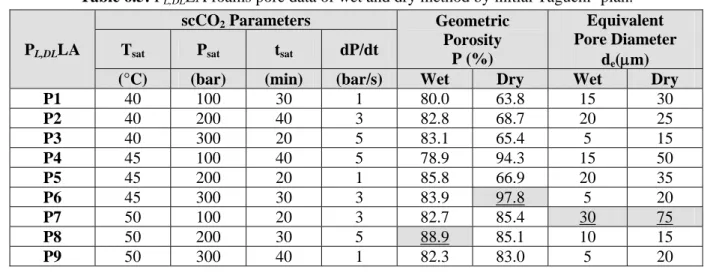
1.5.2 Effect of Process Parameters on Geometric Porosity
Taking into account the effect of each process parameter on geometric porosity (cf. Figure 6.12-A and B), 90.8%, for wet method and 79.5% for dry method foam porosity obtained at the following conditions.
Wet method: Tsat = 45 o
C, Psat = 75 bars, tsat = 25 min and dP/dt = 4 bar/s
Dry method: Tsat = 45 o
C, Psat = 150 bars, tsat = 20 min and dP/dt = 2 bar/s Optimum Parameters : Taguchi Plan-I
Process Condition [Tsat-Psat-tsat-dP/dt]
Tsat (°C ) 40 45 50 Psat ( bar) 75 100150 tsat ( min ) 15 20 25 dP/dt (bar/ s) 2 4 6 Vari ation o f Poro si ty (%) 65 70 75 80
85 Optimum Parameters : Taguchi Plan-I
Process Condition [Tsat-Psat-tsat-dP/dt]
Tsat (°C) 40 45 50 Psa t (bar ) 75 100150 tsat (min ) 15 20 25 dP/dt (bar /s) 2 4 6 Va ria tio n of Po ro sity (%) 50 55 60 65 70 75 80
(A)-Foam processed by wet method. (B)-Foam processed by dry method.
Figure 6.12: Average effect of each parameter on variation of porosity of PL,DLLA foams.
1.6 Comparison Between Both PLAs
The initial characterization gave the results that PL,DLA was amorphous and PL,DLLA was semi
crystalline with 12.4% crystallinity. The molecular weight for both polylactides was approximately equivalent (163,971 and 201,169 respectively), and Tgs are of the same range (55.6
o
C and 60.1oC respectively). So, crystallinity ratio is the factor that plays a major role on the geometric porosity and equivalent pore diameter of the foams processed. By blocking the diffusion of scCO2 crystallites decreases
the solubility of PLAs. The optimum results of both wet and dry methods for both polylactides are presented in Table 6.7 and Table 6.8 respectively.
Table 6.7: PL,DLA equivalent pore diameter and geometric porosity results for both methods and plans.
Wet Method Dry Method
Initial Taguchi Plan Initial Taguchi Plan
[50oC-100 bars-20 min-3 bar/s] de(m) 100 [50 o
C-100 bars-20 min-3 bar/s] de(m) 125
[50oC-200 bars-30 min-5 bar/s] P(%) 91.6 [45oC-100 bars-40 min-5 bar/s] P(%) 83.6 Complementary Taguchi Plan Complementary Taguchi Plan
[45oC-150 bars-20 min-2 bar/s] de(m) 60 [50 o
C-100 bars-20 min-4 bar/s] de(m) 100
[50oC-150 bars-25 min-6 bar/s] P(%) 84.1 [50oC-100 bars-20 min-4 bar/s] P(%) 88.3
Table 6.8: PL,DLLA equivalent pore diameter and geometric porosity results for both methods and plans.
Wet Method Dry Method
Initial Taguchi Plan Initial Taguchi Plan
[50oC-100 b rs-20 min-3 bar/s] de(m) 30 [50 o
C-100 b rs-20 min-3 bar/s] de(m) 75
[50oC-200 bars-30 min-5 bar/s] P(%) 88.9 [45oC-300 bars-30 min-3 bar/s] P(%) 97.8 Complementary Taguchi Plan Complementary Taguchi Plan
[50oC-75 bars-15 min-2 bar/s] de(m) 80 [50 o
C-100 bars-20 min-4 bar/s] de(m) 125
[45oC-75bars-25 min-4 bar/s] P(%) 90.8 [45oC-150 bars-20 min-2 bar/s] P(%) 79.5 The comparison of effective equivalent pore diameter and porosity variation for PL,DLA and
PL,DLLA for the initial Taguchi plan is presented in Figure 6.13. It is clear that foams of PL,DLA being
amorphous produced pores of larger diameter than PL,DLLA in both wet and dry method.
Optimum Parameters : Taguchi Plan-I
Process Condition [Tsat-Psat-tsat-dP/dt]
Tsat (°C ) 40 45 50 Psat (bar ) 100 200 300 tsat ( min) 20' 30' 40' dP/dt ( bar/s ) 1 3 5 P o re Diame ter d e ( m) 0 20 40 60 80 100 PL,DLA-Wet PL,DLLA-Wet PL,DLA-Dry
PL,DLLA-Dry Optimum Parameters : Taguchi Plan-I
Process Condition [Tsat-Psat-tsat-dP/dt]
Tsat (°C ) 40 45 50 Psat (bar)100 200 300 tsat ( min) 20' 30' 40' dP/dt (bar /s) 1 3 5 Va ri ati o n o f Po ro si ty (%) 50 60 70 80 90 PL,DLA-Wet PL,DLLA-Wet PL,DLA-Dry PL,DLLA-Dry
(A)- Equivalent pore diameter of foams. (B)- Geometric porosity of foams.
porosity of PL,DLA and PL,DLLA foams by wet and dry methods from initial Taguchi plan.
Figure 6.14 presents the comparison of effective equivalent pore diameter and porosity variation for PL,DLA and PL,DLLA for the complementary Taguchi plan. Again we see the same trend that foams of
PL,DLA being amorphous produced pores of larger diameter than PL,DLLA in both wet and dry pellet
preparation method. Also if the initial and complementary Taguchi plan are compared, foams of larger diameter and higher porosity are produced in PL,DLA foams in initial plan as compared to the PL,DLLA foams.
In complementary plan the phenomenon is unexpectedly reverse due to coalecence of pores. PL,DLA and
PL,DLLA in dry method produced larger pore diameter than wet method indicating that proper nucleation and
pore growth in dry method.
Optimum Parameters : Taguchi Plan-I
Process Condition [Tsat-Psat-tsat-dP/dt]
Tsat ( °C) 40 45 50 Psat (bar) 75100 150 tsat (min) 15 20 25 dP/dt (bar/s ) 2 4 6 Po re Di a m ete r d e ( m) 0 20 40 60 80 100 PL,DLA-Wet PL,DLLA-Wet PL,DLA-Dry
PL,DLLA-Dry Optimum Parameters : Taguchi Plan-I
Process Condition [Tsat-Psat-tsat-dP/dt]
Tsat (°C ) 40 45 50 Psat ( bar) 75 100 150 tsat ( min) 15 20 25 dP/d t (ba r/s) 2 4 6 Va ri at ion of Po ro sit y (%) 40 50 60 70 80 90 PL,DLA-Wet PL,DLLA-Wet PL,DLA-Dry PL,DLLA-Dry
(A)- Equivalent pore diameter of foams. (B)- Geometric porosity of foams.
Figure 6.14: Average effect of each parameter on variation of equivalent pore diameter and
porosity of PL,DLA and PL,DLLA foams by wet and dry methods from complementary Taguchi plan.
PL,DLLA though produced foam with high porosity but the equivalent pore diameter was very low.
The effect of each process parameter on equivalent pore diameter and porosity was calculated for both wet and dry methods. PL,DLA is an amorphous polymer with 12% D-Lactide, while PL,DLLA is a semi crystalline
with 12.4% crystallinity. Ma et al. [2010] concluded from the experiments that amorphous PLA was found to have a better CO2 absorption whereas the crystalline regions in L-PLA impede the penetration of CO2
molecule. The solubility of carbon dioxide in both polymers shows the same trend, increasing with pressure and decreasing with temperature. The possible explanation for this behaviour is that the presence of crystallites in semicrystalline PLA can restrict the chain mobility in the amorphous phase, acting as virtual crosslinks, thus reducing the volume that can be used for the penetrant to make a diffusional jump and also avoiding the swelling. Oliveira et al. [2006] made a study showing that the apparent Langmuir capacity is very large for amorphous PLA while in semi-crystalline PLA, it is almost negligible. Also, the apparent Langmuir capacity diminishes as temperature approaches the glass transition temperature. This observation is consistent with the fact that the Langmuir capacity is directly related to the effective free volume that tends to zero at Tg. These results show that the different content of L:D isomers in PLA does influence not
only the solubility but also the solubility mechanism.
The possible reason for generation of high porosity and low pore diameter in wet method as compared to the dry method can be that in wet method more CO2 is sorbed as the polymer is more elastic
due to the solvent. Then during the depressurization step CO2 is desorbed without resistance and there is not
Wet method can be applicable to the semi-crystalline polymers which are difficult at low tempeartures to be processed in dry state. The application of wet method process can be limited for medical application due to the presence of solvent traces in the final product, however it can be used for commercial purpose where foams of small diameters and high porosity is required.
2 Optimization of PLGA’s Foams by Wet and Dry Method.
2.1 PLGA
50:50Foams Processed by Wet and Dry Methods
Two poly(lactic-co-glycolic acids) were used to produce foams by wet and dry methods. The initial Taguchi’ plan has been used for these studies. The SEM micrographs of PLGA50:50 foams are
presented in Figure 6.15.
Wet Method Dry Method Wet Method Dry Method
Condition:01--200× [40 oC - 100 bars - 30 min - 1 bar/s]
Condition:01--100× [40 oC - 100 bars - 30 min - 1 bar/s]
Condition:02--500× [40 oC - 200 bars - 40 min - 3 bar/s]
Condition:02--500× [40 oC - 200 bars - 40 min - 3 bar/s]
Condition:03--500× [40 oC - 300 bars - 20 min - 5 bar/s]
Condition:03--500× [40 oC - 300 bars - 20 min - 5 bar/s]
Condition:04--100× [45 oC - 100 bars - 40 min - 5 bar/s]
Condition:04--100× [45 oC - 100 bars - 40 min - 5 bar/s]
Condition:05--250× [45 oC - 200 bars - 20 min - 1 bar/s]
Condition:05--250× [45 oC - 200 bars - 20 min - 1 bar/s]
Condition:06--250× [45 oC - 300 bars - 30 min - 3 bar/s]
Condition:06--250× [45 oC - 300 bars - 30 min - 3 bar/s]
Condition:07--150× [50 oC - 100 bars - 20 min - 3 bar/s]
Condition:07--50× [50 oC - 100 bars - 20 min - 3 bar/s]
Condition:08--500× [50 oC - 200 bars - 30 min - 5 bar/s]
Condition:08--500× [50 oC - 200 bars - 30 min - 5 bar/s]
Condition:09--500× [50 oC - 300 bar - 40 min - 1 bar/s]
Condition:09--500× [50 oC - 300 bar - 40 min - 1 bar/s]
Figure 6.15: Micrographs of PLGA50:50 foams processed by wet and dry methods.
The equivalent pore diameter obtained from SCION® image analysis of SEM micrographs of
PLGA50:50 foams and geometric porosity calculated from the pellet and foam dimensional data by geometric
method are presented in Table 6.9.
Table 6.9: PLGA50:50 foams pore data of wet and dry method by initial Taguchi plan.
PLGA50:50
scCO2 Parameters Geometric
Porosity P (%)
Equivalent Pore Diameter
de (m)
Tsat Psat tsat dP/dt
(°C) (bar) (min) (bar/s) Wet Dry Wet Dry
P1 40 100 30 1 87.6 73.6 40 50 P2 40 200 40 3 78.8 86.2 5 40 P3 40 300 20 5 81.8 81.6 10 15 P4 45 100 40 5 97.5 93.7 120 100 P5 45 200 20 1 84.4 72.4 15 20 P6 45 300 30 3 83.0 82.8 5 20 P7 50 100 20 3 86.1 98.3 150 200 P8 50 200 30 5 80.3 81.2 25 20 P9 50 300 40 1 78.2 71.5 15 10
2.1.1 Effect of Process Parameters on Equivalent Pore Diameter (de)
Effect of each process parameter on pore diameter for both methods is presented in Figure 6.16.
PLGA50:50 is copolymer with LA/GA ratio of 50/50 and contains D,Llactide.
Optimum Parameters : Taguchi Plan-I
Process Condition [Tsat-Psat-tsat-dP/dt] Tsa t (°C) 40 45 50 Psat (bar ) 100200 300 tsat (m in) 20' 30' 40' dP/d t (bar /s) 1 3 5 de ( m) 0 20 40 60 80 100 120
Optimum Parameters : Taguchi Plan-I
Process Condition [Tsat-Psat-tsat-dP/dt]
Tsat (° C) 40 45 50 Psat (b ar) 100 200300 tsat (m in) 20' 30' 40' dP/d t (b ar/s ) 1 3 5 de ( m) 0 20 40 60 80 100 120 140
(A)-Foam processed by wet method. (B)-Foam processed by dry method.
From Figure 6.16, we deduced the scCO2 parameters which permit to optimize the average
equivalent pore diameter for both methods. Wet method: Tsat = 50
o
C, Psat = 100 bars, tsat = 20 min and dP/dt =3 bar/s
Dry method: Tsat = 50 o
C, Psat = 100 bars, tsat = 20min and dP/dt = 3 bar/s
From these values we obtain equivalent pore diameter of 150 m for wet method and 200 m for dry method. For PLGA50:50 the pore diameter for wet and dry method have the same optimum condition. For
each condition the pore diameter for dry method is at higher values indicating that there was proper swelling and pore growth in saturated polymer in dry method, where as in wet method less resistance was offered by the saturated polymer during pore growth leading to low pore diameter.
2.1.2 Effect of Process Parameters on Geometric Porosity
The effect of each process parameter on geometric porosity is presented in Figure 6.17. The maximum value of geometric porosity for wet and dry methods is 97.5% and 98.3%. The optimized parameters for both methods are as follows.
Wet method: Tsat = 45 o
C, Psat = 100 bars, tsat = 40 min and dP/dt = 5 bar/s
Dry method: Tsat = 50 o
C, Psat = 100 bars, tsat = 20 min and dP/dt = 3 bar/s Optimum Parameters : Taguchi Plan-I
Process Condition [Tsat-Psat-tsat-dP/dt] Tsat (°C) 40 45 50 Psa t (bar ) 100200 300 tsat (m in) 20' 30' 40' dP/d t (ba r/s) 1 3 5 Va ri a ti o n of Po ro si ty (%) 70 75 80 85 90 95
100 Optimum Parameters : Taguchi Plan-I
Process Condition [Tsat-Psat-tsat-dP/dt] Tsat (°C) 40 45 50 Psat (bar ) 100 200300 tsat (m in) 20' 30' 40' dP/d t (bar /s) 1 3 5 Variatio n of P oro sity (% ) 70 75 80 85 90 95 100
(A)-Foam processed by wet method. (B)-Foam processed by dry method.
Figure 6.17: Average effect of each parameter on variation of geometric porosity of PLGA50:50 foams.
2.2 PLGA
50:50Foams by Wet and Dry Methods by Complementary Taguchi’ Plan
The complementary Taguchi plan followed for the processing of foams is presented in Table 6.10. The equivalent pore diameter obtained from SCION® image analysis of the SEM micrographs and geometric porosity calculated from the dimensional data of pellets and foams are reported on Table 6.10.
Table 6.10: PLGA50:50 foams pore data of wet and dry method by complementary Taguchi plan.
PLGA50:50 sc CO2 Parameters Geometric Porosity P (%) Equivalent Pore Diameter de (m)
Tsat Psat tsat dP/dt
(°C) (bar) (min) (bar/s) Wet Dry Wet Dry
P1 40 75 20 6 85.1 87.5 40 60
P2 40 100 25 2 92.8 81.7 80 100
P3 40 150 15 4 78.1 81.4 70 60
P5 45 100 15 6 95.2 94.3 50 75
P6 45 150 20 2 88.0 77.6 30 40
P7 50 75 15 2 83.4 71.4 125 200
P8 50 100 20 4 82.3 79.4 60 250
P9 50 150 25 6 87.8 82.6 175 60
In the complementary Taguchi plan the porosities of the foams obtained in most of the conditions are above 80%. In the initial Taguchi plan porosities were at higher value while porosity was not too high. The results of pore diameter comparable to initial Taguchi plans are on higher. It can also be revealed from the data that at higher pressures, higher dP/dt and at low temperature the pore size obtained is small.
SEM micrographs of PLGA50:50 wet and dry method foams processed by following complementary Taguchi
plan are presented in Figure 6.18.
Wet Method Dry Method Wet Method Dry Method
Condition:01--200× [40 oC - 75 bars - 20 min - 6 bar/s]
Condition:01--250× [40 oC - 75 bars - 20 min - 6 bar/s]
Condition:02--250× [40 oC - 100 bars - 25 min - 2 bar/s]
Condition:02--100× [40 oC - 100 bars - 25 min - 2 bar/s]
Condition:03--250× [40 oC - 150 bars - 15 min - 4 bar/s]
Condition:03--250× [40 oC - 150 bars - 15 min - 4 bar/s]
Condition:04--125× [40 oC - 75 bars - 25 min - 4 bar/s]
Condition:04--50× [40 oC - 75 bars - 25 min - 4 bar/s]
Condition:05--250× [45 oC - 100 bars - 15 min - 6 bar/s]
Condition:05--100× [45 oC - 100 bars - 15 min - 6 bar/s]
Condition:06--100× [45 oC - 150 bars - 20 min - 2 bar/s]
Condition:06--250× [45 oC - 150 bars - 20 min - 2 bar/s]
Condition:07--100×
Wet Method Dry Method
Condition:09--100× [50 oC - 150 bars - 20 min - 6 bar/s]
Condition:09--250× [50 oC - 150 bars - 20 min - 6 bar/s]
Figure 6.18: Micrographs of PLGA50:50 foams processed by wet and dry methods.
2.2.1 Effect of Process Parameters on Equivalent Pore Diameter (de)
The effect of each process parameter on pore diameter and porosity for both methods is presented in Figure 6.19.
Optimum Parameters : Taguchi Plan-II
Process Condition [Tsat-Psat-tsat-dP/dt]
Tsat (° C) 40 45 50 Psat (b ar) 75 100150 tsat (m in) 15 20 25 dP/d t (b ar/s ) 2 4 6 de ( m) 20 40 60 80 100 120 140
Optimum Parameters : Taguchi Plan-II
Process Condition [Tsat-Psat-tsat-dP/dt]
Tsat (° C) 40 45 50 Psa t (ba r) 75100 150 tsat (m in) 15 20 25 dP/d t (bar /s) 2 4 6 de ( m) 0 50 100 150 200
(A)-Foam processed by wet method. (B)-Foam processed by dry method.
Figure 6.19: Average effect of each parameter on equivalent pore diameter of PLGA50:50 foams.
From Figure 6.19, we deduced the scCO2 parameters which permit to optimize the average
equivalent pore diameter for both methods.
Wet method: Tsat = 50 oC, Psat = 150 bars, tsat = 25 min and dP/dt = 6 bar/s
Dry method: Tsat = 50oC, Psat = 100 bars, tsat = 20min and dP/dt = 4 bar/s
At optimized conditions we obtain equivalent pore diameter of 175m for wet method and 250 m for dry method.
2.2.2 Effect of Process Parameters on Geometric Porosity
Maximum value for wet and dry method is 95.2% and 94.3%. Taking into account the effect of each process parameter on geometric porosity (cf. Figure 6.20), we obtain optimized conditions as follows,
Wet method: Tsat = 45 o
C, Psat = 100 bars, tsat = 15 min and dP/dt = 6 bar/s
Dry method: Tsat = 45 o
Optimum Parameters : Taguchi Plan-I
Process Condition [Tsat-Psat-tsat-dP/dt]
Tsat (°C) 40 45 50 Psat (bar ) 75 100150 tsat ( min ) 15 20 25 dP/ dt (b ar/s ) 2 4 6 Vari ati o n of P o rosi ty (%) 70 75 80 85 90 95
100 Optimum Parameters : Taguchi Plan-I
Process Condition [Tsat-Psat-tsat-dP/dt]
Tsat (°C) 40 45 50 Psa t (b ar) 75 100150 tsat (mi n) 15 20 25 dP/ dt (b ar/s ) 2 4 6 Va ria tio n of Po ro sity (%) 70 75 80 85 90
(A)-Foam processed by wet method. (B)-Foam processed by dry method.
Figure 6.20: Average effect of each parameter on variation of porosity of PLGA50:50 foams.
2.3 PLGA
85:15Foams Processed by Wet and Dry Methods: Initial Taguchi’ Plan
The second poly(lactic-co-glycolide) used was PLGA85:15.The SEM micrographs of PLGA50:50
foams are presented in Figure 6.21.
Wet Method Dry Method Wet Method Dry Method
Condition:01--100× [40 oC - 100 bars - 30 min - 1 bar/s]
Condition:01--100× [40 oC - 100 bars - 30 min - 1 bar/s]
Condition:02--100× [40 oC - 200 bars - 40 min - 3 bar/s]
Condition:02--100× [40 oC - 200 bars - 40 min - 3 bar/s]
Condition:03--100× [40 oC - 300 bars - 20 min - 5 bar/s]
Condition:03--100× [40 oC - 300 bars - 20 min - 5 bar/s]
Condition:04--100× [45 oC - 100 bars - 40 min - 5 bar/s]
Condition:04--100× [45 oC - 100 bars - 40 min - 5 bar/s]
Condition:05--250× [45 oC - 200 bars - 20 min - 1 bar/s]
Condition:05--100× [45 oC - 200 bars - 20 min - 1 bar/s]
Condition:06--250× [45 oC - 300 bars - 30 min - 3 bar/s]
Condition:06--250× [45 oC - 300 bars - 30 min - 3 bar/s]
Condition:07--75× [50 oC - 100 bars - 20 min - 3 bar/s]
Condition:07--50× [50 oC - 100 bars - 20 min - 3 bar/s]
Condition:08--250× [50 oC - 200 bars - 30 min - 5 bar/s]
Condition:08--250× [50 oC - 200 bars - 30 min - 5 bar/s]
Wet Method Dry Method
Condition:09--250× [50 oC - 300 bars - 40 min - 1 bar/s]
Condition:09--250× [50 oC - 300 bars - 40 min - 1 bar/s]
Figure 6.21: Micrographs of PLGA85:15 foams processed by wet and dry methods.
The equivalent pore diameter obtained from SCION® image analysis of the SEM micrographs, porosity data by geometric method for PLGA85:15 foams are presented in
Table 6.11.
Table 6.11: PLGA85:15 foams pore data of wet and dry method by initial Taguchi plan.
PLGA50:50
scCO2 Parameters Geometric
Porosity P (%)
Equivalent Pore Diameter
de (m)
Tsat Psat tsat dP/dt
(°C) (bar) (min) (bar/s) Wet Dry Wet Dry
P1 40 100 30 1 94.5 82.4 50 100 P2 40 200 40 3 69.6 82.0 10 125 P3 40 300 20 5 72.0 81.9 10 50 P4 45 100 40 5 93.7 84.9 125 150 P5 45 200 20 1 71.0 88.4 20 125 P6 45 300 30 3 84.0 80.2 20 10 P7 50 100 20 3 96.2 94.2 250 225 P8 50 200 30 5 72.9 86.3 15 60 P9 50 300 40 1 81.8 83.1 25 10
The corresponding SEM micrographs for PLGA85:15 foams are presented in Figure 6.21.
2.3.1 Effect of Process Parameters on Equivalent Pore Diameter (de)
Effect of each process parameter on pore diameter and porosity for both methods is presented in Figure 6.22.
Optimum Parameters : Taguchi Plan-I
Process Condition [Tsat-Psat-tsat-dP/dt]
Tsat (° C) 40 45 50 Psa t (ba r) 100200 300 tsat (m in) 20' 30' 40' dP/d t (bar /s) 1 3 5 de ( m) 0 20 40 60 80 100 120 140 160
Optimum Parameters :Taguchi Plan-I
Process Condition [Tsat-Psat-tsat-dP/dt]
Tsat (° C) 40 45 50 Psat (b ar) 100 200300 tsat (m in) 20' 30' 40' dP/d t (b ar/s ) 1 3 5 de ( m) 0 50 100 150 200
(A)-Foams processed by wet method (B)-Foams processed by dry method
Figure 6.22: Average effect of each parameter on equivalent pore diameter of PLGA85:15 foams.
From Figure 6.22, we deduced the scCO2 parameters which permit to optimize the average
equivalent pore diameter for both methods. Wet method: Tsat = 50
o
C, Psat = 100 bars, tsat = 20 min and dP/dt =3 bar/s
Dry method: Tsat = 50 o
C, Psat = 100 bars, tsat = 20 min and dP/dt = 3 bar/s
From these conditions, we obtain equivalent pore diameter of 250m for wet method and 225m for dry method.
2.3.2 Effect of Process Parameters on Geometric Porosity
Taking into account the effect of each process parameter on geometric porosity (cf. Figure 6.23), the wet and dry method foam porosity optimum are at the following conditions:
Wet method: Tsat = 50 o
C, Psat = 100 bars, tsat = 20 min and dP/dt = 3 bar/s
Dry method: Tsat = 50 o
C, Psat = 100bars, tsat = 20 min and dP/dt = 3 bar/s Optimum Parameters : Taguchi Plan-I
Process Condition [Tsat-Psat-tsat-dP/dt] Tsa t (°C ) 40 45 50 Psa t (bar ) 100200 300 tsat (min) 20 ' 30' 40' dP/d t (ba r/s) 1 3 5 Var iat io n of Po ro si ty ( % ) 60 70 80 90 100
Optimum Parameters : Taguchi Plan-I
Process Condition [Tsat-Psat-tsat-dP/dt] Tsa t (°C ) 40 45 50 Psat (bar) 100 200 300 tsat (mi n) 20' 30' 40' dP/d t (bar /s) 1 3 5 Var iatio n of P o ro sity ( % ) 80 82 84 86 88 90
(A)-Foams processed by wet method. (B)-Foams processed by dry method.
From these conditions, we obtain optimum porosity 96.2% and 94.2% for wet and dry method.
PLGA
85:15produced pores of maximum diameters and maximum porosity for both the method at
the same comndition. The results of wet method are slightly at higher side than the dry method.
2.4 PLGA
85:15Foams by Wet and Dry Methods by Complementary Taguchi Plan
The equivalent pore diameter obtained from SCION® image analysis of the SEM micrographs, porosity data by geometric method using the pellet and PLGA50:50 foams dimensional data are presented in
Table 6.12.
Table 6.12: PLGA85:15 foams pore data of wet and dry method by complementary Taguchi plan.
PLGA50:50 sc CO2 Parameters Geometric Porosity P (%) Equivalent Pore Diameter de (m)
Tsat Psat tsat dP/dt
(°C) (bar) (min) (bar/s) Wet Dry Wet Dry
P1 40 75 20 6 95.8 88.2 50 250 P2 40 100 25 2 95.0 86.4 100 200 P3 40 150 15 4 86.8 81.6 15 175 P4 45 75 25 4 94.2 88.2 100 350 P5 45 100 15 6 73.8 93.5 20 20 P6 45 150 20 2 88.9 96.1 25 500 P7 50 75 15 2 74.8 84.8 400 60 P8 50 100 20 4 89.3 85.1 75 225 P9 50 150 25 6 83.6 90.7 50 80
The corresponding SEM micrographs for PLGA85:15 foams are presented in Figure 6.24.
Wet Method Dry Method Wet Method Dry Method
Condition:01--100× [40 oC - 75 bars - 20 min - 6 bar/s]
Condition:01--100× [40 oC - 75 bars - 20 min - 6 bar/s]
Condition:02--100× [40 oC - 100 bars - 25 min - 2 bar/s]
Condition:02--200× [40 oC - 100 bars - 25 min - 2 bar/s]
Condition:03--250× [40 oC - 150 bars - 15 min - 4 bar/s]
Condition:03--100× [40 oC - 150 bars - 15 min - 4 bar/s]
Condition:04--100× [40 oC - 75 bars - 25 min - 4 bar/s]
Condition:04--50× [40 oC - 75 bars - 25 min - 4 bar/s]
Condition:05--250× [45 oC - 100 bars - 15 min - 6 bar/s]
Condition:05--250× [45 oC - 100 bars - 15 min - 6 bar/s]
Condition:06--250× [45 oC - 150 bars - 20 min - 2 bar/s]
Condition:06--50× [45 oC - 150 bars - 20 min - 2 bar/s]
Condition:07--50× [50 oC - 75 bars - 15 min - 2 bar/s]
Condition:07--100× [50 oC - 75 bars - 15 min - 2 bar/s]
Condition:08--100× [50 oC - 100 bars - 20 min - 4 bar/s]
Condition:08--50× [50 oC - 100 bars - 20 min - 4 bar/s]
Dry Method Wet Method
Condition:09--100× [50 oC - 150 bars - 20 min - 6 bar/s]
Condition:09--100× [50 oC - 150 bars - 20 min - 6 bar/s]
Figure 6.24: Micrographs of PLGA85:15 foams processed by wet and dry methods.
2.4.1 Effect of Process Parameters on Equivalent Pore Diameter (de)
Effect of each process parameter on pore diameter and porosity for both methods is presented in Figure 6.25.
Optimum Parameters:Plan-II
Process Condition [Tsat-Psat-tsat-dP/dt]
Tsat (° C) 40 45 50 Psat (b ar) 75 100150 tsat (m in) 15 20 25 dP/d t (b ar/s ) 2 4 6 de ( m) 20 40 60 80 100 120 140 160 180 200
Optimum Parameters:Taguchi Plan-II
Process Condition [Tsat-Psat-tsat-dP/dt]
Tsat (° C) 40 45 50 Psa t (ba r) 75100 150 tsat (m in) 15 20 25 dP/d t (bar /s) 2 4 6 de ( m) 0 100 200 300
(A)-Foams processed by wet method. (B)-Foams processed by dry method.
From Figure 6.25, we deduced the scCO2 parameters which permit to optimize the average
equivalent pore diameter for both methods. Wet method: Tsat = 50
o
C, Psat = 75 bars, tsat = 15 min and dP/dt =2 bar/s
Dry method: Tsat = 45 o
C, Psat = 150 bars, tsat = 20min and dP/dt = 2 bar/s
From these values we obtain equivalent pore diameter of 400 and 500 m for wet and dry method.
2.4.2 Effect of Process Parameters on Geometric Porosity
The maximum porosity for wet and dry method obtained is 95.8 and 96.1%. Taking into account the effect of each process parameter on geometric porosity (cf. Figure 6.26-A and B), for wet and methods foam porosity have optimum values at the following conditions.
Wet method: Tsat = 40 o
C, Psat = 75 bars, tsat = 20 min and dP/dt = 6 bar/s
Dry method: Tsat = 45 o
C, Psat = 150 bars, tsat = 20 min and dP/dt = 2 bar/s Optimum Parameters : Taguchi Plan-I
Process Condition [Tsat-Psat-tsat-dP/dt] Tsat (°C ) 40 45 50 Psa t (bar ) 75 100 150 tsat (mi n) 15 20 25 dP/d t (ba r/s) 2 4 6 Variatio n of P oro sity (% ) 70 75 80 85 90 95
100 Optimum Parameters : Taguchi Plan-I
Process Condition [Tsat-Psat-tsat-dP/dt]
Tsat (°C) 40 45 50 Psa t (ba r) 75100 150 tsat (min ) 15 20 25 dP/d t (ba r/s) 2 4 6 V a riation o f Po rosity (%) 80 85 90 95 100
(A)-Foams processed by wet method. (B)-Foams processed by dry method.
Figure 6.26: Average effect of each parameter on variation of porosity of PLGA85:15 foams.
2.5 Comparison Between Both PLGAs
Recalling the characteristics of PLGA50:50 and PLGA85:15, both contain D,L- Lactide and glycolic
acid in the ratio 50:50 and 85:15 respectively. Both poly(lactic-co-glycolic) acids are amorphous. The molecular weight for both polymers is 28,494 and 18,848, while Tg is 49.1
o
C and 53.1oC respectively. Apart from the process parameters, molecular weight, Tg and LA/GA ratio of the polymer are major factors that
affect on the porosity and pore diameter of the foams obtained.
The optimum results of both wet and dry methods for both poly(lactic-co-glycolic) acids are presented in Table 6.13 and Table 6.14 respectively.
Table 6.13: PLGA50:50 equivalent pore diameter and porosity results for both methods and plans.
Wet Method Dry Method
Initial Taguchi Plan Initial Taguchi Plan
[50oC-100 bars-20 min-3 bar/s] de(m) 150 [50 o
C-100 bars-20 min-3 bar/s] de(m) 200
[45oC-100 bars-40 min-5 bar/s] P(%) 97.5 [50oC-100 bars-20 min-3 bar/s] P(%) 98.3 Complementary Taguchi Plan Complementary Taguchi Plan
[50oC-150 bars-25 min-6 bar/s] de(m) 175 [50 o
C-100 bars-20 min-4 bar/s] de(m) 250
In both the plans, we have seen that equivalent pore diameters of dry method were higher than the wet method although the porosity was in the same ranges. These process conditions can be further optimized by complementary experiments. Moreover the optimized results of equivalent pore diameters for this polymer are obtained at a temperature close to the Tg indicating that at this temperature there was complete
sorption, swelling and then pore growth.
Table 6.14 depicts that PLGA85:15 equivalent pore diameters are higher for dry pellet preparation
in both the Taguchi plans. Moreover, in the complementary Taguchi plan, we have achieved optimized value for the equivalent pore diameter and porosity (de = 500m and porosity = 96.1%) at the same process
conditions.
Table 6.14: PLGA85:15 equivalent pore diameter and porosity results for both methods and plans.
Wet Method Dry Method
Initial Taguchi Plan Initial Taguchi Plan
[50oC-100 bars-20 min-3 bar/s] de(m) 250 [50 o
C-100 bars-20 min-3 bar/s] de(m) 225
[50oC-100 bars-20 min-3 bar/s] P(%) 96.2 [50oC-100 bars-20 min-3 bar/s] P(%) 94.2 Complementary Taguchi Plan Complementary Taguchi Plan
[50oC-75 bars-15 min-2 bar/s] de(m) 400 [45 o
C-150 bars-20 min-2 bar/s] de(m) 500
[40oC-75bars-20 min-6 bar/s] P(%) 95.8 [45oC-150 bars-20 min-2 bar/s] P(%) 96.1 The comparison of effective equivalent pore diameter and porosity variation for PLGA50:50 and
PLGA85:15 for the initial Taguchi plan are presented in Figure 6.27. It is clear that foams of PLGA85:15
produced pores of larger diameter than PLGA50:50 in both wet and dry pellet preparation method.As LA/GA
ratio is higher in PLGA85:15 comparable to PLGA50:50, due to this fact the earlier polymer produced pores of
larger diameter. We can also see that increasing the saturation pressure decreases the pore diameter, while increasing the temperature and decreasing the dP/dt increases the pore diameter. However, the optimum dP/dt is mostly 2 or 3bar/s.
From the point of view of posrosity for both the polymers, it is always at higher side in wet method. However, the morphology of the pores in the wet method is hetrogeneous, irregular and elongated.
Optimum Parameters : Taguchi Plan-I
Process Condition [Tsat-Psat-tsat-dP/dt]
Tsat ( °C) 40 45 50 Psat (bar)100 200 300 tsat (min) 20' 30' 40' dP/dt (bar/s ) 1 3 5 Po re Di a m ete r d e ( m) 0 20 40 60 80 100 120 140 160 180 PLGA50:50-Wet PLGA85:15-Wet PLGA50:50-Dry
PLGA85:15-Dry Optimum Parameters : Taguchi Plan-I
Process Condition [Tsat-Psat-tsat-dP/dt]
Tsat (°C) 40 45 50 Psat (bar)100 200 300 tsat (min) 20' 30' 40' dP/dt (bar/s ) 1 3 5 Va riatio n of Poro sity (% ) 50 60 70 80 90 100 PLGA50:50-Wet PLGA85:15-Wet PLGA50:50-Dry PLGA85:15-Dry
(A)- Equivalent pore diameter of foams. (B)- Geometric porosity of foams.
Figure 6.27: Average effect of each parameter on variation of equivalent pore diameter and
porosity of PLGA50:50 and PLGA85:15 foams by wet and dry method for initial Taguchi plan.
Figure 6.28 presents the comparison of effective equivalent pore diameter and porosity variation for PLGA50:50 and PLGA85:15 for the complementary Taguchi plan. One can observe that foams of PLGA85:15
produced pores of larger diameter than PLGA50:50 in both wet and dry method. Also if the two Taguchi plan
are compared, foams of larger diameter and higher porosity (PLGA85:15 foams de~500m and porosity
96.1%) were produced in the complementary Taguchi plan as compared to initial Taguchi plan (PLGA85:15
foams de~250m and porosity 93.7%).
Optimum Parameters : Taguchi Plan-I
Process Condition [Tsat-Psat-tsat-dP/dt]
Tsat ( °C) 40 45 50 Psat (bar) 75100 150 tsat (min) 15 20 25 dP/dt (ba r/s) 2 4 6 P o re D iamete r de ( m) 0 100 200 300 PLGA50:50-Wet PLGA85:15-Wet PLGA50:50-Dry
PLGA85:15-Dry Optimum Parameters : Taguchi Plan-I
Process Condition [Tsat-Psat-tsat-dP/dt]
Tsat (°C ) 40 45 50 Psa t (ba r) 75100 150 tsat ( min ) 15 20 25 dP/dt ( bar/s ) 2 4 6 Var iation of Por o sity ( % ) 70 75 80 85 90 95 100 PLGA50:50-Wet PLGA85:15-Wet PLGA50:50-Dry PLGA85:15-Dry
(A)-Equivalent pore diameter of foams. (B)-Geometric porosity of foams.
Figure 6.28: Average effect of each parameter on variation of equivalent pore diameter and
porosity of PLGA50:50 and PLGA85:15 foams for complementary Taguchi plan.
LA/GA ratio of a PLGA co-polymer is an important parameter to control the pore diameter in a foaming process. Our previous experimental study depicts that the solubility of CO2 into the polymer
increases while the LA content increases in a PLGA co-polymer. The presence of an extra apolar CH3
methyl group in LA than GA explains this behaviour [Liu and Tomasko, 2007b]. Secondly the molecular weight of PLGA50:50 is higher than that of PLGA85:15, which is also a reason of low pore diameter for
PLGA50:50 foams. Glass transition temperature of PLGA50:50 < PLGA85:15 as the Tg also effect the solubility
of CO2 in polymer, ultimately affecting the porosity and pore diameter.
2.6 Pore Morphology and Anisotropy of Foams by Both Methods
The design and engineering of suitable biodegradable scaffolds are central to the field of tissue engineering and organ regeneration. Parallel fabrication strategies have also been improved and developed to improve and control biocompatibility, pore size, porosity, and pore connectivity [Murphy et al., 2002].
In tissue engineering, a wide range of pore size is required depending upon the application and organ such that a minimum pore size of 100 m was required to allow cell tissue ingrowth in scaffolds. Further investigations were carried out to understand the pore size requirement for bone tissue engineering. Although the optimal pore size varied with scaffold material and other parameters, such as tortuosity, the general consensus is that larger pore sizes (e.g., 100 m) may favor cell growth [Karageorgiou and
Kaplan, 2005; Tsuruga et al., 1997].
Cell transport and vascularization as a result of scaffold pore size can also affect the tissue types and tissue formation process in scaffolds. In addition to pore size, cell transport within a scaffold such as diffusion, attachment, and migration are controlled by porosity (the fraction of pore volume), pore interconnectivity, and available surface area in scaffolds. While a high porosity is often desired, it is inversely related to the surface area available for cell attachment in 3D scaffolds. Achieving an optimal cell density in scaffolds therefore necessitates a high surface-area-to-volume ratio. In order to facilitate the
transport of cells and bioactive chemicals, scaffolds may also need to have pores at both macro and micro scales, features that may be difficult to obtain via traditional scaffold fabrication techniques, such as particle leaching and phase separation. Studies have been carried out to compare scaffolds processed by controlled processes with those containing irregular structures fabricated by conventional methods.
In the experimentation of scaffold obtained by wet and dry method, we achieved all the possible minimum requirements of a good scaffold. As example PLGA50:50 scaffold is presented in Figure 6.29.
Figure 6.29: PLGA50:50 scaffold pore morphology with detail inside view obtained by dry method and foams
processed at 50oC-150 bars-25 min-6 bar/s.
A global view of the cross sectional area is shown, it is quite evident that the entire scaffold skeletal structure was homogeneous. The external skin of the scaffold varies upon the process conditions, anyhow the range was 5-15 m and it has patches of pores on the entire surface. The internal surface of the pore are also rough, to enhance surface wettability and possibly the potential for increased cellular adhesion and proliferation. Reports in the literature have shown that cellular adhesion and proliferation are closely dependent on the topographical nature of the biomaterial surface [Brett et al., 2004]. Studies have shown that an increase in surface area or roughness of scaffold matrices enhance osteoblast response, which can lead to an improved osteoconductivity of the biomaterial. Osteogenetic process is enhanced on surfaces with larger surface roughness. This is due to the fact that higher cell density is reached on rougher surface and demonstrate “pile up” phenomenon at early stages of cell cultivation [Price et al., 2004; León y León, 1998]. The stem cells on the inter-rough surface can also been seen in the micrograph attached in Figure 6.29. Internal walls thickness of the pores observed was 3-7 m in most of the cases where porosity and average pore diameter was 86% and 205 m respectively.
Scaffold
SEM Cross Sectional View Skin of the Scaffold 3-5m
Centre Cross Section Pore Internal Surface
Fibrous Internal Surface Uneven Internal Surface
Stem cells on Internal Surface Pore wall thickness 3-7m
Figure 6.30: Pore Morphology of different types of scaffold processed by wet and dry methods.
In the wet method, the morphology of the pores observed was quite varied. There were regular homogeneous, heterogeneous, irregular pores depending on the material selected and the process condition (cf. Figure 6.30). The intersurface as shown in the micrograph is smooth and wall thickness of the pores was 2-3m.
A comparsion of pore morphology for selected foams from both PLAs and PLGAs processed at Tsat = 50oC, Psat = 100 bars, tsat = 20 min and dP/dt = 3 bar/s is presented in Figure 6.31. Compairining the
wet and dry method, one can see that in wet method there is more percentage of elongated and irregular pores as compared to the dry method. Similar behaviour is also observed in case of both PLGAs. If we compare PL,DLA and PL,DLLA the regular pore are more in the latter polymer. In PLGA50:50 and PLGA85:15 the
elongated and irregular pores are minimum. Regular pores are maximum in PLGA85:15. The possible reason
for higher percentage of regular pores in both PLGAs is that there is maximum equilibrium between the pore walls and the CO2 sorbed and during the dP/dt step the pores do not rupture. While in the foams where
elongated and irregular pores are at higher percentages during the dP/dt they are either ruptured or they do not attain spherical shape.
Regular and homogeneous pores [Psat = 150 bars, Tsat=40oC,
tsat=15 min, dP/dt=4 bar/s]
Wet method-PL,DLA
Pentagon or honeycomb like pores Heterogeneous pores
Open and close pores Heterogeneous irregular pores Smooth surface in wet method scaffold and wall thickness 2-3m [Psat = 100 bars, Tsat=50oC,
tsat=20 min, dP/dt=3 bar/s]
Wet method-PL,DLLA
[Psat = 200 bars, Tsat=45oC,
tsat=20 min, dP/dt=1 bar/s]
Dry method-PLGA50:50
[Psat=100 bars, Tsat=50oC,
tsat=20 min, dP/dt=3 bar/s]
Dry method-PLGA85:15
[Psat=300 bars, Tsat=40oC,
tsat=20 min, dP/dt=5 bar/s]
Wet method-PLGA85:15
[Psat=200 bars, Tsat=45oC,
tsat=20 min, dP/dt=1 bar/s]
0 min Cogrinding Foam PL,D LA -Wet PL,D LA -Dr y PL,D LLA -Wet PL,D LL A-Dry PLG A50 :50-W et PLG A50 :50-D ry PLG A85: 15-W et PLG A85 :1 5-Dry Type s of Pore s (% ) 0 20 40 60 80 Elongated Irregular Regular
Figure 6.31: Comparison of pore morphology for PLAs and PLGAs foams processed at Tsat = 50oC, Psat =
100 bars, tsat = 20 min and dP/dt = 3 bar/s.
2.7 Interconnectivity of Pores in Foams by Both Methods
CT of one foam sample with maximum pore diameter or porosity was done for each polymer for wet and dry pellet preparation methods. Slices image of PL,DLA foams are presented in Figure 6.32.
(A)-Foam processed by wet method at [50oC-100 bars-20 min-3 bar/s] de = 100m, Geometric porosity = 73%
(B)-Foams processed by dry method at [45oC-100 bars-40 min-5 bar/s] de = 65 m, Geometric porosity = 84%
Figure 6.32: Slice images of PL,DLA foams structure by CT analysis.
Slice images of PL,DLLA foams are presented in Figure 6.33.
(A)-Foam processed by wet method at [45oC-75 bars-25 min-4 bar/s] de = 55m, Geometric porosity = 91%
(B)-Foam processed by dry method at [50oC-100 bars-20 min-3 bar/s] de = 75m, Geometric porosity = 85%
Figure 6.33: Slice images of PL,DLLA foams structure by CT analysis.