Publisher’s version / Version de l'éditeur:
Vous avez des questions? Nous pouvons vous aider. Pour communiquer directement avec un auteur, consultez la première page de la revue dans laquelle son article a été publié afin de trouver ses coordonnées. Si vous n’arrivez pas à les repérer, communiquez avec nous à [email protected].
Questions? Contact the NRC Publications Archive team at
[email protected]. If you wish to email the authors directly, please see the first page of the publication for their contact information.
https://publications-cnrc.canada.ca/fra/droits
L’accès à ce site Web et l’utilisation de son contenu sont assujettis aux conditions présentées dans le site
LISEZ CES CONDITIONS ATTENTIVEMENT AVANT D’UTILISER CE SITE WEB.
Analytical and Bioanalytical Chemistry, 412, 18, pp. 4363-4373, 2020-05-07
READ THESE TERMS AND CONDITIONS CAREFULLY BEFORE USING THIS WEBSITE. https://nrc-publications.canada.ca/eng/copyright
NRC Publications Archive Record / Notice des Archives des publications du CNRC :
https://nrc-publications.canada.ca/eng/view/object/?id=87e8b91e-69f2-47c0-aad2-e3a157d69e48 https://publications-cnrc.canada.ca/fra/voir/objet/?id=87e8b91e-69f2-47c0-aad2-e3a157d69e48
NRC Publications Archive
Archives des publications du CNRC
This publication could be one of several versions: author’s original, accepted manuscript or the publisher’s version. / La version de cette publication peut être l’une des suivantes : la version prépublication de l’auteur, la version acceptée du manuscrit ou la version de l’éditeur.
For the publisher’s version, please access the DOI link below./ Pour consulter la version de l’éditeur, utilisez le lien DOI ci-dessous.
https://doi.org/10.1007/s00216-020-02673-x
Access and use of this website and the material on it are subject to the Terms and Conditions set forth at
CRM rapid response approach for the certification of arsenic species
and toxic trace elements in baby cereal coarse rice flour certified
reference material BARI-1
Gajdosechova, Zuzana; Grinberg, Patricia; Nadeau, Kenny; Yang, Lu; Meija,
Juris; Gürleyük, Hakan; Wozniak, Ben J.; Feldmann, Joerg; Savage, Laurie;
Deawtong, Suladda; Kumkrong, Paramee; Kubachka, Kevin; Mester, Zoltan
1
CRM rapid response approach for the certification of arsenic species and toxic trace elements in baby
1
cereal coarse rice flour certified reference material BARI-1
2
Zuzana Gajdosechova1, Patricia Grinberg*1,Kenny Nadeau1 Lu Yang1, Juris Meija1, Hakan Gürleyük2, Ben J. 3
Wozniak2, Joerg Feldmann3, Laurie Savage3, Suladda Deawtong4, Paramee Kumkrong1, 4, Kevin Kubachka5, 4
Zoltan Mester1 5
6
1 National Research Council Canada, 1200 Montreal Rd, Ottawa ON K1A 0R6, Canada 7
2 Brooks Applied Labs, 18804 North Creek Parkway, Suite 100, Bothell, WA 98011, USA 8
3 University of Aberdeen, TESLA, Aberdeen AB24 3UE, Scotland, UK 9
4 Thailand Institute of Scientific and Technological Research, 35 Mu 3 Tambon Khlong Ha, Amphoe Khlong 10
Luang, Pathum Thani 12120, Thailand 11
5 US FDA Forensic Chemistry Center, 6751 Steger Drive, Cincinnati, OH 4523, USA 12
13
* Corresponding author: [email protected] 14
15
16
Abstract
17
With recently legislated maximum levels of inorganic arsenic (iAs) in white and brown rice in Canada, the 18
regulatory bodies are evaluating the need for regulation of As levels in infant food products. Rice is a 19
ajor part of i fa ts’ diet a d therefore, the prese e of As i this staple food auses o er s. So far, 20
the scientific community was lacking suitable certified reference material (CRM) which could be used to 21
assess the accuracy of developed analytical methods for As spe iatio i i fa ts’ food produ ts. As a 22
result, we have developed BARI-1, a baby cereal coarse rice flour reference material which was certified 23
for total arsenic (0.248 ± 0.018 mg kg-1), cadmium (0.0134 ± 0.0014 mg kg-1), mercury (0.0026 ± 0.0003 24
mg kg-1), lead (0.0064 ± 0.0016 mg kg-1) inorganic As (0.113 ± 0.016 mg kg-1)and dimethylarsinic acid (DMA) 25
(0.115 ± 0.010 mg kg-1), and reference value for monomethylarsonic acid (MMA) (0.0045 ± 0.0008 mg 26
kg-1) was reported. We also observed trace amounts of an unknown As compound, with chromatographic 27
2
retention time close to DMA. Participating laboratories were allowed to use their in-house validated 1
extraction and/or digestion method and detection of total metals was done by ICP-MS whereas HPLC-ICP-2
MS was used for As speciation. Despite the diversity in sample preparation and quantitation methods 3
reported values were in good agreement. For iAs measurement the comparison between hydride 4
generation ICP-MS and HPLC-ICP-MS found iAs overestimation with the former method, possibly due to 5
interference from DMA. The certification was accomplished with a CRM rapid response approach in 6
collaborative, focused effort completing the CRM development in few months instead of the typical 7
multiyear project. This approached allowed to respond to measurement needs in a timely fashion. 8
9
Keywords: baby cereal rice flour certified reference material, toxic metals, arsenic speciation, isotope
10
dilution, HPLC-ICP-MS, quality assurance 11
12
Introduction
13
Rice is one of the most produced grains in the world, with an annual production of about 500 million 14
tonnes [1]. It is considered to be one of the most important crops as it provides more calories per hectare 15
than any other cereal grain [2]. It is also one of the most consumed staple foods in the world, especially 16
in Asia [2, 3] where it is the primary food source. Owing to its high carbohydrate content, palatable and 17
low allergic potential due to the absence of gluten, rice is also a major component of i fa ts’ diet. 18
Although it is grown in more than 100 countries and all continents except Antarctica, 90 % of the orld’s 19
rice is grown in Asia [2, 3]. Rice is a semi-aquatic grass plant and is cultivated either in flooded or rain-fed 20
conditions [1] requiring large amount of water. 21
Arsenic contamination in rice can be of a natural origin due to high As levels in the soil and water or it can 22
result from cultivation practices such as application of As containing fertilisers and crop-protecting 23
chemicals [4-6]. In Asia, especially in the Bengal delta region, the shallow groundwater is naturally 24
contaminated with As, with concentrations reaching above 50 g L-1 [7] which leads to As accumulation 25
in the soil and consequently rice grains [8, 9]. Arsenic contamination in rice is not a problem solely in Asia. 26
A study performed in 2008, which evaluated As concentrations in more than two hundreds rice samples 27
produced in the USA, showed that As levels in rice ranged from 5 to 710 μg kg-1 [10]. The high 28
concentrations of As in these samples are attributed to soil contamination due to the use of As-containing 29
pesticides [9, 11]. 30
3
Four As species are commonly found in the rice, with inorganic As (sum of As(III) as arsenite and As(V) as 1
arsenate) being the dominant fraction in Asian rice, followed by dimethylarsinic acid (DMA) and traces of 2
monomethylarsonic acid (MMA). In rice grown in USA, DMA is found to be dominant [8, 12, 13] and several 3
researchers reported the presence of tetramethylarsonium ion (TETRA) [14-16]. Although methylated 4
forms of As are products of iAs detoxification, rice is lacking a gene for As methylation [17]. Therefore, 5
methylation must take place under anaerobic conditions in rhizosphere soils and newly formed 6
methylated arsenicals and then taken up by the plant [18]. 7
High levels of As in rice grains is considered a concern for human health. Information regarding the As 8
speciation is of extreme importance as there is a great difference in toxicity between different As species. 9
The inorganic As (iAs) exhibits the highest toxicity and is classified as Class one carcinogen by International 10
Agency for Research on Cancer [19]. Long-term exposure is related to severe health issues such as cancers, 11
skin lesions, cardiovascular disease among others [20]. On the other hand, MMA and DMA are classified 12
as Class 2B (possible) carcinogens and thus is of a lesser concern [21]. 13
The consumption of rice-based products is of a particular concern in weaning infants, since they have 14
greater intake of food and fluids relative to their bodyweight [22]. High As concentrations in the hair of 15
infants were linked to the consumption of rice based products, and increased As concentration in urine 16
was observed after transition from liquid to solid based diet containing rice cereals [23-26]. Furthermore, 17
se eral pu li atio s ha e raised o er s of i fa ts’ exposure to high As levels present in rice milk [27], 18
baby rice [28], infant formulae [25] and infant cereals [29]. In early 2019, the Canadian national public 19
broadcaster (CBC) showed that some infant rice products widely distributed in Canadian food stores 20
contain as much as 170 μg kg-1 of iAs [30]. 21
Currently, only European Food Safety Agency (EFSA) has set maximum level (ML) of iAs in infant rice cereal 22
to 100 μg kg-1 [31] while US Food and Drug Administration (US FDA) put out an identical proposed action 23
level in 2016 which has not been adopted yet [32]. As of June 2019, Health Canada legislated MLs of iAs 24
in white and brown rice to 200 and 350 μg kg-1, respectively, but whether MLs in infant rice food will be 25
legislated is currently under survey [33]. It should be noted, that when setting MLs human health concerns 26
are outweighed by factors such as world food security and commercial trade as it is reflected in Codex 27
Alimentarius where no consensus was achieved on MLs in husked rice [34]. Recently published review of 28
regulation of As in feed and food highlighted great number of difficulties in setting maximum MLs due to 29
molecular diversity of As which introduces several analytical challenges [35]. Consequently, the trueness 30
of obtained result has to be rigorously validated with suitable certified reference materials (CRMs), which 31
4
choice is very often limited. At the moment, there are three rice-based CRMs available on the market, 1
which have certified As species listed, white rice flour NMIJ CRM 7503-a, rice powder ERM-BC211 and rice 2
flour NIST 1568b (Table 1). 3
4
Table 1. Overview of currently available rice based CRMs with certified values for As species and
5
associated expanded uncertainties. 6
CRM Matrix As species concentration (μg kg
-1)
Producer
iAsa As(III)b As(V)c DMA MMA
CRM 7503a White rice flour - 71.1 ± 2.9 13.0 ± 0.9 13.3 ± 0.9 - NMIJ ERM-BC211 Rice powder 124 ± 11 - - 119 ± 13 - JRC SRM 1568b Rice flour 92 ± 10 - - 180 ± 12 11.6 ± 3.5 NIST
a. sum of As(III) as arsenite and As(V) as arsenate
7 b.As(III) as arsenite 8 c. As(V) as arsenate 9 10
The lack of reference materials is due to a significant resource commitment often involving several 11
laboratories and complex physical preparation of the sample into a CRM. The costs of such CRM projects 12
are in the hundreds of thousands often several millions of dollars. Usually a CRM production campaign, 13
starting from planning to actual release of the material takes several years. However, in situations where 14
the development of new CRMs is of great and immediate importance, these timelines can be significantly 15
shortened. 16
In this case, the background of this project was the lack of specific guidance on As and As species in baby 17
food in Canada, coupled with well-publicized, investigative journalism piece published on As in Canadian 18
baby food which was found to be exceeding EU guidelines. The combination of the regulatory issue along 19
with the media coverage created an urgency addressing the underlying measurement challenge and NRC 20
Canada responded in the form of development of a CRM related to toxic metals and As species in infant 21
rice food. A team of experts, in toxic analysis and As speciation, from around the world was put 22
together in order to swiftly respond to the need of new and well defined CRM . This highly focused 23
and leveraged reference material development approach is referred as the CRM rapid response approach. 24
25
Materials and methods
5
NRC Canada has created a CRM rapid response approach, aiming for 2-3 months CRM project completion 1
versus the typical 2-3 years. To achieve this, we formed a high intensity development process with 2
dedicated special resources. This was made possible by the unique expertise of the NRC team on As 3
speciation supported by expert laboratories around the world invited to contribute data to this campaign 4
along with a nimble organizational structure allowing reprioritization activities on short timeframe. CRM 5
rapid response development approach based on leveraging expertise through our network of national 6
metrology laboratories where a contractual mutual recognition is in place among national metrology 7
institutes, academic, and commercial state-of-the-art testing laboratories. 8
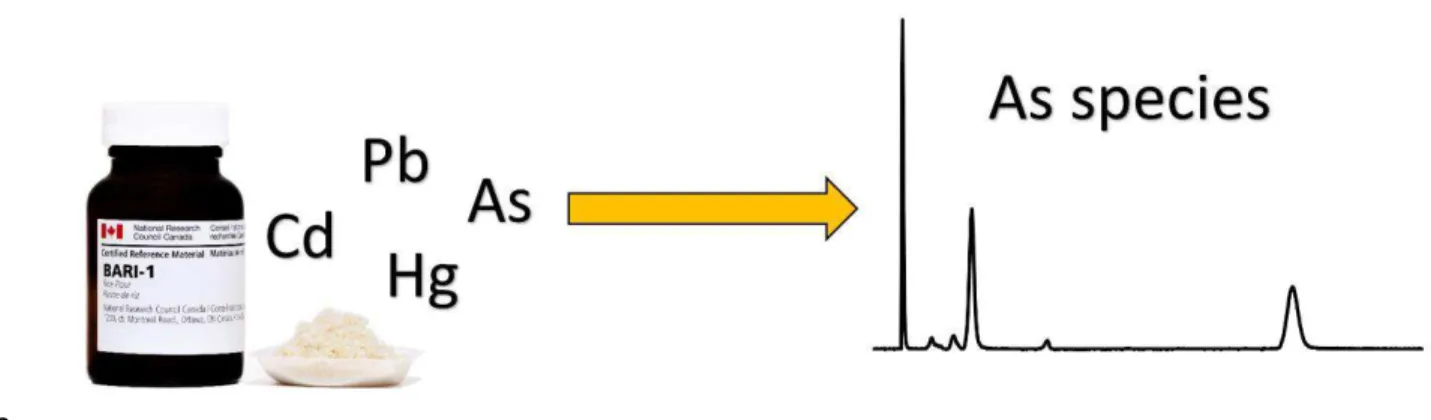
Approximately 15 kg of infant cereal consisting of course rice flour were purchased from local food stores. 9
Rice flour was homogenised in pre-cleaned Teflon mixer for 10 h with the aid of a rotary drum mixer and 10
bottled into pre-cleaned 60 mL amber glass vials (minimum 8 g per unit). Each unit of BARI-1 (baby cereal 11
coarse rice flour material) was sealed in trilaminate bags and stored in a freezer at -20 oC. 12
Each participating laboratory (Table 2) was given seven blind samples: five samples of BARI-1 and 2 quality 13
control (QC) samples, NRC DORM-4 and NIST 1568b. Some laboratories, included SQID-1 (cuttlefish CRM), 14
ERM-BC211 (rice CRM) and NIST 1634f (water CRM) as their own QC samples. Participants were free to 15
choose the analytical method that they consider appropriate to perform the analysis of toxic metals and 16
As speciation (Table 3). Each participating laboratory was requested to provide results of five replicate 17
measurements, a complete description of sample preparation and analysis, including calibration 18
technique(s) along with their metrological traceability (source of the calibration standards). Results of 19
replicate measurements were requested to be submitted to NRC within two weeks. 20
Table 2: List of participants of the inter-laboratory study for certification of BARI-1
21
Lab Country Analytes reported
Lab 1* Canada As Cd, Hg, Pb, iAs, MMA, DMA Lab 2 USA As Cd, Hg, Pb, iAs, MMA, DMA Lab 3 UK As Cd, Pb, iAs, DMA
Lab 4 Thailand iAs, MMA, DMA Lab 5 USA As Cd, iAs, MMA, DMA Lab 6 USA As, Cd, Pb
Lab 7 Canada As, Cd, Pb Lab 8 Canada As, Cd, Pb * Lab 1 is NRC
22
The submitted results were evaluated using the random laboratory effects statistical model which 23
included the value assignment and the evaluation of the between-unit homogeneity [36]. 24
6
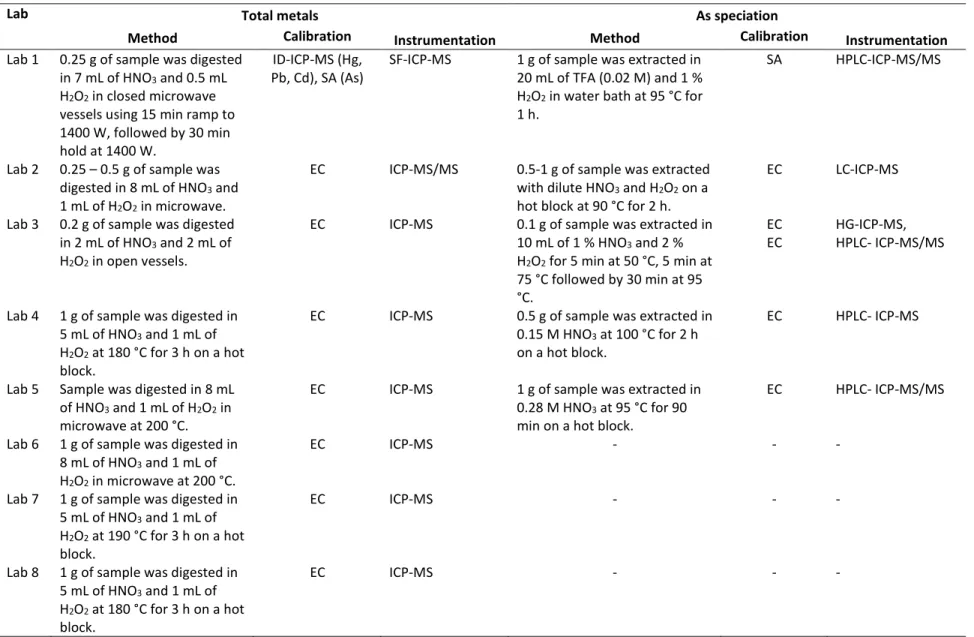
Table 3. Summary of sample preparation methods for total metal analysis and speciation.
Lab Total metals As speciation
Method Calibration Instrumentation Method Calibration Instrumentation
Lab 1 0.25 g of sample was digested in 7 mL of HNO3 and 0.5 mL
H2O2 in closed microwave
vessels using 15 min ramp to 1400 W, followed by 30 min hold at 1400 W.
ID-ICP-MS (Hg, Pb, Cd), SA (As)
SF-ICP-MS 1 g of sample was extracted in 20 mL of TFA (0.02 M) and 1 % H2O2 in water bath at 95 °C for
1 h.
SA HPLC-ICP-MS/MS
Lab 2 0.25 – 0.5 g of sample was digested in 8 mL of HNO3 and
1 mL of H2O2 in microwave.
EC ICP-MS/MS 0.5-1 g of sample was extracted with dilute HNO3 and H2O2 on a
hot block at 90 °C for 2 h.
EC LC-ICP-MS
Lab 3 0.2 g of sample was digested in 2 mL of HNO3 and 2 mL of
H2O2 in open vessels.
EC ICP-MS 0.1 g of sample was extracted in 10 mL of 1 % HNO3 and 2 %
H2O2 for 5 min at 50 °C, 5 min at
75 °C followed by 30 min at 95 °C. EC EC HG-ICP-MS, HPLC- ICP-MS/MS
Lab 4 1 g of sample was digested in 5 mL of HNO3 and 1 mL of
H2O2 at 180 °C for 3 h on a hot
block.
EC ICP-MS 0.5 g of sample was extracted in 0.15 M HNO3 at 100 °C for 2 h
on a hot block.
EC HPLC- ICP-MS
Lab 5 Sample was digested in 8 mL of HNO3 and 1 mL of H2O2 in
microwave at 200 °C.
EC ICP-MS 1 g of sample was extracted in 0.28 M HNO3 at 95 °C for 90
min on a hot block.
EC HPLC- ICP-MS/MS
Lab 6 1 g of sample was digested in 8 mL of HNO3 and 1 mL of
H2O2 in microwave at 200 °C.
EC ICP-MS - - -
Lab 7 1 g of sample was digested in 5 mL of HNO3 and 1 mL of
H2O2 at 190 °C for 3 h on a hot
block.
EC ICP-MS - - -
Lab 8 1 g of sample was digested in 5 mL of HNO3 and 1 mL of
H2O2 at 180 °C for 3 h on a hot
block.
EC ICP-MS - - -
7
Results and discussion
1
Comparison of total As, Cd, Hg, Pb and As species quantitation
2
When designing the certification campaign of BARI-1 there were two possible routes to take with regards 3
to analytical methods. An analytical method could be prescribed which all participating laboratories would 4
have to follow, or a method characteristics could be provided with which the chosen method in the 5
collaborating facilities has to comply. As the goal was to seek independent estimates from the 6
participants, our collaborators were given the freedom to use their internally validated methods for the 7
determination of total mass fractions of As, Cd, Hg, Pb, and As species. In doing so, the obtained data 8
contained eight largely independent analytical methods (Table 3). To evaluate the quality of each data 9
set, repeatability (RSDr) within-laboratory, and inter-laboratory reproducibility (RSDR) were assessed. 10
Additionally, performance of each laboratory was verified using the blind CRMs SRM 1568b and DORM-4 11
to evaluate potential biases in the reported values. 12
13
14
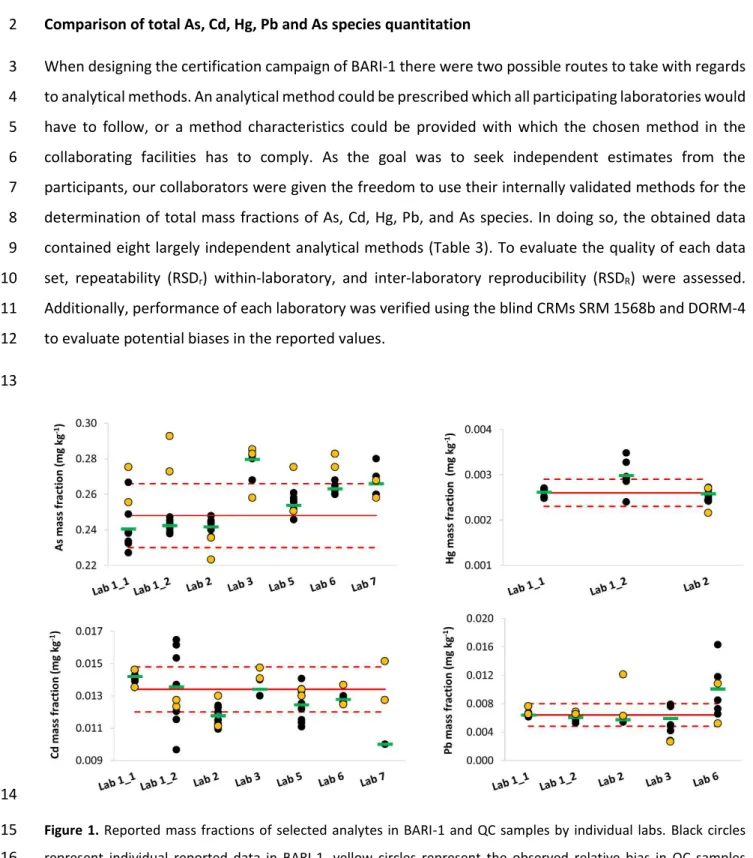
Figure 1. Reported mass fractions of selected analytes in BARI-1 and QC samples by individual labs. Black circles
15
represent individual reported data in BARI-1, yellow circles represent the observed relative bias in QC samples 16
superimposed to the certified values in 1, green horizontal dash represents average of reported data in BARI-17
8
1, dashed red lines represent upper and lower 95 % confidence interval of certified value in BARI-1, and the red line 1
represents certified value in BARI-1. 2
3
Two laboratories reported more than one data set; where one lab analysed the samples by two different 4
instruments, SF-ICP-MS (Figure 1, Lab 1_1) and ICP-MS/MS (Figure 1, Lab 1_2), and the other lab used 5
HPLC-ICP-MS (Figure 2, Lab 3_1) and hydride generation (HG-ICP-MS, Figure 2, Lab 3_2) for quantitation 6
of iAs [37]. Comparison of reported values from Lab 1 analysed by two different ICP-MS instruments 7
showed no significant difference (t-test at 95 % confidence interval), however, the repeatability of Cd and 8
Hg was above 10 % when analysed by ICP-MS/MS (Lab 1_2, Table 4). It should be noted that at given mass 9
fractions in the samples, analytes were close to the LOQ and therefore, RSDr of around 10 % is acceptable. 10
Additionally, Hg is especially difficult to analyse in such a low level due to blank issues. In order to reduce 11
Hg blank, Lab 1 reported rigorous cleaning of the digestion vessels and instrument introduction system 12
(Materials and methods, SI). In terms of total metal analysis, laboratories demonstrated good overall 13
consistency in both repeatability and reproducibility with an exception of Lab 3 and 6 in Pb analysis where 14
RSDr above 25 % was reported. Consequently, the RSD of inter-laboratories reproducibility in Pb analysis 15
increased from 5 % to 27 % when results from Lab 3 and 6 were included. 16
9
Table 4. Reported mean concentration ± expanded uncertainties of monitored analytes (mg kg-1) in BARI-1. RSD
r represents within-laboratory repeatability and
RSDR inter-laboratories reproducibility.
Lab 1_1a Lab 1_2b,c Lab 2 Lab 3_1c Lab 3_2d Lab 4 Lab 5 Lab 6 Lab 7 Lab 8 RDS
R As 0.2401 ± 0.0099 0.2420 ± 0.0122 0.2423 ± 0.0035 0.2796 ± 0.0067 - ND 0.2538 ± 0.0048 0.2630 ± 0.0035 0.2660 ± 0.0089 ˂ . 6 % RSDr 5 % 1 % 1 % 2 % - - 2 % 1 % 3 % - Cd 0.0142 ± 0.0005 0.0135 ± 0.0052 0.0117 ± 0.0044 0.0134 ± 0.0050 - ND 0.0124 ± 0.0011 0.0128 ± 0.0049 0.0100 ± 0.0050 ˂ . 11 % RSDr 1 % 19 % 5 % 4 % - - 9 % 4 % 0 % - Hg 0.0026 ± 0.0001 0.0030 ± 0.0016 0.0026 ± 0.0001 ND - ND ND ˂ . 5 ND ND 6 % RSDr 4 % 12 % 3 % - - - - Pb 0.0064 ± 0.0002 0.0061 ± 0.0030 0.0057 ± 0.0002 0.0059 ± 0.0017 - ND ND 0.0101 ± 0.0040 ND ND 27 % RSDr 3 % 8 % 4 % 29 % - - - 40 % - - iAs - 0.1134 ± 0.0009 0.1118 ± 0.0009 0.1147 ± 0.0151 0.1564 ± 0.0406 0.1523 ± 0.0193 0.1071 ± 0.0020 ND ND ND 18 % RSDr - 5 % 2 % 13 % 26 % 13 % 2 % - - - DMA - 0.1194 ± 0.0014 0.1171 ± 0.0020 0.1163 ± 0.0120 - 0.1291 ± 0.0078 0.1113 ± 0.0011 ND ND ND 6 % RSDr - 3 % 3 % 10 % - 6 % 1 % - - - MMA - 0.0044 ± 0.0003 0.0045 ± 0.0002 ND - 0.0044 ± 0.0004 0.0047 ± 0.0007 ND ND ND 3 % RSDr - 6 % 3 % - - 10 % 15 % - - - Unknowne - 0.0252 ± 0.0006 0.0095 ± 0.0004 ND - ND 0.0123 ± 0.003 ND ND ND 53 % RSDr - 2 % 4 % - - - 2 % - - - Sum of As species - 0.2622 ± 0.0143 0.2373 ± 0.0021 0.2310 ± 0.0136 - 0.2858 ± 0.0120 0.2355 ± 0.0011 - - - 8 %
a - total concentration of analytes determined by SF-ICP-MS; b - total concentration of analytes and As species determined by ICP-MS/MS; c - As speciation determined by HPLC-ICP-MS/MS; d - iAs determined by HG-ICP-MS; ND – not determined; e – values are reported with ± 1 standard deviation
10
Comparison of two different analytical methods for quantitation of iAs performed by Lab 3 (Figure 2) have 1
shown difference between the reported values, however the observed difference was not statistically 2
significant (t-test at 95 % confidence interval). Although HG-ICP-MS is an established technique for iAs 3
quantitation [37, 38], the values provided by this method were higher in comparison with HPLC-ICP-MS. 4
Furthermore, iAs recovery in blind SRM 1568b was 58 % above the certified value also indicating that HG-5
ICP-MS was overestimating the true value in BARI-1 likely because it accesses As from compartments 6
other than iAs. While HG is one of the most straightforward methods for iAs quantitation it also suffers 7
from DMA and MMA interferences [39]. Both DMA and MMA generate arsines during HG under higher 8
pH, although still acidic conditions. It was shown, that with increasing concentration of HCl in HG system, 9
the interference from DMA can be significantly reduced at 4 M HCl [40]. But the molarity of HCl had to be 10
increased to 12 M in order to eliminate interference from MMA. Both analysed samples BARI-1 and SRM 11
1568b contain significant levels of DMA and, if one considers that 58 % overestimation of iAs is due to 12
contribution from DMA, the corrected value in BARI-1 would be 106 μg kg-1 which corresponds to 94 % of 13
certified iAs concentration in BARI-1. Nonetheless, laboratories showed very good reproducibility for DMA 14
(6 %) and MMA (3 %), whereas RSDR of 18 % was found for iAs. This high value was driven by two labs, Lab 15
3_2 and Lab 4, which reported significantly higher values for iAs in comparison with other participants. 16
Upon exclusion of the results from these two labs, RSDR was reduced to 3 %. In terms of repeatability, 17
RSDr above 10 % was only observed in reported value for MMA by Lab 5. It should be noted, that MMA 18
mass fraction in BARI-1 is only 0.0045 ± 0.0008 mg kg-1 and thus very possibly around the LOD of the 19
analytical method used by Lab 5. Although, there was very good agreement in MMA values between the 20
participants, this As species was below LOQ of Lab 1 and therefore, only information value was assigned 21
to MMA in BARI-1 certificate. 22
23
24
25
11
Figure 2. Reported mass fractions of As species in BARI-1 and QC samples by individual labs. Black circles represent
1
individual reported data in BARI-1, yellow circles represent the observed relative bias in QC samples superimposed 2
to the certified values in BARI-1, green horizontal dash represents average of reported data in BARI-1, dashed red 3
lines represent upper and lower 95 % confidence interval of certified value in BARI-1, and the red line represents 4
certified value in BARI-1. 5
6
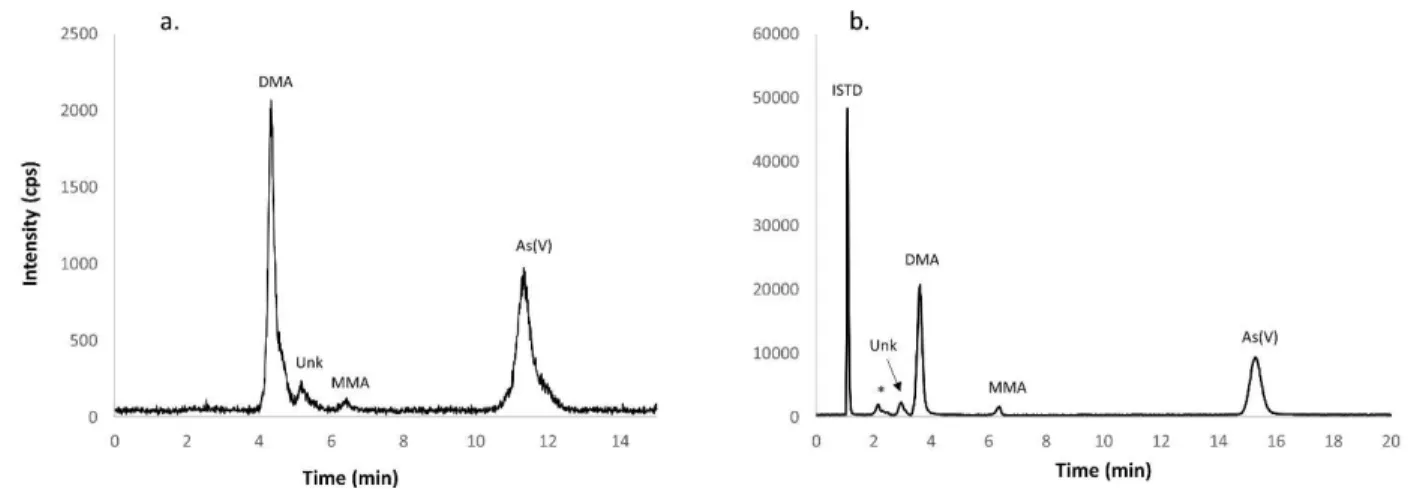
Several collaborators, Lab 1, 2 and 5 reported the presence of another As species, eluting in close 7
proximity of DMA (Figure 3a and b). Depending on the chromatographic method employed, the unknown 8
compound was eluting in the tailing shoulder of DMA as it can be seen in the Figure 3a. For the purpose 9
of DMA quantitation, this peak was excluded from the integration of DMA peak area. Lab 1 reported As 10
contribution from this unknown compound to be 0.0252 ± 0.0006 mg kg-1, which is significantly higher 11
than reported by Lab 2 (0.0095 ± 0.0004 mg kg-1) and Lab 5 (0.0123 ± 0.0003 mg kg-1). It is possible that 12
due to co-elution of an unknown compound with DMA under chromatographic conditions applied by Lab 13
1 (Figure 3a) the quantitation of this compound is overestimated. Lab 2 and 5 did not reported co-elution 14
of the unknown compound with other As species (Figure 3b). 15
16
17
Figure 3. HPLC-ICP-MS chromatograms of As species present in BARI-1, with an unknown compound eluting close to
18
DMA as reported by Lab 1 (a) and Lab 5 (b). Arsenic(III) was oxidised by H2O2 and converted to As(V) * in the figure
19
(b) identifies unretained As compounds under applied chromatographic conditions. 20
21
Mass balance of As species
12
The sum of reported As species supported the results of total As after sample digestion, confirming 1
quantitative extraction of As species from the rice matrix (Table 4). Quantitative extraction of As species 2
is not always achieved under mild extraction conditions and applying more aggressive extraction may lead 3
to species conversion [41, 42]. Recently, matrix dependent conversion of organo-arsenicals was reported 4
in several biological matrices [43]. Trivalent As has strong affinity to thiols which results in conversion of 5
arsinoyl (As=O) functionalities to their thiol counterpart (As=S) [44] with DMA and MMA conversion 6
reported in several studies [45-47]. Thus, deployment of extraction methods specifically designed for 7
extraction of desired arsenicals was suggested by several researchers [48-50]. In this study, each 8
collaborator was using their in-house validated extraction method with Lab 1 using 2 mM trifluoroacetic 9
acid whereas the rest of the collaborators used HNO3 of varying concentration (Table 3). The extractions 10
were performed either in the hot block, water bath or microwave digestion system at elevated 11
temperature. Thus, based on the agreement in the reported mass fractions of As species it can be 12
concluded that As species were preserved in their endogenous form under applied conditions. However, 13
it should to be noted that As(III) was intentionally reduced to As(V) by some extraction methods. 14
15
Identification of unknown As compound in BARI-1
16
Collaborating Labs 3 and 5 undertook extensive efforts to identify the unknown compound which has 17
been found in trace amounts in brown rice as well as in medium and long grained white rice. To exclude 18
the possibility of the unknown peak being a spectral or matrix interference, analysis of sample and 19
collected fractions containing this compound was carried out in kinetic energy discrimination mode using 20
He and O2 reaction mode with a m/z shift from 75 to 91 by ICP-MS/MS. In both cases, the peak of unknown 21
compound remained unaffected and similar results were found upon high dilution of the sample matrix. 22
Considering compounds in a close proximity to DMA, there was a possibility that under employed 23
chromatographic condition, DMA peak was splitting. However, investigation of increasing pH of the 24
mobile phase showed no impact on the peak splitting as two peaks were observed up to pH 10. Following 25
these findings, it was concluded that the unknown peak is genuine As-containing compound and steps 26
were undertaken to reveal its identity. Neither sulfur nor phosphorus were found co-eluting with the 27
unknown compound, and H2O2 treatment of the sample did not change its retention time or affected its 28
quantity. This observation suggests that the compound is not a typical trivalent arsenical or thioarsenical. 29
Furthermore, the retention time matching with several organo-arsenicals (such as phenyl arsenicals, 30
asomate, arsenosugars 254, 328, 392, 482) yielded no identification, and the determination of exact 31
13
molecular structure of this compound remains a subject of future studies. Similar observations were 1
reported by others [51]. 2
3
Homogeneity assessment of BARI-1
4
For all analytes, homogeneity of BARI-1 was assessed by Lab 1 in its final packaged form with the analysis 5
of 6-8 units of BARI-1, sampled across the entire CRM production series (approx. 600 units). The 6
uncertainty component due to homogeneity was estimated using the random effects model[52], an often-7
used model for evaluating homogeneity in data according to ISO Guide 35:2017 [53]. In the framework of 8
this statistical model, the overdispersion (dark uncertainty) of the measurement results from the various 9
units of BARI-1 is taken as the measure of the between-unit heterogeneity. Measurement results from each 10
BARI-1 unit, xi, are interpreted probabilistically as a superimposition of a unknown true value (µ), the random
11
effect due to inhomogeneity (uhom), and random effect due to measurement (umeas) which can be 12
summarized using a statistical model with two parameters (µ, uhom): 13
µi ~ N(µ, uhom) and xi ~ N(µi, umeas) 14
Due to low dispersion of measured results for Cd, Hg and Pb uncertainty due to homogeneity equals zero 15
(Table S2). While the uncertainty due to homogeneity in As and As species is reported, it should be noted 16
that this value is very close to uncertainty due to measurements and in all certified analytes and/or species 17
is below 4 %. These results indicate that BARI-1 is sufficiently homogeneous with respect to the certified 18
properties. 19
20
21
Stability assessment of As species
22
Stability of the proposed CRM implies that all analytes should remain unchanged within the stated 23
uncertainties over the period of validity of the certificate. The stability of trace elements and species in 24
food matrix CRMs is monitored for over 30 years at NRC and from the experience the certified values of 25
these elements are stable for an extended period of time as observed in e. g. DORM-4 [54]. Therefore, we 26
expect similar behaviour of the analytes in BARI-1 and hence our stability study focused on As species 27
during shipping conditions in accordance with ISO Guide 35 [53]. A short-term isochronous stability study 28
14
was carried out for 4 weeks to ensure the stability of As species under conditions that simulate the effect 1
of the potential elevated temperatures experienced during shipment. For that, multiple BARI-1 samples 2
were placed in three different environments (freezer at -20 °C, refrigerator at 4 °C, and oven at 37 °C) with 3
-20 °C being the reference temperature. Samples were removed at 1 week, 2 weeks, and 4 weeks and 4
analysed by HPLC-ICP-MS. 5
6
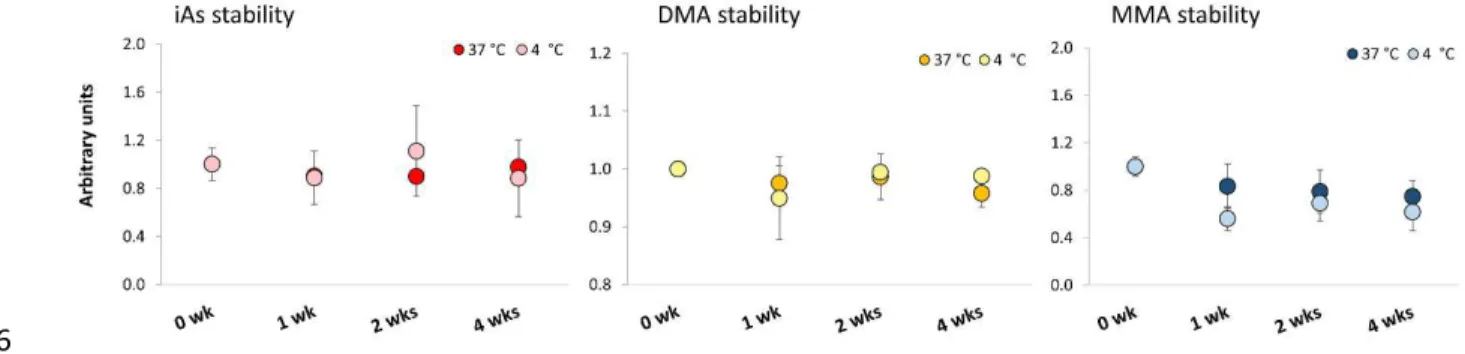
Figure 4. Accelerated stability study results for iAs, DMA and MMA by HPLC-ICP-MS. Responses are normalised to
7
the mean of the reference condition of -20 °C. The error bars represent standard deviation of five replicate 8
measurements. 9
10
The stability study of BARI-1 indicates short term stability at tested temperatures and time duration as no 11
clear trends was observed. This conclusion is supported by the following observations (Figure 4): Results 12
show random variation in iAs mass fractions within the tested temperatures and time duration without 13
any apparent trend. DMA stability show slightly decreasing trend at 37 °C however, this observation is 14
due to random error of the measurement rather than a real degradation of DMA. This is because that if 15
degradation of DMA indeed occurred over the tested period of time, an opposite trend should exist in 16
MMA mass fraction, but on the contrary, a slight decrease of MMA is evident. Data points for DMA at 4 17
°C display no apparent trend. Similarly, there is no obvious trend in MMA data at 4 °C, however the fact 18
that all the points are at lower mass fractions than at 37 °C further suggest random error in the 19
measurement. The long-term stability for As species was assessed by inferring stability from similar 20
materials, however, a long term stability monitoring scheme has also been put in place. With respect to 21
total As, Cd, Hg, and Pb in this material we do not expect any chemical or physical changes based on our 22
30+ year experience in monitoring similar matrix CRMs [54-57]. A shelf life of 5 years was assigned for the 23
proposed material. As no significant changes in species stability over the studied temperatures were 24
observed, we recommend storage of BARI-1 CRM in a refrigerator, at around 4 °C in its original bottle, 25
tightly capped and not exposed to direct sunlight or ultraviolet radiation. 26
15 1
Value assignment
2
The results from the participating laboratories were combined using the random effects model as 3
described above for evaluating homogeneity. The uncertainties reported by individual laboratories were 4
evaluated against their average performance against the QC samples and the largest relative uncertainty 5
of the two was taken. Certified values are the best estimate of the mean and uncertainty. For MMA, which 6
fell below LOQ for the employed method at NRC but was measured by three additional laboratories, we 7
have chosen to report the results as reference value indicating a lesser degree of confidence in the 8
findings. All reported results were corrected for the moisture content which was determined at NRC with 9
a value of 0.0016 ± 0.0006 g/g based on 3 replicates (Material and Method, SI). Certified and reference 10
values (Table 4) are presented with the corresponding expanded uncertainties estimated in accordance 11
with the Guide to the expression of uncertainty in measurement (GUM) [58] with a probability coverage 12
factor of k = 2. 13
14
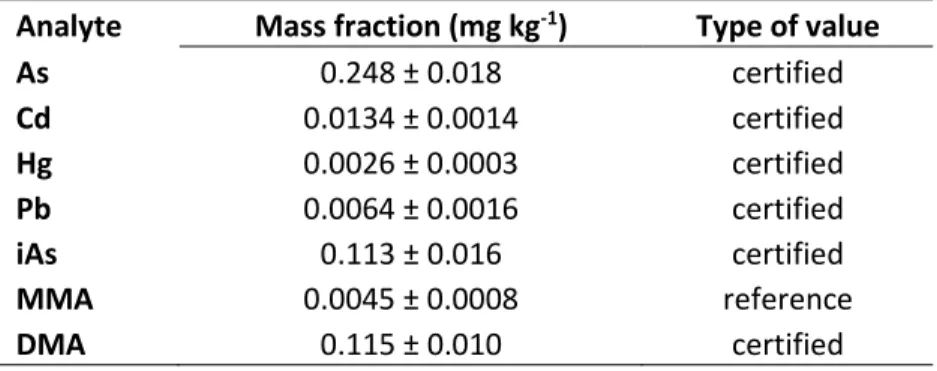
Table 4. Assigned quantity values with expanded uncertainties for studied analytes and their species.
15
Analyte Mass fraction (mg kg-1) Type of value
As 0.248 ± 0.018 certified Cd 0.0134 ± 0.0014 certified Hg 0.0026 ± 0.0003 certified Pb 0.0064 ± 0.0016 certified iAs 0.113 ± 0.016 certified MMA 0.0045 ± 0.0008 reference DMA 0.115 ± 0.010 certified 16 17 Conclusion 18
A new CRM rapid response approach has been employed to swiftly respond to demands for new CRM 19
with certified As species in infant food matrix which was successfully completed in time span of three 20
months by release of BARI-1 on the market. The rapid response approach was enabled by i) decades of 21
research experience in As speciation at NRC, ii) high level expert laboratories from the international 22
measurement science community, and iii) availability of suitable matrix materials and standards. The 23
16
studied infant cereal coarse rice flour contained measurable levels of total As, Cd, Hg, and Pb together 1
with several As species. Inorganic As and DMA were found at similar levels and MMA was reported as a 2
reference value only. Additionally, an unknown As compound was found in BARI-1 and its identity remains 3
a subject of future studies. Our accelerated stability study confirmed the short term stability of As species 4
under varying temperature stresses. BARI-1 is highly suitable not only to assess the accuracy of methods 5
for the determination of As species and toxic trace elements in rice and other similar foods, agricultural, 6
or biological materials but also for establishing a metrological traceability link between individual 7 laboratories results. 8 9 Conflict of interests 10
Authors declare no conflict of interests. 11
12
Acknowledgment
13
The contribution of Ovi Mihai, Enea Pagliano, Kelly LeBlanc, Indumathi Pihillagawa Gedara and Marie-Pier 14
Thibeault (NRC), Stephen D. Springer, Mitchell W. Kiriluk, Sage Presster, Raquel Asencio, Fiona M. Bellows, 15
Jaqueline M. Aitken (Brooks Applied Labs) and Thippaya Junee Fortune (Thailand Institute of Scientific and 16
Technological Research) are acknowledged. 17
17
References
1
1. Muthayya, S., et al., An overview of global rice production, supply, trade, and consumption. 2
Annals of the new york Academy of Sciences, 2014. 1324(1): p. 7-14. 3
2. Datta, D., Principles and practices of rice production. 1981: Int. Rice Res. Inst. 4
3. Luh, B.S., Rice: production and utilization. 1980: AVI Publishing Co. 5
4. Sommella, A., et al., Total arsenic, inorganic arsenic, and other elements concentrations in Italian 6
rice grain varies with origin and type. Environmental Pollution, 2013. 181: p. 38-43.
7
5. Baba, K., et al., Arsenic speciation in rice and soil containing related compounds of chemical 8
warfare agents. Analytical chemistry, 2008. 80(15): p. 5768-5775.
9
6. Seyfferth, A.L., et al., Arsenic concentrations in paddy soil and rice and health implications for 10
major rice-growing regions of Cambodia. Environmental science & technology, 2014. 48(9): p.
11
4699-4706. 12
7. Panaullah, G.M., et al., Arsenic toxicity to rice (Oryza sativa L.) in Bangladesh. Plant and Soil, 13
2009. 317(1-2): p. 31. 14
8. Williams, P., et al., Variation in arsenic speciation and concentration in paddy rice related to 15
dietary exposure. Environmental Science & Technology, 2005. 39(15): p. 5531-5540.
16
9. Williams, P., et al., Market basket survey shows elevated levels of As in South Central US 17
processed rice compared to California: consequences for human dietary exposure. Environmental
18
science & technology, 2007. 41(7): p. 2178-2183. 19
10. Zavala, Y.J. and J.M. Duxbury, Arsenic in rice: I. Estimating normal levels of total arsenic in rice 20
grain. Environmental Science & Technology, 2008. 42(10): p. 3856-3860.
21
11. Reed, J.F. and M. Sturgis, Toxicity from arsenic compounds to rice on flooded soils. Journal of the 22
American Society of Agronomy, 1936. 23
12. Zavala, Y.J., et al., Arsenic in rice: II. Arsenic speciation in USA grain and implications for human 24
health. Environmental Science & Technology, 2008. 42(10): p. 3861-3866.
25
13. Meharg, A.A., et al., Geographical variation in total and inorganic arsenic content of polished 26
(white) rice. Environmental Science & Technology, 2009. 43(5): p. 1612-1617.
27
14. Batista, B.L., et al., Speciation of arsenic in rice and estimation of daily intake of different arsenic 28
species by Brazilians through rice consumption. J Hazard Mater, 2011. 191(1-3): p. 342-8.
29
15. Hansen, H.R., et al., Identification of tetramethylarsonium in rice grains with elevated arsenic 30
content. J Environ Monit, 2011. 13(1): p. 32-4.
31
16. Hua, B., et al., Arsenic accumulation in rice grains: effects of cultivars and water management 32
practices. Environmental Engineering Science, 2011. 28(8): p. 591-596.
33
17. Ye, J., et al., Arsenic biomethylation by photosynthetic organisms. Trends Plant Sci, 2012. 17(3): 34
p. 155-62. 35
18. Batista, B.L., et al., Identification and quantification of phytochelatins in roots of rice to long-36
term exposure: evidence of individual role on arsenic accumulation and translocation. J Exp Bot,
37
2014. 65(6): p. 1467-79. 38
19. Zhu, Y.G., P.N. Williams, and A.A. Meharg, Exposure to inorganic arsenic from rice: a global 39
health issue? Environ Pollut, 2008. 154(2): p. 169-71.
40
20. Hughes, M.F., Arsenic toxicity and potential mechanisms of action. Toxicology letters, 2002. 41
133(1): p. 1-16.
42
21. IARC. Arsenic and arsenic compounds. 2012; Available from: 43
http://monographs.iarc.fr/ENG/Monographs/vol100C/mono100C-6.pdf.
44
22. European Food Safety Authority, Dietary exposure to inorganic arsenic in the European 45
population. 2014.
18
23. Signes-Pastor, A.J., et al., Infants' dietary arsenic exposure during transition to solid food. Sci 1
Rep, 2018. 8(1): p. 7114. 2
24. Signes-Pastor, A.J., et al., Levels of infants' urinary arsenic metabolites related to formula feeding 3
and weaning with rice products exceeding the EU inorganic arsenic standard. PLoS One, 2017.
4
12(5): p. e0176923.
5
25. Ljung, K., et al., High concentrations of essential and toxic elements in infant formula and infant 6
foods - A matter of concern. Food Chem, 2011. 127(3): p. 943-51.
7
26. Hernández-Martínez, R. and I. Navarro-Blasco, Survey of total mercury and arsenic content in 8
infant cereals marketed in Spain and estimated dietary intake. Food Control, 2013. 30(2): p.
423-9
432. 10
27. Meharg, A.A., et al., Inorganic arsenic levels in rice milk exceed EU and US drinking water 11
standards. J Environ Monit, 2008. 10(4): p. 428-31.
12
28. Meharg, A.A., et al., Inorganic arsenic levels in baby rice are of concern. Environ Pollut, 2008. 13
152(3): p. 746-9.
14
29. Juskelis, R., et al., Arsenic speciation in rice cereals for infants. J Agric Food Chem, 2013. 61(45): 15
p. 10670-6. 16
30. Singh, A., . Grundig, T., Ghebreslassie, M., Some baby foods sold in Canada would be 'illegal in 17
Europe,' arsenic testing shows. 2019, CBC.
18
31. Commission regulation (EU), 2015/1006 of 25 June 2015 amending Regulation (EC) No 19
1881/2006 as regards maximum levels of inorganic arsenic in foodstuffs. Official Journal of the
20
European Union, 2015. 21
32. US FDA, Proposes limit for inorganic arsenic in infant rice cereal. 2016. 22
33. Health Canada, Health Ca ada’s Proposal to Add Maxi u Levels for I orga ic Arse ic i 23
Polished (White) and Husked (Brown) Rice to the List of Contaminants and Other Adulterating
24
Substances in Foods. 2019.
25
34. FAO/WHO, Report of the eighth session of the codex comittee on contaminants in foods. 2014. 26
35. Petursdottir, A.H., J.J. Sloth, and J. Feldmann, Introduction of regulations for arsenic in feed and 27
food with emphasis on inorganic arsenic, and implications for analytical chemistry. Anal Bioanal
28
Chem, 2015. 407(28): p. 8385-96. 29
36. Toman, B. and A. Possolo, Laboratory effects models for interlaboratory comparisons. 30
Accreditation and Quality Assurance, 2009. 14(10): p. 553-563. 31
37. Musil, S., et al., Speciation without chromatography using selective hydride generation: 32
inorganic arsenic in rice and samples of marine origin. Analytical chemistry, 2014. 86(2): p.
993-33
999. 34
38. Chaney, R.L., C.E. Green, and S.J. Lehotay, Inter-laboratory validation of an inexpensive 35
streamlined method to measure inorganic arsenic in rice grain. Analytical and bioanalytical
36
chemistry, 2018. 410(22): p. 5703-5710. 37
39. Musil, S., et al., Speciation without chromatography using selective hydride generation: 38
inorganic arsenic in rice and samples of marine origin. Anal Chem, 2014. 86(2): p. 993-9.
39
40. Marschner, K., et al., Validation and inter-laboratory study of selective hydride generation for 40
fast screening of inorganic arsenic in seafood. Anal Chim Acta, 2019. 1049: p. 20-28.
41
41. Taylor, V., et al., Human exposure to organic arsenic species from seafood. Sci Total Environ, 42
2017. 580: p. 266-282. 43
42. Wolle, M.M. and S.D. Conklin, Speciation analysis of arsenic in seafood and seaweed: Part I-44
evaluation and optimization of methods. Anal Bioanal Chem, 2018. 410(22): p. 5675-5687.
45
43. Wolle, M.M., S.D. Conklin, and J. Wittenberg, Matrix-induced transformation of arsenic species 46
in seafoods. Anal Chim Acta, 2019. 1060: p. 53-63.
47
44. Shen, S., et al., Arsenic binding to proteins. Chem Rev, 2013. 113(10): p. 7769-92. 48
19
45. Raml, R., W. Goessler, and K.A. Francesconi, Improved chromatographic separation of thio-1
arsenic compounds by reversed-phase high performance liquid chromatography-inductively
2
coupled plasma mass spectrometry. J Chromatogr A, 2006. 1128(1-2): p. 164-70.
3
46. Conklin, S.D., et al., Investigation of the pH effects on the formation of methylated thio-4
arsenicals, and the effects of pH and temperature on their stability. Journal of Analytical Atomic
5
Spectrometry, 2008. 23(5): p. 711-716. 6
47. Calatayud, M., et al., Transformation of arsenic species during in vitro gastrointestinal digestion 7
of vegetables. J Agric Food Chem, 2013. 61(49): p. 12164-70.
8
48. Maher, W.A., et al., Measurement of arsenic species in environmental, biological fluids and food 9
samples by HPLC-ICPMS and HPLC-HG-AFS. Journal of Analytical Atomic Spectrometry, 2015.
10
30(10): p. 2129-2183.
11
49. Feldmann, J. and E.M. Krupp, Critical review or scientific opinion paper: arsenosugars--a class of 12
benign arsenic species or justification for developing partly speciated arsenic fractionation in
13
foodstuffs? Anal Bioanal Chem, 2011. 399(5): p. 1735-41.
14
50. Francesconi, K.A. and D. Kuehnelt, Determination of arsenic species: a critical review of methods 15
and applications, 2000-2003. Analyst, 2004. 129(5): p. 373-95.
16
51. Heitkemper, D.T., et al., Survey of total arsenic and arsenic speciation in US-produced rice as a 17
reference point for evaluating change and future trends. Food Addit Contam Part B Surveill,
18
2009. 2(2): p. 112-20. 19
52. DerSimonian, R. and N. Laird, Meta-analysis in clinical trials. Controlled clinical trials, 1986. 7(3): 20
p. 177-188. 21
53. Standardization, I.O.f., ISO Guide 35, Reference materials — Guidance for characterization and 22
assessment of homogeneity and stability. 2017, ISO copyright office: Switzerland.
23
54. Willie, S., et al., DORM-4: Fish protein certified reference material for trace metals. 2012, 24
National Research Council of Canada. https://nrc.canada.ca/en/certifications-evaluations-25
standards/certified-reference-materials/list/49/html 26
55. Yang, L., et al., DOLT-5: Dogfish Liver Certified Reference Material for Trace Metals and other 27
Constituents. 2014, National Research Council of Canada.
28
https://nrc.canada.ca/en/certifications-evaluations-standards/certified-reference-29
materials/list/40/html 30
56. Kumkrong, P., et al., PRON-1: River prawn Certified Reference Material for trace metals and 31
arsenobetaine. 2016, National Research Council of Canada.
32
https://nrc.canada.ca/en/certifications-evaluations-standards/certified-reference-33
materials/list/45/html 34
57. Kumkrong, P., et al., SQID-1: Cuttlefish certified reference material for trace metals, 35
arsenobetaine, and methylmercury. 2016, National Research Council of Canada.
36
https://nrc.canada.ca/en/certifications-evaluations-standards/certified-reference-37
materials/list/31/html 38
58. GUM, Guide to the Expression of Uncertainty in Measurement. 39
40
20
Graphic Abstract
1
CRM rapid response approach for the certification of arsenic species and toxic trace elements in baby
1
cereal coarse rice flour certified reference material BARI-1
2
Zuzana Gajdosechova1, Patricia Grinberg*1,Kenny Nadeau1 Lu Yang1, Juris Meija1, Hakan Gürleyük2, Ben J. 3
Wozniak2, Joerg Feldmann3, Laurie Savage3, Suladda Deawtong4, Paramee Kumkrong1, 4, Kevin Kubachka5, 4
Zoltan Mester1 5
6
1 National Research Council Canada, 1200 Montreal Rd, Ottawa ON K1A 0R6, Canada 7
2 Brooks Applied Labs, 18804 North Creek Parkway, Suite 100, Bothell, WA 98011, USA 8
3 University of Aberdeen, TESLA, Aberdeen AB24 3UE, Scotland, UK 9
4 Thailand Institute of Scientific and Technological Research, 35 Mu 3 Tambon Khlong Ha, Amphoe Khlong 10
Luang, Pathum Thani 12120, Thailand 11
5 US FDA Forensic Chemistry Center, 6751 Steger Drive, Cincinnati, OH 4523, USA 12
13
* Corresponding author: [email protected] 14 15 16 17
Supporting information
18 191
Instrumentation used at Lab 1
2
All samples and standards preparations and dilutions was conducted in a class 100 clean room or in 3
fume hoods of class 10 air quality. All plastic and glass labware, was cleaned by immersion in 5% (v v-1) 4
HNO3 for at least 24 hours and thoroughly rinsed with DIW before use. Nitric acid was purified in-house 5
by sub-boiling distillation of reagent grade feedstock in a quartz still. High purity deionized water (DIW) 6
was produced by reverse osmosis of tap water followed by deionization (Barnstead/Thermolyne, 7
Dubuque, IA, USA) to yield an 18 M.cm resistance. Analytical grade hydrogen peroxide (Sigma Aldrich, 8
Canada), malonic acid (SigmaAldrich) and trifluoroacetic acid (SigmaAldrich) were also used. Natural 9
isotopic abundance As, Cd, Hg and Pb stock solutions at 1000-3000 mg kg-1 were prepared by dissolving 10
NRC traceable high purity metals, previously characterized by glow discharge mass spectrometry (GDMS) 11
for purity (>99.9 %), in high purity HNO3 or mixture of HNO3 and HCl and diluted with DIW. For As 12
speciation salts of arsenic pentoxide (AsV, AlfaAeser, purity 99.9%), dimethylarsenic acid (DMA, 13
SigmaAldrich, purity 99.0+%) and arsenic trioxide (AsIII, Aldrich Chemical Company) were dissolved in DIW. 14
Enriched 111Cd, 201Hg and 207Pb isotopes, purchased from Oak Ridge National Laboratory (Oak Ridge, TN, 15
USA) or Trace Sciences International (Richmond Hill, ON, Canada), were dissolved in high purity HNO3 or 16
mixture of HNO3 and HCl and diluted with DIW to prepare spike stock solutions. NIST SRM 1568b rice 17
flour, NRC CRM DORM-4 fish protein, NRC CRM SQID-1 cuttlefish and NMIJ CRM 7532a Arsenic 18
Compounds and Trace Elements in Brown Rice Flour were used for method validation. 19
20
Total metals analysis
21
A Multiwave 3000® microwave sample preparation system (Anton Paar, Graz, Austria), equipped with 22
Conventional PTFE-TFM liner vessels was used for microwave-assisted acid digestion prior to total 23
elemental analysis. Samples were digested in closed vessels for 15 min ramping to 1400 W and holding 24
for 30 min, then 0 W for the cool down cycle (35 min). After digestion, samples were evaporated in class 25
10 fume hood and re-constituted in 2% HNO3. A high-resolution ICP-MS Element XR (Thermo Fisher 26
Scientific, Bremen, Germany) equipped with a combination of cyclonic and scott-type spray chamber and 27
50 L min-1 MCN50 PFA nebulizer (Elemental Scientific, Omaha, USA) was used. A plug-in quartz torch with 28
a quartz injector and a platinum guard electrode were also used. The Element XR was equipped with a 29
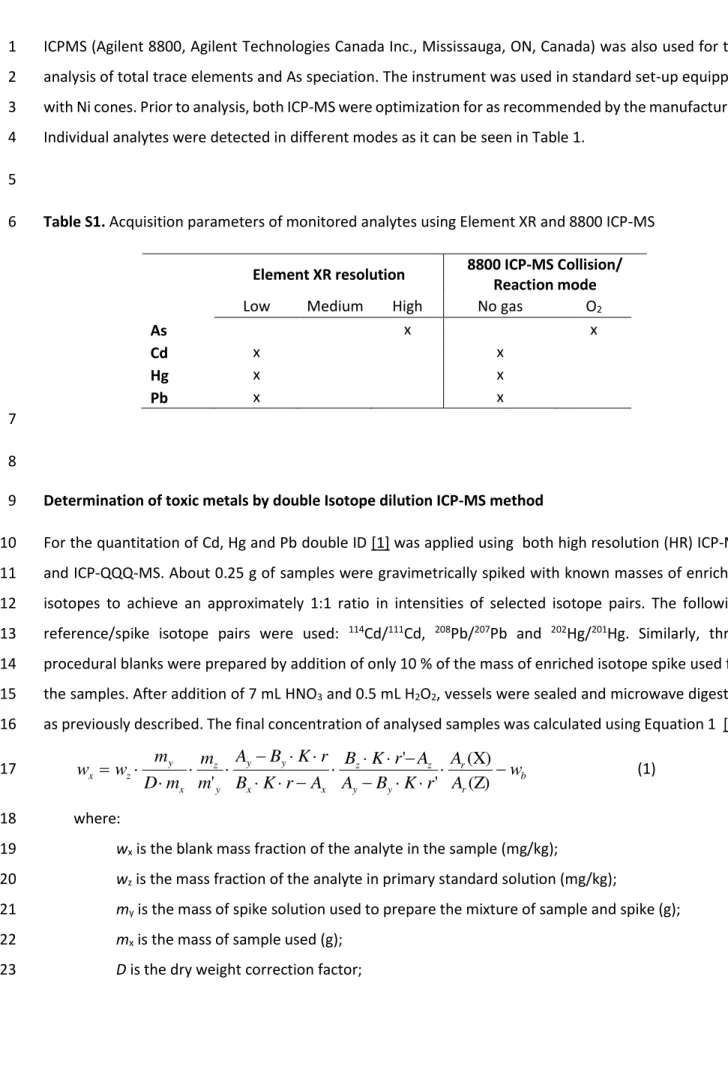
Faraday cup detector in addition to the secondary electron multiplier (SEM) detector. A triple quadrupole 30
ICPMS (Agilent 8800, Agilent Technologies Canada Inc., Mississauga, ON, Canada) was also used for the 1
analysis of total trace elements and As speciation. The instrument was used in standard set-up equipped 2
with Ni cones. Prior to analysis, both ICP-MS were optimization for as recommended by the manufacturer. 3
Individual analytes were detected in different modes as it can be seen in Table 1. 4
5
Table S1. Acquisition parameters of monitored analytes using Element XR and 8800 ICP-MS
6
Element XR resolution 8800 ICP-MS Collision/ Reaction mode
Low Medium High No gas O2
As x x Cd x x Hg x x Pb x x 7 8
Determination of toxic metals by double Isotope dilution ICP-MS method
9
For the quantitation of Cd, Hg and Pb double ID [1] was applied using both high resolution (HR) ICP-MS 10
and ICP-QQQ-MS. About 0.25 g of samples were gravimetrically spiked with known masses of enriched 11
isotopes to achieve an approximately 1:1 ratio in intensities of selected isotope pairs. The following 12
reference/spike isotope pairs were used: 114Cd/111Cd, 208Pb/207Pb and 202Hg/201Hg. Similarly, three 13
procedural blanks were prepared by addition of only 10 % of the mass of enriched isotope spike used for 14
the samples. After addition of 7 mL HNO3 and 0.5 mL H2O2, vessels were sealed and microwave digested 15
as previously described. The final concentration of analysed samples was calculated using Equation 1 [1]. 16 b r r y y z z x x y y y z x y z x w A A r K B A A r K B A r K B r K B A m m m D m w w (Z) (X) ' ' ' (1) 17 where: 18
wx is the blank mass fraction of the analyte in the sample (mg/kg); 19
wz is the mass fraction of the analyte in primary standard solution (mg/kg); 20
my is the mass of spike solution used to prepare the mixture of sample and spike (g); 21
mx is the mass of sample used (g); 22
D is the dry weight correction factor;
mz is the mass of primary assay standard used (g); 1
my is the mass of spike used to prepare the mixture of spike and primary assay standard (g); 2
Ay is the abundance of the reference isotope in the spike; 3
By is the abundance of the spike isotope in the spike; 4
Ax is the abundance of the reference isotope in the sample; 5
Bx is the abundance of the spike isotope in the sample; 6
Az is the abundance of the reference isotope in the primary assay standard; 7
Bz is the abundance of the spike isotope in the primary assay standard; 8
K is the mass bias correction factor;
9
r is the measured reference/spike isotope ratio in the mixture solution of sample and spike;
10
r is the measured reference/spike isotope ratio in the mixture solution of spike and primary
11
assay standard; 12
Ar(X) is the atomic weight of the analyte element in the sample; 13
Ar(Z) is the atomic weight of the analyte element in primary assay standard; 14
wb is the mass fraction of the analyte in the procedural blank (mg/kg) calculated using an 15
expression identical to equation 1 wherein only the first term on the right hand side is used 16
and the subscripted variables refer to the relevant blank parameters. 17
18
The measurement equation can be simplified to equation 2 for all elements whose isotopic 19
abundances are invariant in nature (and therefore Ax = Az = Axz, Bx = Bz = Bxz, Ar(X) = Ar(Z)): 20 b y y xz xz xz xz y y y z x y z x w r K B A A r K B A r K B r K B A m m m D m w w ' ' ' (2) 21 22
Determination of total As by standard addition ICP-MS at NRC
23
For determination of As we used a three-point standard addition calibration method and Equation 3 was 24
used for the calculation of mass fraction of As [2, 3] 25
a
m
m
m
m
I
b
m
m
m
w
m
s i x xf
i d0 i -df i s i f i s std i std and wx a (3) 26 where: 27wx is the mass fraction of the analyte in the sample (µg kg-1); 28
wstd is the mass fraction of the analyte in the primary standard solution (µg kg-1); 1
Ii is the measured intensity in the prepared set of samples, i=0, 1, 2; 2
mstd-i is the mass of natural abundance standard added to the spiked sample (g), i=1, 2; 3
ms-i is the mass of aliquot of diluted sample used to prepared spiked sample (g), i=1, 2; 4
msf-i is the final mass of spiked sample (g), i=1, 2; 5
mdf-i is the final mass of diluted set of samples (g), i=0, 1, 2; 6
md0-i is the mass of aliquots of spiked samples for dilution (g), i=0, 1, 2; 7
md0-f is the final mass of aliquots of spiked samples after dilution (g), i=0, 1, 2; 8
mx is the mass (g) of the original sample; 9
mxf is the final mass of the original sample after addition of enriched spikes and 1% HNO3 (g). 10
11
In addition, errors-in-variables regression was used to obtain uncertainty [4]. 12
For As speciation, accurately weighted 1 g of sample was placed into 50 mL tube and extracted in 20 mL 13
of trifluoroacetic acid (0.02 M) containing 1% H2O2 following a previously published method [5]. Samples 14
were extracted at 95°C for 1 hours in water bath. Once cooled to room temperature, the samples were 15
centrifuges at 3000 g for 15 minutes and aliquot of 2.5 mL was accurately weighted and transferred into 16
a new vial for standard addition. Three sub-samples of NIST 1568b SRM were treated in the same way and 17
one method blank was used for monitoring As contamination. Standard additions were performed using 18
a traceable arsenic pentoxide as iAs and DMA at concentrations 1x, 2x, and 3x the native sample 19
concentration, based on preliminary testing. The information value of MMA was determined from 20
external calibration using calibration standard prepared from arsenic trioxide. All calibration standards, 21
As(V), As(III) and DMA were cross-calibrated against high purity As standard. Aliquot of each standard was 22
acid digested and analysed in high resolution mode by ICP-MS Element 2. 23
Chromatographic separation and quantitation of individual As species was achieved by coupling Agilent 24
1200 Series HPLC (Agilent Technologies, Mississauga, Ontario) to Agilent 8800 ICP-MS (Agilent 25
Technologies, Mississauga, Ontario). Arsenic species were eluted from Hamilton PRP x-100 strong anion 26
exchange column (250 mm x 4.6 mm, 5 µm packing) with guard cartridge (Chromatographic Specialties, 27
Brockville, Ontario) using isocratic elution with 2 mM malonic acid (pH 5.6) and flow rate of 1 mL min-1. 1
Nominal mass values 91 following the mass shift from 75 was monitored by ICP-MS to confirm the 2
presence of As in chromatographic peaks. Additionally, m/z 71 was used as internal standard to monitor 3
plasma stability during the analysis. Agilent MassHunter Quantitative Analysis software was used for 4
integration of chromatograms. 5
6
Moisture content analysis
7
Three sub-samples of the material (approximately 0.5 to1 g) are weighed into clean glass weighing bottles 8
and placed in the vacuum oven. The room temperature oven was evacuated and maintained below 25 9
mm Hg to dry the sample to a constant mass. Once dry, the sample weight was recorded to obtain the 10
mass loss. The average result from the individual sub-samples was used. 11
12
As species stability testing
13
Short term isochronous stability study was carried out in accordance of ISO Guide 35 [6]. Briefly, one unit 14
was kept in the freezer at -20 °C as a reference unit. Three units were placed in the refrigerator at 4 °C 15
and three units were place in the oven at 37 °C. After 1 week a unit was moved from the refrigerator and 16
oven to the freezer. This process was repeated after 2 and 4 weeks and all units were analysed at the 17
same time. 18
19
Mercury cleaning procedure
20
Microwave digestion vessels were soaked in 10% HNO3 overnight, followed by overnight heating at 105 21
°C. All ICP-MS introduction system was rinsed with 5% HNO3 containing 1% 2-mercaptoethanol for 30 min 22
prior to analysis. 23
24
Traceability of calibration standards
25
The certified values are metrologically traceable to the SI through gravimetrically prepared standards of 26
established purity which purities were established by GD-MS at NRC and international measurement 27
intercomparisons. Purity assessment by GD-MS was performed by determining each of the elemental 1
impurity mass fractions (i.e., we
M) presented in the high purity primary standards and subtracting their 2
sum from the ideal value of 1 kg kg-1. With GD-MS analysis, it is possible to provide, with the exception of 3
H and radioactive elements, full elemental coverage (including C, N and O) with low to sub-ng g-1 detection 4
limits. For those elemental results that cannot be quantitatively determined, a limit of detection (LOD) is 5
reported. More information regarding the use of GD-MS for purity assessment can be found here [7]. For 6
those elements that NRC does not have primary standards assessed by GD-MS, NIST SRMs were used 7
(NIST SRM 3133 Hg for Hg). For traceability of As species, no primary standards traceable to SI is currently 8
available. Thus, commercially available standards were cross-calibrated against NRC primary As standard. 9
10
Determination of trace metals by Lab 2
11
Samples were digested using AOAC 2015.01 [8]. In short, 0.25-0.5 g of sample was digested using a mixture 12
of concentrated HNO3 and 30% H2O2 in CEM Mars Express microwave. The digested samples were brought 13
up to volume with DIW and analyzed using an Agilent 8800 ICP-QQQ-MS for As, Cd, and Pb and by Brooks 14
Rand Merx-T for Hg. 15
Inorganic As was extracted from the samples using the FDA Elemental Analysis Manual Method 4.11 [9] 16
with minor modifications. Approximately 0.5-1 g of sample was extracted with dilute HNO3 and H2O2 on a 17
hot block (Environmental Express) at 90°C for 2 hours. The extracts were brought up to volume with DIW, 18
filtered through a 0.45 μm filter and then analyzed by IC-ICP-MS on an Agilent 7700 ICP-MS. 19
20
Traceability of calibration standards
21
All standards used were NIST traceable. Arsenic speciation standards were purchased from Spex, Inorganic 22
Ventures and High Purity Standards (AsIII, AsV, DMA and MMA). After receiving the standards, their purity 23
was confirmed by analyzing 3 different preparations in triplicate (n=9). Every analytical batch is verified 24
by standards from a second source (NIST Traceable) as well as reference materials (NIST 1640a + TMDA 25
70.2 and USGS T221) to validate our calibration. 26
27
Determination of trace metals by Lab 3