Somatosensory and auditory deviance detection for outcome
1prediction during post-anoxic coma
2 3 4SUPPLEMENTAL MATERIAL
5 6Christian Pfeiffer1*, Nathalie Ata Nguepno Nguissi1, Magali Chytiris1, Phanie Bidlingmeyer1, 7
Matthias Haenggi2, Rebekka Kurmann3, Frédéric Zubler3, Mauro Oddo4, Andrea O. Rossetti5,
8
Marzia De Lucia1 9
10
1 Laboratoire de Recherche en Neuroimagerie (LREN), University Hospital (CHUV) & 11
University of Lausanne, Switzerland 12
2 Department of Intensive Care Medicine, Inselspital, Bern University Hospital, University of 13
Bern, Switzerland 14
3 Department of Neurology, Inselspital, Bern University Hospital, University of Bern, 15
Switzerland 16
4 Department of Intensive Care Medicine, University Hospital (CHUV) & University of 17
Lausanne, Switzerland 18
5 Neurology Service, University Hospital (CHUV) & University of Lausanne, Switzerland 19
1. Supplemental Methods 21
1.1. Auditory and Tactile Stimulation Protocols 22
Each patient was presented with an auditory and a tactile MMN protocol. The auditory 23
protocol (described previously in 1, 2) consisted of a series of 16-bit stereo sinusoidal tones, 24
sampled at 44.1 kHz, with a 10-ms linear amplitude envelope at onset and offset to avoid 25
clicks was presented at 75 db loudness on in-ear stereo headphones (model ER-4P, Etymotic 26
Research). Sounds were presented in three identical blocks of 500 stimuli for each recording. 27
In each block there were 350 “standard” sounds (70% of the total) consisting of 1000 Hz 28
tones with 100 ms duration and 0 ms interaural difference. The standard sounds were replaced 29
pseudorandomly by three types of “deviant” sounds, which differed from the standard ones 30
with respect to their pitch, duration, or location. There were 50 deviant sounds of each type in 31
one block. Duration deviants were 1000 Hz, with 150 ms duration and 0 ms interaural 32
difference. Pitch deviants were 1200 Hz tones with 100 ms duration and 0 ms interaural 33
difference. Deviants in location were 1000 Hz tones, with 100 ms duration and 700 µs 34
interaural difference, with the left ear leading. Sounds were presented at a fixed 750 ms inter-35
stimulus interval. We always recorded three blocks during the first day recording and three 36
blocks during the second day recording, resulting thus in 1500 presented stimuli per recoding. 37
After having completed the auditory protocol, each patient was presented with the 38
tactile MMN protocol. A vibrotactile stimulator (g.VIBROstim, Guger Technologies, Graz, 39
Austria, 13500 rpm maximum speed, 22.5 ms until maximum rotation) was attached to the 40
left index finger of the patient and vibro-tactile stimuli of 100-ms (‘standard’ stimulus) or 41
150-ms duration (‘deviant’ stimulus) were presented in a pseudorandom order in two blocks 42
consisting each of 400 standard (80% of the total) and 100 deviant (20% of the total) stimuli. 43
Only one type of deviant (duration) was presented for the tactile stimulation protocol, because 44
in healthy subjects the duration deviant is highly detectable, easy to administer, and duration 45
deviants for the auditory protocol showed highly informative about patient’s outcome in our 46
previous studies 1, 2. 47
48
1.2. EEG Acquisition and Preprocessing 49
Each patient had two EEG recordings at bedside in the intensive care unit. The first 50
recording took place within 24 hours after coma onset during TTM and the second recording 51
at approximately 36-48 hours after coma onset after withdrawal of TTM, off sedation. A g.tec 52
EEG system (i.e. g.HIamp, Guger Technologies, Graz, Austria) with a sampling rate of 1200 53
Hz and 62 active electrodes placed according to the 10-20 system was used. In order to allow 54
comparison between the present results and previous studies using the same auditory 55
stimulation protocol, we restricted the analysis to 19 EEG channels corresponding to the 56
clinical EEG montage used in 1, 2. Across all patients the impedances were kept <10 kΩ and 57
the data was referenced online to the Fpz electrode and in the course of preprocessing the 58
average reference was computed. We preprocessed the EEG data offline using the same 59
procedure as in 1-3. We extracted EEG responses to deviant stimuli and an equal number of 60
responses to standard stimuli for the auditory and tactile protocols across all experimental 61 blocks. 62 63 2. Supplemental Results 64
2.1. Outcome Prediction for Patients Without Epileptiform Features 65
Out of the 66 patients included for the main analysis, 11 (17%) had an EEG with 66
epileptiform features either on the first day (2 patients, 3%), on the second day (3 patients, 67
5%), or on both days following CA (7 patients, 9%). Because such epileptiform activity has 68
been shown to increase the false positive rate for outcome prediction base on our method 1, 3, 69
we report in Table S1 the outcome prediction results based on the auditory and tactile 70
protocol for a reduced sample of 55 patients without epileptiform features (11 women, age 71
mean = 65 years, SD = 13 years) out of which 39 (71%) had a good outcome and 16 (29%) a 72
poor outcome. 73
74
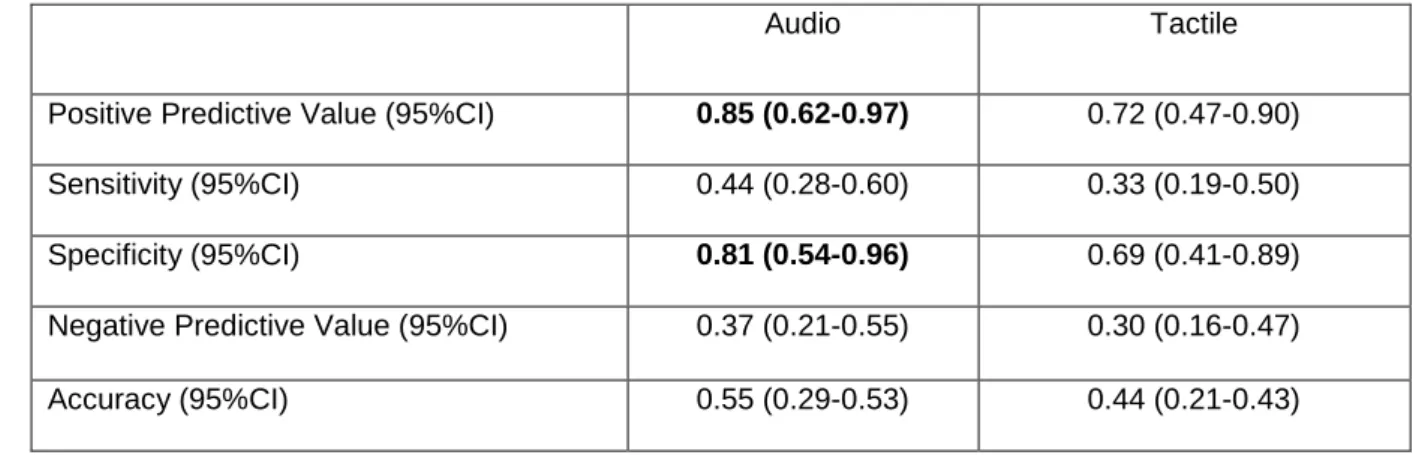
Table S1: Prognostic values for good outcome for comatose patients excluding those with epileptiform 75
features (n = 55) based on the progression of auditory and tactile discrimination. Values above chance
76
level are highlighted in bold.
77
Audio Tactile
Positive Predictive Value (95%CI) 0.85 (0.62-0.97) 0.72 (0.47-0.90) Sensitivity (95%CI) 0.44 (0.28-0.60) 0.33 (0.19-0.50) Specificity (95%CI) 0.81 (0.54-0.96) 0.69 (0.41-0.89) Negative Predictive Value (95%CI) 0.37 (0.21-0.55) 0.30 (0.16-0.47) Accuracy (95%CI) 0.55 (0.29-0.53) 0.44 (0.21-0.43)
78
2.2. Outcome Prediction Based on Different Auditory Deviants 79
The auditory discrimination analysis in the main text was based on the average decoding 80
performance across three deviants (duration, location, and pitch), whereas tactile 81
discrimination analysis was based on a single deviant (duration) tested. To allow a direct 82
comparison of tactile discrimination results we report below and in Table S2 outcome 83
prediction results separately for the auditory duration, location, and pitch deviant. 84
Duration deviant. The average decoding performance for 41 Survivors was AUCDAY1
85
= 0.605 ± 0.007 and AUCDAY2 = 0.626 ± 0.007, and for the 25 Non-Survivors decoding
86
performance was AUCDAY1 = 0.619 ± 0.010 and AUCDAY2 = 0.608 ± 0.009. The progression
87
of decoding performance from Day 1 to Day 2 showed a 72% positive predictive value (95% 88
CI = 0.55 – 0.86; Table S2). 89
Location deviant. The average decoding performance for 41 Survivors of AUCDAY1 = 90
0.610 ± 0.006 and AUCDAY2 = 0.616 ± 0.008, and for the 25 Non-Survivors decoding
91
performance was AUCDAY1 = 0.631 ± 0.006 and AUCDAY2 = 0.607 ± 0.009. The progression
92
of decoding performance from Day 1 to Day 2 showed a 76% positive predictive value (95% 93
CI = 0.55 – 0.91). 94
Pitch deviant. The average decoding performance for 41 Survivors of AUCDAY1 = 95
0.629 ± 0.008 and AUCDAY2 = 0.607 ± 0.007, and for the 25 Non-Survivors decoding
96
performance was AUCDAY1 = 0.629 ± 0.012 and AUCDAY2 = 0.627 ± 0.012. The progression
97
of decoding performance from Day 1 to Day 2 showed a 63% positive predictive value (95% 98
CI = 0.41 – 0.81). 99
Thus, the above-chance level predictive value for good outcome in the main analysis 100
was driven by the high positive predictive values of the duration and location deviant. A 101
similar result, in particular for duration deviants, was previously observed by Tzovara et al. 102
(2013). 103
104
105
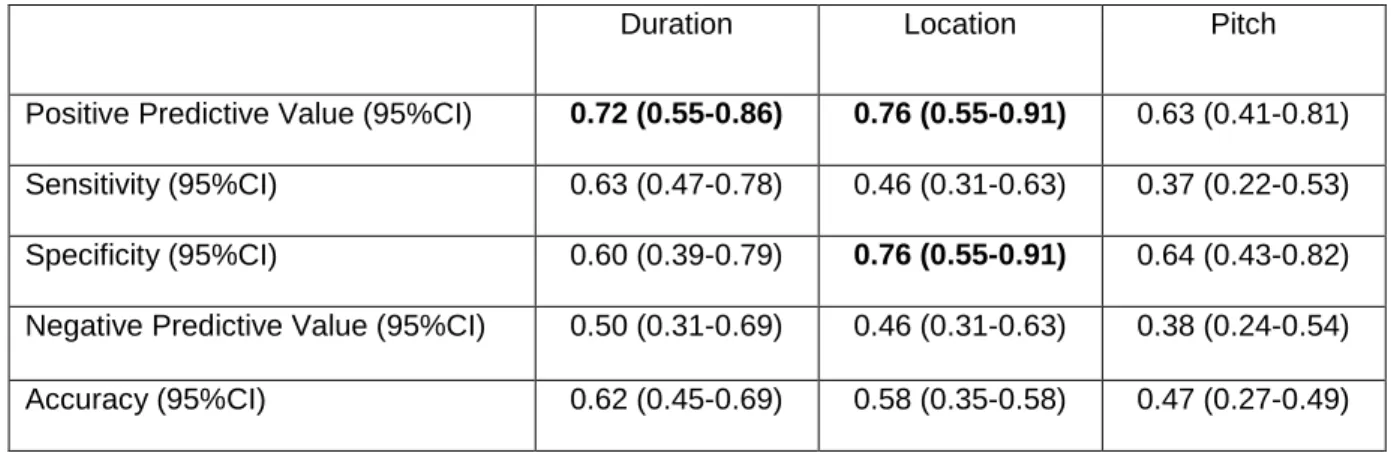
Table S2: Prognostic values for good outcome for comatose patients based on the progression of 106
auditory discrimination shown separately for duration, location, and pitch deviant. Values above
107
chance level are highlighted in bold.
108
Duration Location Pitch
Positive Predictive Value (95%CI) 0.72 (0.55-0.86) 0.76 (0.55-0.91) 0.63 (0.41-0.81) Sensitivity (95%CI) 0.63 (0.47-0.78) 0.46 (0.31-0.63) 0.37 (0.22-0.53) Specificity (95%CI) 0.60 (0.39-0.79) 0.76 (0.55-0.91) 0.64 (0.43-0.82) Negative Predictive Value (95%CI) 0.50 (0.31-0.69) 0.46 (0.31-0.63) 0.38 (0.24-0.54) Accuracy (95%CI) 0.62 (0.45-0.69) 0.58 (0.35-0.58) 0.47 (0.27-0.49)
3. Clinical Characteristics 110
We compared demographics and clinical characteristics between patients showing an 111
increase and patients showing a decrease of decoding performance separately for Survivors (n 112
= 35, Table 3) and Non-Survivors (N = 25, Table 4) and to assess if additional factors 113
contributed to the outcome prediction results. There were no differences in gender 114
distribution, age, CA etiology, return of spontaneous circulation (ROSC), presence/absence of 115
brainstem reflexes, latency of clinical EEG assessment and in the majority of semi-116
quantitative markers of EEG (i.e. discontinuity, reactivity). However, for Non-Survivors we 117
observed a difference regarding the presence of epileptiform EEG. Out of the 7 Non-118
Survivors showing an increase, 5 (71%) had an epileptiform first EEG, whereas out of the 18 119
Non-Survivors showing a decrease, this only occurred in 5 (28%). Thus, in line with our 120
previous study, the increase of decoding performance in these patients (and therefore the 121
occurrence as false positives) can be somewhat related to epileptiform activity 1. 122
123
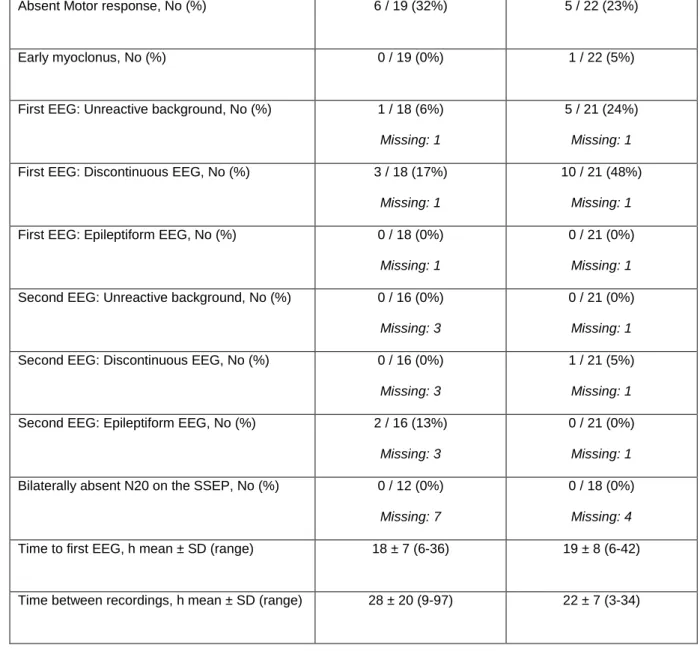
Table S3: Clinical description of Survivors (n = 41), split according to whether from Day 1 to Day 2 124
their decoding performance for the auditory protocol increased or decreased.
125 Survivors with Increase, n = 19 Survivors with Decrease, n = 22 Female gender, No (%) 2 / 19 (11%) 4 / 22 (18%)
Age, yr mean ± SD (range) 62 ± 14 (18-83) 66 ± 14 (27-86)
Time to ROSC, min mean ± SD (range) 22 ± 15 (8-60) 18 ± 13 (3-45)
Non cardiac etiology, No (%) 6 / 19 (32%) 5 / 22 (23%)
Absent Pupillary reflex, No (%) 1 / 19 (5%) 0 / 22 (0%)
Absent Motor response, No (%) 6 / 19 (32%) 5 / 22 (23%)
Early myoclonus, No (%) 0 / 19 (0%) 1 / 22 (5%)
First EEG: Unreactive background, No (%) 1 / 18 (6%) Missing: 1
5 / 21 (24%) Missing: 1 First EEG: Discontinuous EEG, No (%) 3 / 18 (17%)
Missing: 1
10 / 21 (48%) Missing: 1 First EEG: Epileptiform EEG, No (%) 0 / 18 (0%)
Missing: 1
0 / 21 (0%) Missing: 1 Second EEG: Unreactive background, No (%) 0 / 16 (0%)
Missing: 3
0 / 21 (0%) Missing: 1 Second EEG: Discontinuous EEG, No (%) 0 / 16 (0%)
Missing: 3
1 / 21 (5%) Missing: 1 Second EEG: Epileptiform EEG, No (%) 2 / 16 (13%)
Missing: 3
0 / 21 (0%) Missing: 1 Bilaterally absent N20 on the SSEP, No (%) 0 / 12 (0%)
Missing: 7
0 / 18 (0%) Missing: 4 Time to first EEG, h mean ± SD (range) 18 ± 7 (6-36) 19 ± 8 (6-42)
Time between recordings, h mean ± SD (range) 28 ± 20 (9-97) 22 ± 7 (3-34)
126 127
Table S4: Clinical description of Non-Survivors (n = 25), split according to whether from Day 1 to Day 128
2 their decoding performance increased or decreased.
129 Non-Survivors with Increase, n = 7 Non-Survivors with Decrease, n = 18 Female gender, No (%) 2 / 7 (29%) 6 / 18 (33%)
Age, yr mean ± SD (range) 67 ± 11 (46-80) 65 ± 11 (45-86)
Non cardiac etiology, No (%) 2 / 7 (29%) 4 / 16 (25%) Missing: 2 Absent Pupillary reflex, No (%) 1 / 6 (17%)
Missing: 1
3 / 16 (19%) Missing: 2 Absent Corneal reflex, No (%) 4 / 6 (67%)
Missing: 1
9 / 16 (56%) Missing: 2 Absent Motor response, No (%) 6 / 6 (100%)
Missing: 1 14 / 16 (88%) Missing: 2 Early myoclonus, No (%) 0 / 6 (0%) Missing: 1 9 / 16 (56%) Missing: 2 First EEG: Unreactive background, No (%) 5 / 6 (83%)
Missing: 1
15 / 17 (88%) Missing: 1 First EEG: Discontinuous EEG, No (%) 5 / 6 (83%)
Missing: 1
14 / 17 (82%) Missing: 1 First EEG: Epileptiform EEG, No (%) 3 / 6 (50%)
Missing: 1
5 / 17 (29%) Missing: 1 Second EEG: Unreactive background, No (%) 4 / 5 (80%)
Missing: 2
9 / 15 (60%) Missing: 3 Second EEG: Discontinuous EEG, No (%) 3 / 5 (60%)
Missing: 2
6 / 15 (40%) Missing: 3 Second EEG: Epileptiform EEG, No (%) 2 / 5 (40%)
Missing: 2
5 / 15 (33%) Missing: 3 Bilaterally absent N20 on the SSEP, No (%) 2 / 4 (50%)
Missing: 3
7 / 11 (64%) Missing: 7 Time to first EEG, h mean ± SD (range) 20 ± 6 (11-24) 22 ±11 (6-48)
Time between recordings, h mean ± SD (range) 28 ± 9 (20-44) 26 ± 11 (18-65)
130
131
References 132
1. Tzovara A, Rossetti AO, Juan E, et al. Prediction of awakening from hypothermic post 133
anoxic coma based on auditory discrimination. Annals of neurology. 2016 Feb 23;79(5):748– 134
57. 135
2. Tzovara A, Rossetti AO, Spierer L, et al. Progression of auditory discrimination based 136
on neural decoding predicts awakening from coma. Brain. 2013 Jan;136(Pt 1):81-9. 137
3. Pfeiffer C, Nguissi NA, Chytiris M, et al. Auditory discrimination improvement 138
predicts awakening of postanoxic comatose patients treated with targeted temperature 139
management at 36°C. Resuscitation. 2017. 140
141 142