ORIGINAL PAPER
Alex Gamma Æ Jules Angst Æ Vladeta Ajdacic Æ Dominique Eich Æ Wulf Ro¨ssler
The spectra of neurasthenia and depression: course, stability
and transitions
Received: 1 February 2006 / Accepted: 15 September 2006 / Published online: 25 November 2006
j
Abstract
Background Neurasthenia has had a
chequered history, receiving changing labels such as
chronic fatigue or Gulf war syndrome. Neurasthenia is
recognized by ICD-10, but not by DSM-IV. Its course,
longitudinal stability and relationship to depression is
not well understood. Methods In a stratified
com-munity sample (n = 591), representative of 2600
persons of the canton of Zurich, Switzerland,
neur-asthenia and depression were assessed in six
struc-tured interviews between ages 20 and 41. Course,
stability and comorbidity were examined. A severity
spectrum of neurasthenia and depression from
symptoms to diagnosis was taken into account.
Re-sults The annual prevalence of a neurasthenia
diag-nosis increased from 0.7% to 3.8% from age 22–41,
while mere symptoms became less prevalent.
Intra-individual courses improved in 40% and deteriorated
in about 30% of symptomatic cases. The most
fre-quent symptoms overall, besides criterial exhaustion,
were increased need for sleep, over-sensitivity,
ner-vousness and difficulty concentrating. Cross-sectional
associations and overlap with depression were strong.
Longitudinal stability of ICD-neurasthenia was low.
Conclusions Neurasthenia is intermittent, overlaps
significantly with depression, and shows
improve-ment and deterioration over time to roughly equal
measures.
j
Key words
neurasthenia Æ depression Æ prevalence
Æ
course Æ comorbidity Æ spectrum
Introduction
Neurasthenia is operationally defined by ICD-10 [
39
]
as a syndrome of mental fatigue and/or physical
exhaustion with a minimum duration of 3 months. Its
world-wide significance was definitely established by
the large prospective transcultural study of the WHO
in general health care [
25
,
32
]. In the United States it
is dealt with mainly as the neurological disorder
chronic fatigue syndrome (see review by Wessely
[
37
]) and is absent from the psychiatric classification
of DSM-IV (discussed by Morey and Kurtz [
22
]).
The history of neurasthenia has been summarised
by Steiner [
30
], Fischer-Homberger [
14
], Gosling [
16
],
Shorter [
29
], Wessely [
36
], Taylor [
31
] and Scha¨fer
[
26
,
27
]. According to Scha¨fer [
26
], neurasthenia was
an element of melancholia until the 17th century. In
the 18th century it was regarded as an element of
hypochondriasis, and became an independent
neu-ropsychiatric syndrome with Beard [
8
] and Van
Deusen [
33
]. Over the past two decades it has
con-tinued to change its labels in a chameleon-like fashion
in order to be socially acceptable and not
stigmatis-ing, overlapping with chronic fatigue syndrome,
myalgic encephalomyelitis [
36
], Gulf War syndrome
[
18
], burn-out syndrome [
15
], as well as with atypical
depression [
6
].
Most research has focussed on chronic fatigue, and
its symptoms have been studied internationally [
38
].
But it is plausible that a large number of patients also
suffer from acute, shorter and impairing fatigue
syndromes, as shown by earlier reports from the
Zurich Study [
1
,
7
,
21
]. Such a dimensional
neuras-thenia spectrum was also proposed early by Sharpe
et al. [
28
] and Pawlikowska et al. [
23
].
In the Zurich Study of a community sample the
neurasthenic syndrome was one of 30 psychological
and functional somatic syndromes assessed in six
interviews from the ages of 20–41 [
3
]. The data make
it possible to analyse symptoms of neurasthenia on a
EAPCN
699
A. Gamma (&) Æ J. Angst Æ V. Ajdacic Æ D. Eich Æ W. Ro¨ssler Zurich University Psychiatric Hospital
Research Department Lenggstr. 31 8032 Zurich, Switzerland Tel.: +41-44/384-2621 Fax: +41-44/384-2446 E-Mail: [email protected]
continuum from tiredness to severe physical and
mental fatigue and exhaustion (neurasthenia
spec-trum), its longitudinal development over 20 years and
its association with depression.
Methods
j Sample
The initial Zurich Study sample consisted of 4547 subjects (2201 men, 2346 women) representative of the canton of Zurich in Switzerland, who were screened with the Symptom Checklist 90-R (SCL-90-R; (17)). In order to increase the probability of including individuals at risk for psychiatric syndromes, a stratified subsample of 591 subjects (292 males, 299 females) was selected for interview, with 66% comprising individuals who scored above the 85th per-centile on the SCL-90-R Global Severity Index (‘high-risk group’), and 33% comprising a random sample of those scoring below the 85th percentile (‘low-risk group’). The 591 subjects are represen-tative of 2600 persons from the canton of Zurich. The initial screening was conducted in 1978, when the subjects were aged 19 (men) and 20 (women). Full interviews were conducted in 1979, 1981, 1986, 1988, 1993, and 1999, by trained clinical psychologists or psychiatrists in the participants’ homes. A broad spectrum of 30 psychiatric and somatic syndromes was assessed, including exhaustion/fatigue and depression [3]. The interviewers all had a degree in psychopathology. They were trained in group interviews and by learning from experienced interviewers during interviews in the participants’ homes.
j Neurasthenia interview
The stem questions were adapted to current ICD concepts of neurasthenia and were in 1993/1999: 1) ‘‘in the last 12 months, did you experience being physically exhausted, washed out, done in, shattered, even in situations of marginal physical effort?’’, and 2) ‘‘in the last 12 months, did you sometimes experience a pro-nounced mental exhaustion and fatigue, even in situations of marginal mental effort?’’ If one of the questions was answered with yes, 20 symptoms were checked and an open question asked for possible other symptoms; the symptoms are listed in Table2of the results section.
j Validity and reliability of interview
While we do not have data on the reliability of the interview section on neurasthenia, we have such data for the section on depression, which includes the ‘‘neurasthenic’’ items fatigue, lack of energy and motor slowing. In 1993, at the 5th interview of the Zurich study, an interrater-reliability analysis was conducted in eight raters who rated 22 participants using the depression section of the SPIKE interview. The percent interrater agreement on the presence/ab-sence of symptoms was 95.6%. The corresponding mean value of Kappa was 0.89, indicating almost perfect agreement [5].
In 1984, after the 2nd interview, the sensitivity of the stem question for depression was calculated in 90 outpatients, against two gold standards: (1) the presence/absence of an ICD diagnosis for depression in the patient’s medical history, and (2) the patient’s BDI score, with scores >7 indicating depression [20]. Sensitivity was 0.93 in the first, and 0.98 in the second case. Since the answer to the stem question decides on who will be questioned further on the particular syndrome, these sensitivies indicate that the SPIKE stem question captured almost all patients who had a confirmed diag-nosis of depression.
Taken together, we conclude that the SPIKE section on depression picks up the large majority of subjects at risk for depression, and that the assessment of these subjects’ symptoms by
the interviewers was reliable and consistent. We cannot answer the question for the neurasthenia section of the interview, but given the results for depression, we have no reason to doubt the reliability of the assessment of neurasthenic symptoms by our interviewers. j Diagnoses
Neurasthenia was defined by ICD-10 criteria [39] as a syndrome of mental fatigue and/or physical exhaustion with at least one of six criterial symptoms and a minimum duration of 3 months. No exclusion criteria were applied in order to allow us to study the associations with other syndromes. In the first interview (1979) 3-months neurasthenia was not yet assessed, only 1-month neuras-thenia and shorter manifestations.
No somatic examinations were conducted to ascertain potential somatic causes of neurasthenia. Only attributions of somatic causes by the participants were recorded, which are known not to be a reliable guide to the presence of objective somatic causes. Inspec-tion of the somatic causes reported by the subjects identified roughly three subjects per interview who might qualify for an or-ganic cause for neurasthenic manifestations. None of these causes belonged to those listed in the ICD’s exclusion criteria. Due to their small number and to the unreliability of causal attributions we did not exclude these subjects from analysis.
Our neurasthenic spectrum consists of: (1) 3-months neuras-thenia according to ICD-10, (2) 2-weeks neurasneuras-thenia [7], (3) recurrent brief neurasthenia (RBN) [1] and (4) neurasthenic symptoms. RBN required the presence of a neurasthenic syndrome of short duration (<2 weeks) occurring at least 12 times in the previous year. Our spectrum concept arose from the systematically collected data in all syndromal sections of the interview; after the stem questions and list of symptoms, the duration (maximum, average) and frequency of neurasthenic episodes were assessed for the last 12 months as well as the estimated number of days/year with neurasthenic symptoms. Neurasthenia subgroups were formed according to different duration, frequency and severity criteria and the resulting spectrum was validated using clinical indicators such as treatment and suicide attempt rates, comorbidity, work and social impairment [2,7,21].
Major depressive episodes (MDE) were defined according to DSM-III R and dysthymia according to DSM-IV, without the application of any exclusion criteria. Our definition of minor depression was strict, i.e. requiring not two but three to four of the nine criterial symptoms of depression and a duration of at least 2 weeks. Recurrent brief depression was defined by about monthly or more frequent episodes of depression lasting <2 weeks, by the presence of five or more of the nine criterial symptoms, plus work impairment (ICD-10).
The diagnosis of bipolar I disorder was similar to the original definition of Dunner et al. [12], i.e. the presence of mania requiring hospitalisation was necessary; bipolar II disorder required the presence of a major depressive episode (DSM-III R) and episodes of overactivity plus two of seven criterial hypomanic symptoms [4]. A diagnostic group of minor bipolar disorder (MinBP) was included in the bipolar spectrum concept, comprising dysthymia, minor and recurrent brief depression in association with two of seven criterial hypomanic symptoms, and the chronic form, cyclothymic disorder [4].
j Statistics
Prevalence rates were corrected for stratified sampling and weighted back to the population of 2600 subjects. We sometimes report ‘‘cumulative prevalence’’ rates, which is the prevalence cumulated over six interview years, i.e. the prevalence of ever having had a given syndrome/symptom in the 12 months preceding any of the interviews. Frequencies were compared across groups using v2-tests; Kruskal-Wallis tests were used for continuous data.
For the analysis of symptom frequency (Table2), in which several independent tests were carried out, we indicate which tests would be significant after Bonferroni correction.
To assess the longitudinal relationship between neurasthenia and depression, we ran a number of regression models. First, generalized estimating equations (GEE) models with dichotomous dependent and independent variables were run. GEE models in-clude the data from all time points of a longitudinal study. Our first model included 3-months neurasthenia as the dependent variable; the predictor variables were: 3-months neurasthenia at any previous interview, a major depressive episode (MDE) at the same interview, and MDE at any previous interview. A second model included MDE as the dependent variable and the predic-tors were: months neurasthenia at the same interview, 3-months neurasthenia at any previous interview, and MDE at any previous interview.
Variants of the two models were computed by replacing the predictor variables referring to any previous interview with pre-dictors referring only to the preceding interview (1st-order lag variables). Sex, risk group and time were additional predictors in all GEE models.
As a simple test for the adequacy of the models, we compared the results of running these models with and without requiring robust Standard Errors, and found very good agreement, i.e. no more than 10% difference in SEs, and identical patterns of statis-tical significance.
The GEE models accommodate the longitudinal dependence of observations by directly modeling the within-subject correla-tion structure of the data. In this case, we chose an independent correlation structure that assumes independent correlations of observations within a single individual between adjacent points in time, as recommended by Diggle et al. [11] for transition models.
Results
j
Frequency and prevalence of diagnostic sub-groups
Table
1
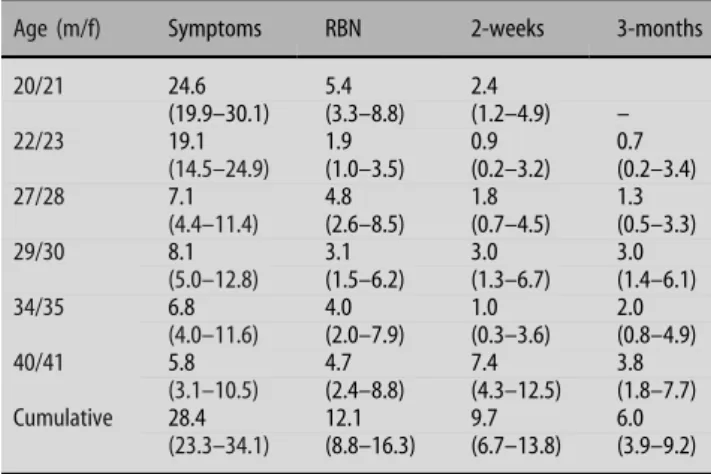
shows that there was an increase of the
one-year prevalence of 3-months neurasthenia from 0.7%
to 3.8% from the second to the sixth interview (ages
22–41 years), and a decrease in the group with
neurasthenic symptoms. RBN did not change clearly
(from 5.4% to 4.7%), whereas 2-weeks neurasthenia
increased from 2.4% to 7.4%. Across 20 years the
cumulative incidence rate of 3-months neurasthenia
was 6.0%, 5.5% for men and 6.5% for women (gender
ratio F:M = 1:2:1). Restricted to cases with work and/
or social impairment the cumulative incidence rate of
3-months neurasthenia remained 5.6%. The
preva-lence rate of treated 3-months neurasthenia was 3.2%,
which represents 53.1% of all cases.
j
Stem questions
The two stem questions of criterion A of ICD-10
(physical and mental exhaustion/fatigue) were
as-sessed separately in 1993 and 1999. Women
com-plained of suffering from both symptoms slightly
more often than men (prevalence rates 14.7% vs.
10.3%; P = 0.32); they reported physical exhaustion
twice as often as men (16.5% vs. 7.9%; P = 0.007),
whereas mental exhaustion was reported to a similar
extent by women and men (10.2% vs. 9.1%;
P < 0.77).
j
Symptoms
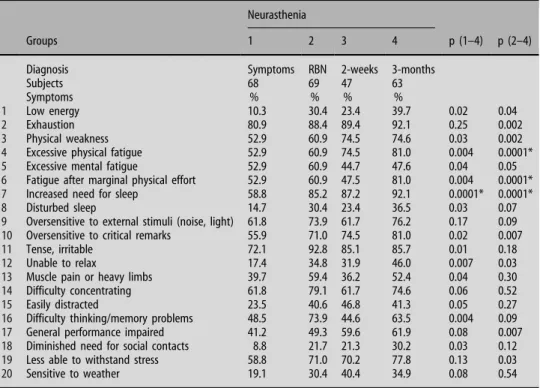
About 20 symptoms of neurasthenia, assessed during
the third to the sixth interview (age 28–41), are listed
in Table
2
for four groups: 3-months neurasthenia,
2-weeks neurasthenia, RBN and neurasthenic
symp-toms. 3-months neurasthenia generally had the
highest load of symptoms, whereas subjects with only
neurasthenic symptoms had the smallest load. The
profiles of RBN and 2-weeks neurasthenia were
roughly similar.
Apart from the characteristic symptoms of physical
and mental exhaustion with increased need for sleep,
the most frequent symptoms were over-sensitivity to
external stimuli and to critical remarks, tension and
difficulty concentrating. Over-sensitivity was also
accompanied by lower stress tolerance.
j
Longitudinal overlap between neurasthenia and
depression
The longitudinal overlap was strong. Fourty-four
(68.5%) of the 64 subjects who ever reported
3-months neurasthenia in any of the interviews also
ever reported MDE (OR = 4.5, 95% C.I. 2.5–7.9,
P < 0.001; Fig.
1
). Sixty to 79% of the subjects with
3-months neurasthenia had a previous or
sub-sequent episode of subthreshold or threshold mood
disorder. Twelve (18.8%) of the 64 cases with
3-months neurasthenia overlapped with dysthymia,
minor depression or recurrent brief depression.
3-months neurasthenia without anxiety (panic or
GAD) or mood disorder occurred in only 1.4% of
the sample. Thirty-seven (55.2%) of the 67 subjects
who ever suffered from 2-weeks neurasthenia ever
had MDE (OR = 3.3, 95% C.I. 2.0–5.4, P < 0.001). If
we include all subjects who ever reported symptoms,
316 (82.7%) of the 382 who ever reported
neuras-thenic symptoms also at some time reported
depressive symptoms (OR = 6.9, 95% C.I. 3.6–13.5,
P < 0.001).
Table 1 One-year and cumulated one-year prevalences (95% confidence intervals) of subgroups of neurasthenia across six interviews
Age (m/f) Symptoms RBN 2-weeks 3-months
20/21 24.6 5.4 2.4 (19.9–30.1) (3.3–8.8) (1.2–4.9) – 22/23 19.1 1.9 0.9 0.7 (14.5–24.9) (1.0–3.5) (0.2–3.2) (0.2–3.4) 27/28 7.1 4.8 1.8 1.3 (4.4–11.4) (2.6–8.5) (0.7–4.5) (0.5–3.3) 29/30 8.1 3.1 3.0 3.0 (5.0–12.8) (1.5–6.2) (1.3–6.7) (1.4–6.1) 34/35 6.8 4.0 1.0 2.0 (4.0–11.6) (2.0–7.9) (0.3–3.6) (0.8–4.9) 40/41 5.8 4.7 7.4 3.8 (3.1–10.5) (2.4–8.8) (4.3–12.5) (1.8–7.7) Cumulative 28.4 12.1 9.7 6.0 (23.3–34.1) (8.8–16.3) (6.7–13.8) (3.9–9.2)
j
Age and order of onset
Overall the age of onset of neurasthenic symptoms
was 20.1 ± 6.9 years; the four groups of
neurasthe-nia did not differ significantly in this respect
(P < 0.34). The onset of depressive symptoms
oc-curred on average four years earlier (15.9 ± 5.8
years). In 99 cases (18.3%), the age of onset of
neurasthenic and depressive symptoms was the
same (including an error margin of ±1 year), in 237
cases (43.7%) depression preceded neurasthenia, in
71 cases (13.1%) neurasthenia preceded depression,
while another 121 cases (22.3%) suffered only from
depression and 14 cases (2.6%) only from
neuras-thenia.
j
Course of diagnostic subgroups: changes on the
severity spectrum
We compared each subject’s first and last completed
interview (the first being for all subjects the one
completed at age 20, the last varying according to the
subject). 105 (27.3%) of all subjects who had ever
experienced any kind of neurasthenic manifestations
stayed in the same diagnostic subgroup, i.e. there was
no change in severity of the manifestation. 124
sub-jects (32.3%) switched to a more severe subgroup
between their first and last interviews and 155 (40.4%)
to a less severe subgroup.
In a more fine-grained analysis, we investigated
the change of neurasthenia subgroup between the
first and last completed interview, quantifying the
change in terms of units, with one unit
corre-sponding to one step up to the next, more severe,
subgroup of neurasthenia or down to the next, less
severe, subgroup. Subgroups in order of ascending
severity were ‘‘no neurasthenia’’, ‘‘neurasthenia
symptoms’’, ‘‘recurrent brief neurasthenia’’,
‘‘two-week neurasthenia’’, and ‘‘3-month neurasthenia’’.
For example, a subject who changed from recurrent
brief neurasthenia at the first interview to 3-months
neurasthenia at the last interview would be assigned
a change in severity of +2. Figure
2
shows the
histogram of severity changes. It is evident that by
far the most frequent classes were those subjects
who stayed in their neurasthenia subgroup, and
those who changed to the next lower (less severe)
subgroup. While overall, more subjects got better
than worse, considerably more ‘‘jumped’’ up two or
20 44 148 3-months neurasthenia MDE 66 316 157 Neurasthenia symptoms Depressive symptomsFig. 1 Longitudinal overlap of neurasthenia and depression Table 2 Frequency of symptoms of
neurasthenia in different subgroups Neurasthenia
Groups 1 2 3 4 p (1–4) p (2–4)
Diagnosis Symptoms RBN 2-weeks 3-months
Subjects 68 69 47 63
Symptoms % % % %
1 Low energy 10.3 30.4 23.4 39.7 0.02 0.04
2 Exhaustion 80.9 88.4 89.4 92.1 0.25 0.002
3 Physical weakness 52.9 60.9 74.5 74.6 0.03 0.002
4 Excessive physical fatigue 52.9 60.9 74.5 81.0 0.004 0.0001*
5 Excessive mental fatigue 52.9 60.9 44.7 47.6 0.04 0.05
6 Fatigue after marginal physical effort 52.9 60.9 47.5 81.0 0.004 0.0001*
7 Increased need for sleep 58.8 85.2 87.2 92.1 0.0001* 0.0001*
8 Disturbed sleep 14.7 30.4 23.4 36.5 0.03 0.07
9 Oversensitive to external stimuli (noise, light) 61.8 73.9 61.7 76.2 0.17 0.09
10 Oversensitive to critical remarks 55.9 71.0 74.5 81.0 0.02 0.007
11 Tense, irritable 72.1 92.8 85.1 85.7 0.01 0.18
12 Unable to relax 17.4 34.8 31.9 46.0 0.007 0.03
13 Muscle pain or heavy limbs 39.7 59.4 36.2 52.4 0.04 0.30
14 Difficulty concentrating 61.8 79.1 61.7 74.6 0.06 0.52
15 Easily distracted 23.5 40.6 46.8 41.3 0.05 0.27
16 Difficulty thinking/memory problems 48.5 73.9 44.6 63.5 0.004 0.09
17 General performance impaired 41.2 49.3 59.6 61.9 0.08 0.007
18 Diminished need for social contacts 8.8 21.7 21.3 30.2 0.03 0.12
19 Less able to withstand stress 58.8 71.0 70.2 77.8 0.13 0.03
20 Sensitive to weather 19.1 30.4 40.4 34.9 0.08 0.54
more subgroups than ‘‘jumped’’ down two or more
subgroups.
j
Transitions between and diagnostic stability of
subgroups of neurasthenia
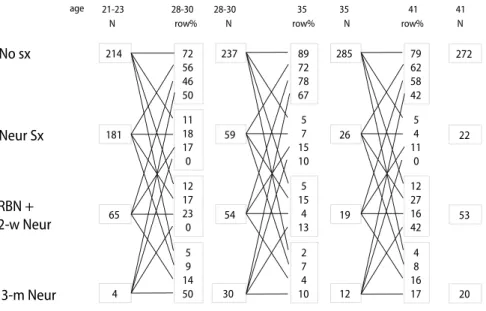
We first analysed the intra-individual diagnostic
sta-bility of neurasthenia across all interviews, merging
the interviews at t
1and t
2(age 21 and 23) as well as
those at t
3and t
4(age 28 and 30) and comparing them
with t
5(age 35) and t
6(age 41). In general, none of the
subgroups of neurasthenia showed high longitudinal
stability (Fig.
3
). On average, only about 15% of the
subjects remained in their subgroup across two
adjacent time points. A similar proportion changed to
other subgroups of neurasthenia. Most subjects in any
subgroup, however, changed to the symptom-free
group at the next time point.
In addition, we examined the history and follow-up
of the individually last and first episodes of 3-months
neurasthenia, respectively. Cumulatively, all changes
across the interviews were taken into account, not just
the first and last interview as in section 3.6 (for more
details, see legend to Fig.
4
). Figure
4
shows subgroup
changes from and to 3-months neurasthenia. The
stability of 3-months neurasthenia was low: the first
episode was followed by the same diagnosis in only
23% of cases, and only 16% of last observed episodes
had a history of a previous episode. Over 75% of
subjects with 3-months neurasthenia had a previous
or subsequent symptom-free period. Combining
3-months and 2-weeks neurasthenia into one group
resulted, as expected, in a slightly higher stability: in
this case one fourth of the subjects ever had a
previ-ous, and one third ever had a subsequent episode of
neurasthenia. GEE confirmed the low stability of
3-months neurasthenia: the OR of prediction of current
by previous neurasthenia was non-significant.
j
GEE models of associations between 3-months
neurasthenia and MDE
In the ‘‘cumulative exposure’’ GEE model (Table
3
a),
3-months neurasthenia was predicted neither by a
previous diagnosis of 3-months neurasthenia, nor by
a previous diagnosis of MDE. It was, however,
strongly associated with concurrent MDE. MDE was
predicted by previous diagnoses of MDE and
3-months neurasthenia, and was also strongly related to
concurrent 3-months neurasthenia.
The first-order lag model (Table
3
b) differed from
the cumulative exposure model in that MDE in the
previous interview predicted 3-months neurasthenia,
while 3-months neurasthenia in the preceding
inter-view did not predict current MDE. Thus, whereas
cumulative previous exposure to MDE did not predict
current 3-months neurasthenia, exposure in the
pre-ceding interview did. Furthermore, whereas
cumula-tive previous exposure to 3-months neurasthenia
predicted current MDE, exposure in the preceding
interview did not.
0 20 40 60 80 100 120 140 -4 -3 -2 -1 0 1 2 3 4 Severity change st c ej b u s f o r e b m u N
Fig. 2 Histogram of changes in severity of neurasthenia subgroup between first and last completed interview. One unit corresponds to a change into the next higher or lower subgroup. See text for further explanation
No sx
Neur Sx
RBN +
2-w Neur
214 72 56 46 50 237 89 72 78 67 41 21-23 28-30 28-30 181 65 11 18 17 0 12 17 23 0 59 5 7 15 10 54 5 15 4 13 N row% N 4 5 9 14 50 30 2 7 4 10 285 79 62 58 42 26 5 4 11 0 19 12 27 16 42 12 4 8 16 173-m Neur
35 35 N N 272 22 53 20 41 row% row% ageFig. 3 Temporal shifts between subgroups of neurasthenia between two successive time points. An example for how to read this figure: at ages 21– 23, 181 particpants reported neurasthenic symptoms (‘‘Neur sx’’), and of these, 56% became symptom-free (‘‘No sx’’) at ages 28–30. This can readily be seen by following the uppermost line originating from the box reading ‘‘181’’. ‘‘No sx’’ = no neurasthenic symptoms, ‘‘Neur sx’’ = neurasthenic symptoms. ‘‘RBN’’ = Recurrent Brief Neurasthenia. ‘‘2-w Neur’’ = 2-weeks neursthenia, ‘‘3-m Neur’’ = 3-months neurasthenia (ICD-10)
Female sex increased the risk for neurasthenia and
for MDE in the first order lag model. The risk group
for stratified sampling was significant, indicating that
high-risk status entailed a higher risk for
neurasthe-nia and depression. Time was not a clinically
signifi-cant predictor (ORs close to 1).
Discussion
This paper presents prospective data on the course
and diagnostic stability of neurasthenic syndromes/
symptoms across 20 years and their associations with
depressive syndromes/symptoms.
j
Symptoms
Among cases of 3-months neurasthenia two major
syndromes could be found, the typical fatigue
syn-drome (exhaustion, weakness, increased need for
sleep) and a syndrome of reduced stress tolerance
(including oversensitivity to external stimuli and to
critical remarks, tension and irritability). Together
they correspond to the original concept of ‘‘excessive
irritable weakness’’ of [
9
].
j
Prevalence
Three-months neurasthenia was clearly age-related:
from age 22 to 41 there was a systematic several-fold
increase of the one-year prevalence of 3-months
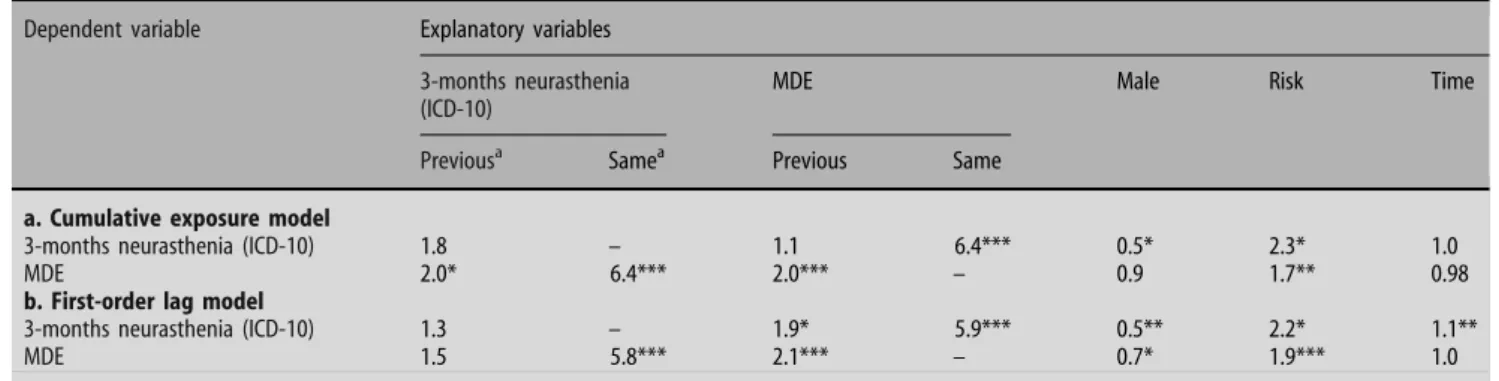
Table 3 GEE models of neurasthenia and depression: odds ratios
Dependent variable Explanatory variables
3-months neurasthenia (ICD-10)
MDE Male Risk Time
Previousa Samea Previous Same
a. Cumulative exposure model
3-months neurasthenia (ICD-10) 1.8 – 1.1 6.4*** 0.5* 2.3* 1.0
MDE 2.0* 6.4*** 2.0*** – 0.9 1.7** 0.98
b. First-order lag model
3-months neurasthenia (ICD-10) 1.3 – 1.9* 5.9*** 0.5** 2.2* 1.1**
MDE 1.5 5.8*** 2.1*** – 0.7* 1.9*** 1.0
a
‘previous’ indicates presence of explanatory variable at any previous interview (cumulative exposure); ‘same’ indicates presence of explanatory variable at same interview
b‘–’ indicates explanatory variable not included in model
***P < 0.001, **P < 0.01, *P < 0.05
a
‘previous’ indicates presence of explanatory variable at the preceding interview (first-order lag); ‘same’ indicates presence of explanatory variable at same interview
b
‘–’ indicates explanatory variable not included in model ***P < 0.001, **P < 0.01, *P < 0.05 3-months neur-asthenia 3-m neur 3-months neur-asthenia 2-w neur UP/BP Dx UP/BP SubDx 2-w neur UP/BP Dx UP/BP SubDx 3-m neur No sx No sx N=64 N=43
Follow-back of last episode
Follow-up of first episode
27% 17% 16% 81% 52% 26% 19% 23% 37% 77%
Fig. 4 Follow-up of the first and follow-back of the last episode of 3-months neurasthenia. The first and last episode of 3-m neurasthenia is identified in each subject (these episodes can be in different years for different subjects). The right side of the figure shows the percentages of subjects with a last episode of 3-month neurasthenia belonging to any of the listed subgroups in any previous interview. Percentages do not sum to 100% because the subgroups are not mutually exclusive: A subject may have belonged to more
than one subgroup prior to the last episode of 3-months neurasthenia. Analogous considerations hold for the left side of the figure, which shows the percentages of subjects with a first episode of 3-months neurasthenia belonging to any of the listed subgroups in any subsequent interview. ‘‘3-m neur’’ = 3-months neurasthenia, ‘‘2-w neur’’ = 2-weeks neurasthenia, ‘‘UP/BP Dx’’ = uni- or bipolar mood disorder, ‘‘UP/BP SubDX’’ = uni- or bipolar subthreshold mood disorder, ‘‘No sx’’ = no neurasthenic symtpoms
neurasthenia, while neurasthenic symptoms prevailed
at age 20–22 and decreased thereafter. A representative
twin study of adolescents found a lifetime prevalence
of neurasthenia of 2.3%, which is compatible with our
assumption of an increase with age [
13
]. Cumulatively
up to age 41, we found 6.0% 3-months neurasthenia.
j
Gender differences
Women reported physical exhaustion twice as often
as men, whereas mental exhaustion was reported to a
similar extent by women and men. Nonetheless, the
prevalence of 3-months neurasthenia was only slightly
higher for women than for men (gender ratio
F:M = 1:2:1, whereas it was about 2:1 in the study of
Farmer et al. 2004). In this context our findings on
atypical depression are of interest, because there we
found a clear preponderance of women with a
cumulative prevalence rate of 6.3% for women versus
1.6% for men (ratio F:M = 3:9:1), explaining the
gender difference in prevalence rates for major
depressive episodes [
6
]. These results also illustrate
that the two syndromes, neurasthenia and atypical
depression, differ substantially although they share
certain diagnostic symptoms.
j
Course of neurasthenic spectrum
Overall, there was a moderate decrease in severity of
neurasthenic manifestations from the first to the last
individual interview: 27% of the subjects stayed the
same, 40% got better and 32% got worse. Analysis of
temporal shifts revealed that the increase of 3-months
neurasthenia with age was not generally at the cost of
neurasthenic symptoms, since most cases with
neur-asthenic symptoms became symptom-free, and only a
total of 13% ever changed to 3-months neurasthenia
(data not shown).
A main finding is that neurasthenia, in contrast to
depression, was a rather unstable diagnosis. For each
point in time, the majority of cases with any
neuras-thenic manifestation switched to the symptom-free
group at the next interview. In the GEE model,
pre-vious 3-months neurasthenia did not predict
sub-sequent 3-months neurasthenia.
j
The cross-sectional and longitudinal association of
neurasthenia and depression
The cross-sectional association of neurasthenia with
depression is well-established [
10
,
13
,
17
,
19
,
22
,
24
,
34
,
35
,
37
]. In cases of co-occurrence the diagnosis of
depression often took precedence over that of
neur-asthenia [
25
]. In our data cross-sectional associations
between neurasthenia and depression were strong and
statistically
significant.
Longitudinally,
previous
depressive states on all diagnostic levels consistently
predicted subsequent depression whereas, as we have
seen,
neurasthenic
syndromes
were
temporally
unstable. The prediction of 3-months neurasthenia by
MDE and vice versa was weak and inconsistent
be-tween the two GEE models.
j
Limitations
With fatigue being an ubiquitous and unspecific
symptom of many illnesses, the question of etiological
heterogenetiy becomes particularly relevant. In
par-ticular, a fatigue syndrome due to a somatic illness or an
accident may have a different etiology than
‘‘non-or-ganic’’ neurasthenia. But then again, it may not. Fatigue
may have a proximal cause that is the same or very
similar everywhere it occurs, and different illnesses
may trigger this proximal cause through a variety of
different causal pathways. While this is an open
ques-tion, it would have been desirable to exclude subjects
with known organic causes of fatigue from our analysis,
since at best, this would have resulted in a more
homogeneous group of neurasthenics. However, we
could not exclude organically-caused fatigue because
no physical examination to objectively ascertain
or-ganic causes had been carried out. Only participants’
subjective causal attributions were available, but these
cannot in general be taken to reflect true somatic
cau-ses, and thus are not a reliable basis for exclusions.
Analysing the associations between 3-months
neurasthenia and depression one has to be aware that
MDE requires a minimum duration of only 2 weeks.
This large time difference reduces comparability and
may explain some controversional findings. Sample
sizes were partly small, and might also account for
some of the inconsistencies. They may limit the
gen-eralizability of our findings to the general population
or to patient populations. The empirical and
con-ceptual overlap between neurasthenia and depression
confounds the issue of diagnostic stability, but this
limitation is inherent and unavoidable.
j Acknowledgement This work was supported by Grant 3200– 050881.97/1 of the Swiss National Science Foundation.
References
1. Angst J (1992) Recurrent brief psychiatric syndromes of depression, hypomania, neurasthenia, and anxiety from an epidemiological point of view. Neurol Psychiatr Brain Res 1:5– 12
2. Angst J (1997) Recurrent brief psychiatric syndromes: hypo-mania, depression, anxiety and neurasthenia. In: Judd LL, Sa-letu B, Filip V (eds) Basic and clinical science of mental and addictive disorders. Karger, Basel Freiburg Paris, pp 33–38 3. Angst J, Gamma A, Ajdacic V, Eich D, Ro¨ssler W (2004)
Prevalence and clinical significance of subthreshold mood disorders. Int J Neuropsychopharmacol 7:S50
4. Angst J, Gamma A, Benazzi F, Ajdacic V, Eich D, Ro¨ssler W (2003) Toward a re-definition of subthreshold bipolarity: epi-demiology and proposed criteria for bipolar-II, minor bipolar disorders and hypomania. J Affect Disord 73:133–146 5. Angst J, Gamma A, Neuenschwander M, Ajdacic-Gross V, Eich
D, Ro¨ssler W, Merikangas KR (2005) Prevalence of mental disorders in the Zurich cohort study: a twenty year prospective study. Epidemiol Psichiatr Soc 14:68–76
6. Angst J, Gamma A, Sellaro R, Zhang H, Merikangas K (2002) Toward validation of atypical depression in the community: results of the Zurich cohort study. J Affect Disord 72:125–138
7. Angst J, Koch R (1991) Neurasthenia in young adults. In: Gastpar M, Kielholz P (eds) Problems of psychiatry in general practice. Neurasthenia. Obsessive-compulsive disorder. Ad-vances in treatment of depression. Teaching and training of the GP. Hofgrefe & Huber Publishers, Lewinston Toronto Bern Go¨ttingen, pp 37–48
8. Beard GM (1869) Neurasthenia, or nervous exhaustion. Boston Med Surgical J 79:217–221
9. Dana CL (1890–1891) Neurasthenia. Post-Graduate 6:26 10. Demyttenaere K, De Fruyt J, Stahl SM (2005) The many faces of
fatigue in major depressive disorder. Int J Neuropsychophar-macol 8:93–105
11. Diggle P, Heagerty P, Liang KY, Zeger S (2002) Analysis of longitudinal data. Oxford University Press, Oxford
12. Dunner DL, Fleiss JL, Fieve RR (1976) The course of develop-ment of mania in patients with recurrent depression. Am J Psychiatry 133:905–908
13. Farmer A, Fowler T, Scourfield J, Thapar A (2004) Prevalence of chronic disabling fatigue in children and adolescents. Br J Psychiatry 184:477–481
14. Fischer-Homberger E (1972) Hypochondriasis of the eighteenth century—neurosis of the present century. Bull Hist Med 46:391–401
15. Freudenberger HJ (1974) Staff burn-out. J Social Issues 30:159– 165
16. Gosling FG (1987) Before Freud. Neurasthenia and the Ameri-can Medical Community, 1870–1910. University of Illinois, Urbana Chicago
17. Hickie I, Lloyd A, Wakefield D (1991) Comment to Kendell’s ‘Chronic fatique, viruses, and depression’. Lancet 337:922–923 18. Hotopf M, David AS, Hull L, Nikalaou V, Unwin C, Wessely S (2003) Gulf war illness—better, worse, or just the same? A cohort study. BMJ 327:1373
19. Maeno T, Kizawa Y, Ueno Y, Nakata Y, Sato T (2002) Depression among primary care patients with complaints of headache and general fatigue. Primary Care Psychiatry 8:69–72 20. Meier A (1985) Validierung des Depressions-Ratings im Fragebogen SPIKE an Patienten der Psychiatrischen Poliklinik. Medical thesis. University of Zurich
21. Merikangas KR, Angst J (1994) Neurasthenia in a longitudinal cohort study of young adults. Psychol Med 24:1013–1024 22. Morey LC, Kurtz JE (1996) The place of neurasthenia in
DSM-IV. In: Widiger TA, Frances AJ, Pincus HA, Ross R, First MB, Wakefield Davis W (eds) DSM-IV Sourcebook. American Psy-chiatric Association, Washington D.C
23. Pawlikowska T, Chalder T, Hirsch SR, Wallace P, Wright DJM, Wessely SC (1994) Population based study of fatigue and psy-chological distress. Br Med J 308:763–766
24. Roy-Byrne P, Afari N, Ashton S, Fischer M, Goldberg J, Buch-wald D (2002) Chronic fatigue and anxiety/depression: a twin study. Br J Psychiatry 180:29–34
25. Sartorius N (1997) Diagnosis and classification of neurasthenia. In: Judd LL, Saletu B, Filip V (eds) Basic and clinical science of mental and addictive disorders. Bibliotheca Psychiatrica, Kar-ger, Basel, pp 1–5
26. Scha¨fer ML (2002) Zur Geschichte des Neurastheniekonzeptes und seiner modernen Varianten Chronic-Fatigue-Syndrom, Fybromyalgie sowie Multiple Chemische Sensitivita¨t. Fortschr Neurol Psychiat 70:570–582
27. Scha¨fer ML (1980) Zur nosologischen Entwicklung und We-chselbeziehung von Hypochondrie und Neurasthenie. In: Peters UH (eds) Die Psychologie des 20. Jahrhunderts. Band X. Er-gebnisse fu¨r die Medizin. Kindler Verlag, Zu¨rich, pp 757–769 28. Sharpe MC, Archard L, Banatvala J, Borysiewicz LK, Clare AW,
David A (1991) Chronic fatigue syndrome: guidelines for rea-search. J R Soc Med 84:118–121
29. Shorter E (1992) Somatization at the end of the twentieth century. In: From paralysis to fatigue. A history of psychoso-matic illness in the modern era. The free press, New York, p 295–322
30. Steiner A (1964) Das nervo¨se Zeitalter. Der Begriff der Nerv-osita¨t bei Laien und A¨ rzten in Deutschland und O¨sterreich um 1900. In:University of Zurich
31. Taylor RE (2001) Death of neurosthenia and its psychological reincarnation. A study of neurosthenia at the National Hospital for the Relief and Cure of the Paralysed and Epileptic, Queen Square, London, 1870–1932. Br J Psychiatry 179:550–557 32. U¨ stu¨n TB (1994) WHO collaborative study: an epidemiological
survey of psychological problems in general health care in 15 centers worldwide. Int Rev Psychiatry 6:357–363
33. van Deusen EH (1869) Observations on a form of nervous prostration (neurasthenia), culminating in insanity. Am J In-sanit 25:445–461
34. Walsh CM, Zainal NZ, Middleton SJ, Paykel ES (2001) A familiy history study of chronic fatigue syndrome. Psychiatr Genet 11:123–128
35. Watt T, Groenvold M, Bjorner JB, Noerholm V (2000) Fatigue in the Danish general population. Influence of sociodemo-graphic factors and disease. J Epidemiol Commun Health 54:827–833
36. Wessely S (1997) Chronic fatigue syndrom: a 20th century ill-ness? Scand J Work Environ Health 23:17–34
37. Wessely S (1998) The epidemiology of chronic fatigue syn-drome. Epidemiol Psichiatr Soc 7:10–24
38. Wilson A, Hickie I, Hadzi-Pavlovic D, Wakefield D, Parker G, Straus SE, Dale J, McCluskey D, Hinds G, Brickman A, Gold-enberg D (2001) What is chronic fatigue syndrome? Hetero-geneity within an international multicentre study. Austr New Zeal J Psychiatry 35:520–527
39. World Health Organization (1993) The ICD-10 classification of mental and behavioural disorders. Diagnostic criteria for re-search. World Health Organization, Geneva