HAL Id: hal-02454925
https://hal.archives-ouvertes.fr/hal-02454925
Submitted on 24 Jan 2020HAL is a multi-disciplinary open access
archive for the deposit and dissemination of sci-entific research documents, whether they are pub-lished or not. The documents may come from teaching and research institutions in France or abroad, or from public or private research centers.
L’archive ouverte pluridisciplinaire HAL, est destinée au dépôt et à la diffusion de documents scientifiques de niveau recherche, publiés ou non, émanant des établissements d’enseignement et de recherche français ou étrangers, des laboratoires publics ou privés.
Distributed under a Creative Commons Attribution - NonCommercial - NoDerivatives| 4.0 International License
Impact of dam flushing operations on sediment
dynamics and quality in the upper Rhône River, France
Hugo Lepage, Marina Launay, Jérôme Le Coz, Hélène Angot, Cecile Miege,
Stéphanie Gairoard, Olivier Radakovitch, Marina Coquery
To cite this version:
Hugo Lepage, Marina Launay, Jérôme Le Coz, Hélène Angot, Cecile Miege, et al.. Impact of dam flushing operations on sediment dynamics and quality in the upper Rhône River, France. Journal of Environmental Management, Elsevier, 2020, 255, pp.109886. �10.1016/j.jenvman.2019.109886�. �hal-02454925�
Environmental Management
Elsevier Editorial System(tm) for Journal of Manuscript Draft
Manuscript Number: JEMA-D-19-03805R1
Title: Impact of dam flushing operations on sediment dynamics and quality in the upper Rhône River, France
Article Type: Research Article
Keywords: Trace metals; PAHs; suspended particulate matters; pollution monitoring; sediment flux
Corresponding Author: Mr. Hugo LEPAGE, Ph.D. Corresponding Author's Institution: IRSN First Author: Hugo LEPAGE, Ph.D.
Order of Authors: Hugo LEPAGE, Ph.D.; Marina Launay; Jérôme Le Coz; Hélène Angot; Cécile Miège; Stéphanie Gairoard; Olivier Radakovicth; Marina Coquery
Abstract: The Rhône River (France) has been used for energy production for decades and 21 dams have been built. To avoid problems due to
sediment storage, dam flushing operations are periodically organized. The impacts of such operations on suspended particulate matter (SPM) dynamics
(resuspension and fluxes) and quality (physico-chemical characteristics and contamination), were investigated during a flushing operation
performed in June 2012 on 3 major dams from the Upper Rhône River. The concentrations of major hydrophobic organic contaminants (polychlorinated biphenyls, polycyclic aromatic hydrocarbons - PAHs, bis(2-
ethylhexyl)phthalate [DEHP] and 4-n-nonylphenol), trace metal elements, particulate organic carbon (POC) and particle size distribution were measured on SPM samples collected during this event as well as on those obtained from 2011 to 2016 on a permanent monitoring station (150 km downstream). This allows to compare the SPM and contaminant
concentrations and fluxes during the 2012 dam flushing operations with those during flood events and baseflow regime. At equal water discharge, mean SPM concentrations during flushing were on average 6-8 times higher than during flood events recorded from 2011 to 2016. While of short duration (19 days), the flushing operations led to the resuspension of SPM and contributed to a third of the mean annual SPM flux. The SPM
contamination was generally lower during flushing than during baseflow or flood, probably due to the fact that flushing transport SPM only issued from resuspended sediment, with no autochtonous particles nor eroded soil. The only exception are PAHs and DEHP with higher concentrations during flushing, which must be issued from the resuspension of legacy- contaminated sediments stored behind the dams before the implementation of emission regulation. During flushing, the variations of POC and contaminant concentrations are also mostly driven by particle size. Finally, we propose a list of recommendations for the design of an adequate monitoring network to evaluate the impact of dam flushing operations on large river systems.
Title page
Impact of dam flushing operations on sediment dynamics and
quality in the upper Rhône River, France
Hugo Lepage3 , Marina Launayb1, Jérôme Le Cozb, Hélène Angotb2, Cécile Miègeb, Stéphanie Gairoardc, Olivier Radakovitcha,c, Marina Coqueryb
aInstitut de Radioprotection et de Sûreté Nucléaire (IRSN), PSE-ENV/SRTE/LRTA, BP 3, 13115 Saint-Paul-lez-Durance, France
bIrstea, UR RiverLy, Centre de Lyon-Villeurbanne, 5 rue de la Doua CS 20244, 69625 Villeurbanne, France
c Aix-Marseille Univ., CNRS, IRD, INRA, Coll France, CEREGE, Aix-en-Provence, France 1 Now at Stucky SA, Rue du Lac 33, 1020 Renens VD, Switzerland
2 Now at University of Colorado Boulder, Institute of Arctic and Alpine Research, USA
Cover Letter
Cadarache, 8 November 2019
Dear Editor,
Please find enclosed the revised version of the manuscript entitled “Impact of dam flushing operations on sediment dynamics and quality in the upper Rhône River, France” by H. Lepage and co-authors.
This manuscript was corrected according to the reviewers recommendations. Answers to their remarks were compiled in a document enclosed with the manuscript. Finally, the total length of the article was also reduced by 10% (from 6752 words to 6078 words excluding references).
Kindly acknowledge the receipt of the same.
Yours sincerely,
On behalf of the authors,
(H. LEPAGE)
Corresponding author
IRSN, Research Laboratory on radionuclide Transfers in Aquatic ecosystems Centre de Cadarache, bat 159, 13115 St Paul lez durance,
France
Response to Reviewers
Comment from reviewers
Answer from corresponding author
Correction in the manuscript
Reviewer 1
Highlights corrected Sediment dynamic differed during flushing
operations and flood events
Line 15 corrected The Rhône River (France) has been used for
energy production for decades and 21 dams have been built.
Line 29 - In general it is not advisable to start a sentence with an acronym, rather right it out in full
corrected The SPM contamination was generally lower than during baseflow and flood regimes.
Line 131 corrected More than 3 x 10⁶ m3 of SPM were thus stored in the Verbois reservoir between 2003 and 2012 (Services industriels de Genève, 2014).
Line 133 corrected [...] which transports ~0.7 x 10⁶ m3 of SPM per year (approx. 1 to 3 tons dry weight) [...]
Line 309-314 - This section reads as introduction or as part of the discussion
According to reviewer 4, this section was moved in the Materials and Method part.
2.7. SPM and contaminant fluxes calculation
One important question regarding the impact of flushing operations is to determine their relative contribution to SPM transport compared to flood events. Such a comparison requires an estimation of the influence of both types of events over a longer time scale. The Jons station allows an estimation of the annual SPM fluxes from 2011 to 2016 (based on hydrological years, i.e. from September to August).
Reviewer 4
[...] the manuscript need a deep re-organization in order to better address the main aim.
In particular, both methodological and research aspects are mixed in the text, and this creates some confusion in the reader. For example, to my
According to reviewer 1, the paper is well written and logically organized. However, the comparison between CFC and PT was indeed confusing and a part of this was moved to the supplementary materials (Supplementary Material #1.1)
with CFC and PT sampling methods is redundant and may be moved to Supplementary material. As well, the final recommendations for an adequate monitoring network of flushing operations doesn't add any relevant information to the previous text.
Regarding the recommendations, we thought that it is interesting to share our feedback on flushing operations monitoring as we did not find any similar study in the literature with a long term monitoring. We also noticed that recommendations are used in scientific papers, even in Journal of Environmental Management (ex https://doi.org/10.1016/j.jenvman.2019.06.092 https://doi.org/10.1016/j.jenvman.2015.08.014 https://doi.org/10.1016/j.jenvman.2019.109405 Since the reviewer 1 did not complain on that point and since specific areas of interest of JEM includes: "Development of methods for environmental quality management (new procedures, characterization techniques,
monitoring methods)", we really think that it is relevant to keep such recommendations in the paper.
By contrary, some scientific aspects should be more deepened and explained. In the present form, results are mainly presented as a report regarding this particular case-study. The case- study of the Rhone River has been widely studied before in many aspects, as proved by the publications reported in the reference section (e.g. Peter et al. 2014 regards the same flushing event, with samples collected in different sampling stations upstream Jons). Thus, results may be shortened, while in the discussion section a wider generalization and comparison with other
The Rhône River has been indeed studied for decades by many research fields, including sedimentary aspect. However, studies investigating the impact of flushing operations on SPM quality remain rare contrary to what is said by reviewer 4. Furthermore, studies on particulate contaminant behaviors during flushing operations are also very rare at a worldwide scale, as described in the introduction of our paper.
Reviewer 4 indicates that Peter et al. 2014 worked on the same event. This is right (and we cite this work in our manuscript) but their approach was
published cases should be added. really different with a specific focus on the impact of the flushing operations on benthic invertebrates. Also, their investigation on the water quality was complementary to our study as they conducted measurements of dissolved and particulate metals (Al, Co, Cr, Cu, Fe, Mn, Ni, Pb) while we measured particulate organic contaminants (PCBs, PAHs, DEHP and 4-n- nonylphenols) in addition to particulate metals (Cd, Cu, Pb, Zn, Hg). Finally, the impact of the flushing operations on SPM and associated contaminant over a long term monitoring was not studied by Peter et al. 2014. Therefore, we think that both studies are complementary.
Moreover, a better explanation of the different behavior of contaminants may be addressed.
Additional information were added to the manuscript according to the comments below (chapter 4.2 and 4.3).
Abstract: methods are missing. Line 29: what do you mean with "origin"? Lines 30-31 seem to contradict lines 29. Maybe this part should be re- written.
The abstract was entirely rewritten to fit these comments.
the English text should be revised (e.g. highlights contain some mistakes)
The manuscript was proof-corrected by a native English (certificate enclosed in the built pdf) and Reviewer 1 said that the paper was well written. However, special attention was given in re-writing the manuscript.
line 84: "fixed" doesn't seem correct: maybe "adsorbed" or "carried by"
This sentence was mixed with another to shorten the manuscript.
Additionally, we still need a better understanding of contaminants remobilization and transport processes under such conditions (Hauer et al., 2018; SedNet, 2014), as floods and dam flushing operations are major events able to transport a
2019). In Figure 1 many other smaller dams are présent
between Genissiat dam and the sampling station at Jons: do they have some influence on your results (e.g. flux calculations or contaminant concentrations?) Are there contaminated sediments stored in those smaller reservoirs which may be remobilized during the flushing events?
The text was corrected in order to include the specific management of these dams. Unfortunately we have no data on contamination levels in these smaller reservoirs.
Five small dams located between Génissiat and Jons (Figure 1) were also opened during this period and managed in order to prevent both sediment deposition and resuspension. The by- passed sections of the Rhône River (Old Rhône reaches) were disconnected and the whole SPM flux transiting through the reservoirs and tailrace canals. The levels of the reservoirs were lowered as much as possible to prevent deposition and ensure a quick transfer of water and SPM.
lines 100-114: this part seems a summary of the research: the final aim of the research should be more addressed
Additional information was added to clarify the aim of the research.
This study aimed at characterizing the impact of flushing operations on SPM dynamics and quality in a large river system: the Rhône River basin. Thanks to a specific monitoring, the fluxes and mass balances of SPM and associated contaminants triggered by flushing operations in 2012 and 2016 were estimated at different time scales. The variations in contaminant concentrations were related to the characteristics of SPM (particle size distribution, organic carbon content) as well as to their origin in the watershed (eroded soil versus resuspended sediment).
line 119: 95600 km2 is the watershed area? Corrected. The Rhône River (95 600 km2 watershed area, mean water discharge of ~1700 m3.s-1 at the outlet station of Beaucaire)
lines 152-153: add "2016" in the dates Corrected (from May 20th, 2016 at 12:00 to May 31st, 2016 at 12:00).
lines 155-158: some results are based on water discharge values: maybe a short description of this hydrodynamical model performance/validation should be mentioned
Additionnal information was added There is no hydrometric station close to Jons and hourly water discharge was calculated using the 1- D hydrodynamical model MAGE (Irstea, France) and discharge inputs from upstream hydrometric stations (Lagnieu), Bourbre (Tignieu-Jameyzieu),
and Ain (Port-Galland) Rivers (Figure 1) (Dugué et al., 2015; Launay et al., 2015). This model is calibrated for the whole Rhône River and outputs were evaluated against measured water levels, with a maximal accepted difference of 10 cm. lines 205-206 should be moved to discussion or
supplementary material
Part 2.4 including lines 205-206 was moved to supplementary materials to reduce manuscript length.
- A "Data analysis" paragraph is missing. Maybe lines 309-314 could be part of this paragraph. As well, the calculation of fluxes should be reported
Lines 309-314 were moved to the Materials and Method part (chapter 2.7). Flux calculation was already explained in this chapter.
lines 292-308 are partly a repetition of paragraph 3.3, so this part can be moved to paragraph 3.3 and shortened
Lines 292 to 308 describe the variation of the SPM parameters (POC, particles size distribution) and contaminants concentrations during the flushing operations, while part 3.3 describe the variation between the different hydrological conditions (flood+baseflow vs flushing).
There is thus no repetition and we propose to keep both parts separately since reviewer 1 noted that the paper is "logically organized".
lines 301-302: how do you explain this contrasting behavior?
This sentence in the "results" section was written to describe the observations detailed in the following lines. The explanation is given in the discussion section. However the sentence was deleted to clarify the paragraph.
lines 370-374: how do you explain a different behavior of congeners of organic compounds (PAHs, PBCs)?
PAHs molecules and PCBs congeners are indeed two families of organic compounds, and it is well know that their sources are different (e.g. for PAHs: https://doi.org/10.1002/etc.5620160212). In the Rhône River, we highlighted such differences in a report of the OSR programm and concluded that the different congeners of PAHs
For the different behavior of the PAHs congeners (Table S4), preliminary results on PAHs concentration in SPM collected in the upper Rhône River demonstrate that the different congeners of PAHs have different origins, mainly road traffic and domestic heating (Botha et al., 2014, Poulier et al., 2018).
domestic heating. Moreover, the absence of relation between PAHs and PCBs demonstrate that PCBs mainly result from industrial releases. http://www.graie.org/osr/IMG/pdf/2018.01 livra ble iv2 vdiffusable mc gp drm.pdf
Furthermore, the explanation about these differences is given in the "discussion" section at chapters 4.2 and 4.3 but more details were added to the manuscript.
Discussion should not report citations of figures. Sub-titles in discussion are not needed
References to the figures in the discussion should help the reader to find which part of the results is related to this discussion. Also, sub-titles presented as questions were proposed in order to clarify the discussion.
We are surprised by this reviewer comment, because almost all papers refer to figures in the discussion when necessary (see for examples: : https://doi.org/10.1016/j.jenvman.2019.109479 or
https://doi.org/10.1016/j.jenvman.2019.109391 or
https://doi.org/10.1016/j.jenvman.2019.109405). Based on the comment of reviewer 1 ("the paper is logically organized. I found hard to criticize the different sections"), we prefer to keep these citations and sub-titles.
line 412: the day is missing in the date: "06/0/2012"?
Corrected [...]from 06/11-14/2012 [...] lines 419-422: any idea of contamination levels in
sediments stored in the reservoirs?
Unfortunately investigations on contamination levels in the studied reservoirs are very sparse.
Concentration of TME, PAHs and PCBs measured on sediment cores collected in the studied dams were previously reported by the Forel Institute in 2009. However, each sediment cores were fully mixed and only one measure of contaminants were conducted on each mixed sediment cores. Therefore as our results demonstrate that the particle size affect the concentrations as well as the deepness of the sediment flushed, it is difficult to compare the results of the mixed sediment cores and our samples of SPM.
lines 424 and 431: what do you mean with "origin"?
The meaning is explained in chapter 4.2 and 4.3. Origin means the source of particles that include soil of the catchments, sediments of the different tributaries, or anthropic sources (for example road traffic and domestic heating for PAHs). Paragraph 5: these are conclusions We do not agree with this comment. Indeed, this
section presents recommendations for scientists or stakeholders to improve monitoring of the consequences of flushing events in fluvial systems. These recommendations underline specifically how the monitoring of such events should differ from the one usually performed (e.g. regulatory monitoring) and could be implemented for all types of rivers.
lines 482-458: this part of text is redundant. In particular: lines 482-521 could be moved to supplementary material, lines 522-548 could be deleted as they summarize results
We partly disagree with this comment. We rely on the reviewer1 comments to support this position. However, we shortened the text to avoid redundancy as much as possible.
The full manuscript was shortened as much as possible and some sections have also been moved to a new supplementary material section.
lines 496-500: also a pressure analysis in the watershed could drive the choice of contaminants of interest
Right. We add this point in the text. Selection criteria include: priority pollutants according to regulations, performance of the analytical methods (limit of quantification,
pressure; Fig. 1: the city of Geneva is missing in the map Corrected
Figure 5: maybe both events should be plotted in the same graph (even if some points will be hidden behind the others): in the present form black points represent both normal conditions and one flushing event, and this creates some confusion
Corrected
Tab. 1: why is the number of samples (n) different in each column of the same row?
This table was moved to the supplementary materials (Table S4) to shorten the manuscript. The number of samples was corrected and is now the same for each row of particle size.
Graphical Abstracts
Dam flushing operations
Discharge (m3.s 1)
Particle size (%)
Particulate
contaminant
concentrations
-1,POC (mg.kg )
10000 5000W. A
20Ü
1 A F\
15 n\ J l ,
n n Q qV
a
100
Q 07 08 09 10 11 12 13 14 07 08 09 10 11 12 13 14 0*Highlights (for review)
Click here to view linked References
Highlights
• Dam flushing operations were monitored on the Upper Rhône River (France) • Sediment dynamic differed during flushing operations and flood events • About 0.6 Mt of SPM were stored in the Upper Rhône from 2011 to 2016
• 21 to 37% of the mean annual SPM flux transited during the 2012 flushing operations • Particulate contaminant concentrations were driven by particle size and SPM origin
*Manuscript
Click here to view linked References
1
Impact of dam flushing operations on sediment dynamics and
2
quality in the upper Rhône River, France
3 Hugo Lepage3 , Marina Launayb1, Jérôme Le Cozb, Hélène Angotb2, Cécile Miègeb, Stéphanie 4
5
Gairoardc, Olivier Radakovitcha,c, Marina Coqueryb
6 aInstitut de Radioprotection et de Sûreté Nucléaire (IRSN), PSE-ENV/SRTE/LRTA, BP 3, 13115 7 Saint-Paul-lez-Durance, France
8 bIrstea, UR RiverLy, Centre de Lyon-Villeurbanne, 5 rue de la Doua CS 20244, 69625 9 Villeurbanne, France
10 c Aix-Marseille Univ., CNRS, IRD, INRA, Coll France, CEREGE, Aix-en-Provence, France 11 1 Now at Stucky SA, Rue du Lac 33, 1020 Renens VD, Switzerland
12 2 Now at University of Colorado Boulder, Institute of Arctic and Alpine Research, USA 13 * Corresponding author: hugo.lepage@irsn.fr
14
Abstract
15 The Rhône River (France) has been used for energy production for decades and 21 16 dams have been built. To avoid problems due to sediment storage, dam flushing operations 17 are periodically organized. The impacts of such operations on suspended particulate matter 18 (SPM) dynamics (resuspension and fluxes) and quality (physico-chemical characteristics and 19 contamination), were investigated during a flushing operation performed in June 2012 on 3 20 major dams from the Upper Rhône River. The concentrations of major hydrophobic organic 21 contaminants (polychlorinated biphenyls, polycyclic aromatic hydrocarbons - PAHs,
bis(2-22 23 24 25 26 27 28 29 30 31 32 33 34 35 36 37 38 39 40 41 42
ethylhexyl)phthalate [DEHP] and 4-n-nonylphenol), trace metal elements, particulate organic carbon (POC) and particle size distribution were measured on SPM samples collected during this event as well as on those obtained from 2011 to 2016 on a permanent monitoring station (150 km downstream). This allows to compare the SPM and contaminant concentrations and fluxes during the 2012 dam flushing operations with those during flood events and baseflow regime. At equal water discharge, mean SPM concentrations during flushing were on average 6-8 times higher than during flood events recorded from 2011 to 2016. While of short duration (19 days), the flushing operations led to the resuspension of SPM and contributed to a third of the mean annual SPM flux. The SPM contamination was generally lower during flushing than during baseflow or flood, probably due to the fact that flushing transport SPM only issued from resuspended sediment, with no autochtonous particles nor eroded soil. The only exception are PAHs and DEHP with higher concentrations during flushing, which must be issued from the resuspension of legacy-contaminated sediments stored behind the dams before the implementation of emission regulation. During flushing, the variations of POC and contaminant concentrations are also mostly driven by particle size. Finally, we propose a list of recommendations for the design of an adequate monitoring network to evaluate the impact of dam flushing operations on large river systems.
Key words
Trace metals, PAHs, suspended particulate matters, pollution monitoring, sediment flux
43 44 45 46 47 48 49 50 51 52 53 54 55 56 57 58 59 60 61 62 63 64 65
1. Introduction
Investigating suspended particulate matter (SPM) transport in river catchments is a key component of the environmental monitoring of large rivers as SPM may cause important environmental impacts (Frings and Ten Brinke, 2018; Le Bissonnais et al., 2005; Walling, 2005). Suspended particulate matter transport can result in increasing water turbidity, degradation of fish habitat (Grimardias et al., 2017), siltation of reservoirs (Owens et al., 2005), and transport of contaminants such as polychlorinated biphenyls (PCBs), trace metal elements (TME), radionuclides or nutrients (Dumas et al., 2015; Evrard et al., 2015; Horowitz, 2008; Taylor and Owens, 2009). The monitoring of SPM and associated particulate contaminant fluxes in rivers is therefore necessary, though practically challenging.
One of the challenges is to evaluate the role of dam reservoirs in terms of both sink and source of SPM (Hauer et al., 2018). Indeed, dams are among the main structures that impact SPM transport by reducing flow velocity and increasing sediment deposition (Syvitski
et al., 2005). Such storage leads to a decrease in reservoir capacity and triggers economic
issues (White, 2001), hence several methods are used to limit reservoir filling (Kondolf et al., 2014). Dam flushing operations are regularly organized to remove sediments stored in reservoirs and avoid problematic consequences such as siltation and enhanced flood hazard (Brown, 1944; Peteuil et al., 2013). These operations consist in increasing water velocity and shear stress by lowering the water level to erode material deposited in the reservoir (Brandt, 2000; Di Silvio, 2001; Kondolf et al., 2014). However, flushing operations can have significant ecological impacts: increased stress or mechanical damage of organisms, loss of habitats, and decrease in dissolved oxygen concentrations due to increased SPM concentrations (Espa
66 67 68 69 70 71 72 73 74 75 76 77 78 79 80 81 82 83 84 85 86 87 88
direct conséquences, contaminants associated with deposited sédiments (and legacy contamination) may also be resuspended and disseminated (Peter et al., 2014) or transferred to the dissolved phase (Bretier et al., 2019; Kalnejais et al., 2010), increasing their bioavailability (e.g. Dong et al., 2018 for TME). On the contrary, resuspension of less contaminated sediments may result in the dilution of particulate contamination (Ferrand et
al., 2012). While difficult to evaluate, especially in large river systems, these impacts should
however be better addressed in order to minimize the costs under consideration of ecological requirements and to improve sediment management in terms of hydropower use (Hauer et al., 2018).
The Rhône River is France's number one river in terms of water discharge and hydroelectricity production. Downstream of Lake Geneva in Switzerland, the Rhône River is highly artificialized and characterized by the presence of 21 hydropower plants. A large proportion of SPM is stored each year in this river, mostly in dam reservoirs (Bravard and Clémens, 2008; Provansal et al., 2014). As several industries are implemented between Lake Geneva and the Rhône River Delta, a large range of contaminants is delivered to the river (e.g., Ollivier et al., 2011) and a fraction is also trapped in dam reservoirs. Dam flushing operations are regularly conducted on the upper Rhône River to prevent bed aggradation in the Verbois reservoir (Figure 1), and thus urban flooding in the city of Geneva (Peteuil et al., 2013). From 1945 to 2003, flushing operations were performed every 3 years and the quantity of SPM exported was similar to the quantity of sediment stored since the previous flush (Diouf, 2013). Due to the associated increase of turbidity and potential consequences on fish populations (Grimardias et al., 2017), such operations are now strictly monitored in order to reduce their environmental impact. However, the survey of SPM transport on a
89 90 91 92 93 94 95 96 97 98 99 100 101 102 103 104 105 106 107
large scale remains difficult and the impact of such operations compared to flood events is still a matter of debate due to the lack of data. Additionally, we still need a better understanding of contaminants remobilization and transport processes under such conditions (Hauer et al., 2018; SedNet, 2014), as floods and dam flushing operations are major events able to transport a large fraction of contaminant fluxes (Poulier et al., 2019). The behavior and dynamics of sediment (and associated contaminants) and dissolved/labile metals have already been studied on the Rhône River during floods and flushing operations, respectively (Antonelli et al., 2008; Ollivier et al., 2011; Sicre et al., 2008; Bretier et al., 2019; Peter et al., 2014). However, there is a lack of information regarding the impact of flushing operations on particulate contaminants.
This study aimed at characterizing the impact of flushing operations on SPM dynamics and quality in a large river system: the Rhône River basin. Thanks to a specific monitoring, the fluxes and mass balances of SPM and associated contaminants triggered by flushing operations in 2012 and 2016 were estimated at different time scales. The variations in contaminant concentrations were related to the characteristics of SPM (particle size distribution, organic carbon content) as well as to their origin in the watershed (eroded soil versus resuspended sediment). Finally, the SPM monitoring performed during a second flushing operation in 2016 is also used to compare and evaluate the role of such events on a pluriannual scale.
108 109 110 111 112 113 114 115 116 117 118 119 120 121 122 123 124 125 126 127 128 129
2. Materials and Method
2.1.Location of the dams and description of the dam flushing operations
The Rhône River (95 600 km2 watershed area, mean water discharge of ~1700 m3.s-1 at the outlet station of Beaucaire) constitutes the main SPM input to the Western Mediterranean Sea, with a mean SPM flux of 6.5 Mt.year-1 from 2000 to 2015 according to Poulier et al. (2019). The Rhône Sediment Observatory operates two permanent monitoring stations along this river and several others on its main tributaries (Poulier et al., 2019; Thollet et al., 2018). We used data collected at the permanent station of Jons (45.8121N, 5.0896E - see Fig. 1), near the city of Lyon, to investigate the dynamics of sediments in the upper Rhône River and notably the impact of dam flushing operations conducted downstream of Lake Geneva.
This study focuses on flushing operations conducted in June 2012 in three reservoirs located downstream of Lake Geneva (Figure 1): Verbois, Chancy-Pougny, and Génissiat. Flushing operations used to be performed in this area every 3 years from 1945 to 2003, but the Swiss authorities later decided to consider alternative methods to manage SPM and dams. More than 3 x 10⁶ m3 of SPM were thus stored in the Verbois reservoir between 2003 and 2012 (Services industriels de Genève, 2014). They mainly originated from the Arve River, a tributary located upstream of the dam (Figure 1), which transports ~0.7 x 10⁶ m3 of SPM per year (approx. 1 to 3 tons dry weight), half of this amount being stored behind the dam (Guertault et al., 2014; Launay et al., 2019). This accumulation induced a change in the water level of the reservoir during floods that could impact the security of local population. Since no alternative management solutions were validated, the Swiss and French authorities
130 131 132 133 134 135 136 137 138 139 140 141 142 143 144 145 146 147 148 149 150 151 152
agreed to conduct a new flushing operation in June 2012 on the three successive dams (Figure 1). The flushing operations were conducted by lowering the water level following the drawdown flushing method (Fruchard and Camenen, 2012) in order to remove stored SPM in the three dams (Figure 2). The large-volume Génissiat reservoir located downstream of the two other dams (Figure 1) was flushed first (4-12 June) in order to compensate for the deposition of the SPM released from the Chancy-Pougny (9-16 June) and Verbois dams (9-22 June, Figure 2; Diouf, 2013). Five small dams located between Génissiat and Jons (Figure 1) were also opened during this period and managed in order to prevent both sediment deposition and resuspension. The by-passed sections of the Rhône River (Old Rhône reaches) were disconnected and the whole SPM flux transiting through the reservoirs and tailrace canals. The levels of the reservoirs were lowered as much as possible to prevent deposition and ensure a quick transfer of water and SPM. It should also be noted that floods occurred in two upstream tributaries, Ain and Fier, during the 2012 flushing operations.
Another flushing operation, also monitored at Jons, was conducted on the same dams in May 2016 (Diouf, 2017). Compared to 2012, the 2016 flushing operation was only partial, with a smaller decrease of the water level in Verbois reservoir: 361 m a.s.l. in 2016 vs 352 m a.s.l. in 2012 (Diouf, 2017). Contrary to 2012, the 3 dams were flushed at the same time and during 11 days (from May 20th, 2016 at 12:00 to May 31st, 2016 at 12:00).
2.2.Water discharge
There is no hydrometric station close to Jons and hourly water discharge was calculated using the 1-D hydrodynamical model MAGE (Irstea, France) and discharge inputs from upstream hydrometric stations (Lagnieu), Bourbre (Tignieu-Jameyzieu), and Ain (Port-Galland) Rivers (Figure 1) (Dugué et al., 2015; Launay et al., 2015). This model is calibrated
153 154 155 156 157 158 159 160 161 162 163 164 165 166 167 168 169 170 171 172 173
for the whole Rhône River and outputs were evaluated against measured water levels, with a maximal accepted difference of 10 cm.
2.3.Concentration of SPM
To evaluate the SPM concentration at Jons, turbidity measurements were conducted continuously every 15 min using a Hach Lange SC200 turbidity probe. The relation between turbidity (in NTU) and SPM concentration was calibrated as follows: SPM concentration was measured in water samples collected during various hydrological conditions (baseflow, flood, and flushing operations) in order to cover the entire range of discharges. Those water samples were collected manually or using a portable automatic water sampler (ISCO or SIGMA - 1 sample every 4 hours) due to logistic constrains. Suspended particulate matter concentration was measured after filtration of the samples through pre-weighed filters (Whatman GF/F, 0.7 pm). The limit of quantification (LQ) was 2 mg.L-1.
2.4.SPM sampling for Chemical analyses
In order to collect a sufficient amount of SPM material for subsequent physicochemical analyses, two sampling methods were used at Jons, Continuous Flow Centrifugation (CFC) and Particle Trap (PT) (Masson et al. 2018), as described in details in the supplementary materials (Supplementary Material #1.1). The CFC samples were used to characterize the concentration of TME (Cd, Cu, Pb, Zn), Hg and PCBs. The PT was used to collect a sufficient amount of SPM for chemical analysis of polycyclic aromatic hydrocarbons (PAHs), bis(2-ethylhexyl)phthalate (DEHP) and 4-n-nonylphenol. During the 2012 flushing operations, samples were collected every day from June 4 to June 16 with the CFC and
174 175 176 177 178 179 180 181 182 183 184 185 186 187 188 189 190 191 192 193 194 195 196
during 2-3 day periods from June 5 to June 16 with the PT (supplementary material #2 Table
S1).
At the Jons station, the end of the pumping pipe is installed approximately 5 m downstream of the PT in order to side step potential heterogeneity of SPM throughout the river cross-section. Prior to chemical analysis, SPM collected with the two sampling techniques were transferred to clean brown glass bottles (250 mL), deep-frozen (-18°C), freeze-dried, and finally homogenized by grinding in an agate mortar. SPM samples were stored in the dark and at ambient temperature before analysis.
2.5.Grain-size distribution and particulate organic carbon analysis
Volumetric grain size distribution was analyzed on a CILAS 1190 laser particle size analyzer (range of values: 1 - 2 500 pm) according to the ISO 13320 standard method (AFNOR, 2009). Recent investigation on Particle Size Distributions (PSD) in the Rhône River concluded that the usual percentiles d10, d50 or d90 might not be sufficient to describe grain size due to a multimodal shape (Masson et al., 2018). This shape can be modeled as a combination of several homogeneous subpopulations of mixed particles, each following a log-normal distribution. Therefore, each subpopulation was modeled using the R software (version R3.2.0) to extract the mass proportion of each subpopulation, which were used to compare the different PSD. Subpopulations were clustered in five classes according to their modal diameter: < 4 pm (clay), 4-15 pm (fine silt), 15 - 63 pm (coarse silt), 63 - 125 pm (very fine sand) and > 125 pm (sand).
The determination of particulate organic carbon (POC) in SPM samples was performed using a carbon analyzer (Thermo Electron, CHN Flash 2000) at the INRA laboratory (Arras, France). Decarbonatation was performed using hydrochloric acid
197 198 199 200 201 202 203 204 205 206 207 208 209 210 211 212 213 214 215 216 217 218 219
according to the NF ISO 10694 standard method (AFNOR, 1995). The LQ was estimated to be 50 mg.kg-1 by using a reference material (Aglae, 15 M9.1; 40 g.kg-1) and the analytical uncertainty varied between ~3% and ~6% (k=2), depending on the POC concentration.
2.6.Chemical analysis of SPM
Concentrations of total Cd, Cu, Pb, and Zn were determined after a microwave acid digestion of the SPM as described in the supplementary materials (Supplementary Material #1.2). The LQ was 0.05 pg.kg-1. The mean difference between measured and certified values were, for STSD-3 (n=6) and MESS-4 (n=3), respectively: 20 and 3% for Pb; 7 and 6% for Cu; 5 and 2% for Zn; 14 and 7% for Cd.
The determination of total Hg in SPM was performed using an automated atomic absorption spectrophotometer, DMA 80 (Milestone), according to EPA method 7473 (US EPA, 2007). The LQ was 10 pg.kg-1. Blanks and certified reference materials (IAEA 433, marine sediment; LGC 6187, river sediment) were systematically used to check analytical accuracy (94%) and uncertainty (14%; k=2).
Indicator PCBs (PCB 28, 52, 101, 118, 138, 153, and 180) were analyzed using capillary gas chromatography coupled to an electron capture detector (GC-ECD), as detailed in Masson et al. (2018). Limits of quantification ranged from 0.5 to 1 pg.kg-1. Only results for compounds with a quantification frequency higher than 60% (Helsel, 2006) were considered here, i.e. PCBs 101, 138, 153, and 180.
The 16 priority PAHs (Keith, 2015) were analyzed by the Laboratory of Hygiene and Environment (Rouen, France), using capillary gas chromatography coupled to a mass spectrometer (GC-MS) and according to the XP X33-012 Standard (AFNOR, 2000). Limits of quantification ranged from 1 to 2 pg.kg-1 for most of the PAHs, except for
220 221 222 223 224 225 226 227 228 229 230 231 232 233 234 235 236 237 238 239 240 241
dibenz[a,h]anthracene and fluorene (up to 5 pg.kg-1) and acenaphtylene (up to 20 pg.kg-1). In this paper, the 16 PAHs are presented and discussed as their quantification frequency was higher than 60%.
Alkylphenols (4-n-nonylphenol, octylphenol, para-tert-octylphenol, tert-butylphenol) and DEHP were analyzed by the La Drôme laboratory (Valence, France), by GC-MS. Limits of quantification were 10 pg.kg-1 for alkylphenols and 100 pg.kg-1 for DEHP. In this paper, only substances with a quantification frequency higher than 60% are presented, i.e 4-n- nonylphenol and DEHP. Analytical uncertainties of these organic contaminants were estimated at 60% (k=2) for concentrations lower than 3-times the LQ and 30% (k=2) for concentrations higher than 3-times the LQ. For concentrations higher than 3-times the LQ, this value was confirmed by interlaboratory trials (Charpentier, 2016).
2.7. SPM and contaminant fluxes calculation
One important question regarding the impact of flushing operations is to determine their relative contribution to SPM transport compared to flood events. Such a comparison requires an estimation of the influence of both types of events over a longer time scale. The Jons station allows an estimation of the annual SPM fluxes from 2011 to 2016 (based on hydrological years, i.e. from September to August). The SPM fluxes were calculated from the mean hourly discharge and SPM concentration time series and cumulated over periods of flood events, flushing operations, or years (Poulier et al., 2019). Contaminant fluxes were calculated by multiplying the hourly SPM flux by the particulate contaminant concentrations. Station-specific median particulate contaminant concentrations were used for the non- monitored periods to fill gaps in the measured time series (Poulier et al., 2019). The BDOH
242 243 244 245 246 247 248 249 250 251 252 253 254 255 256 257 258 259 260 261 262
tool was used to do the calculation of SPM and contaminant fluxes (Branger et al., 2014), and data are available online (Thollet et al., 2018).
2.8. Classification according to hydrological conditions
In order to investigate the impact of flushing operations, results were compared to baseflow and flood conditions using data collected at Jons from 2011 to 2016. Samples classified as "flushing period" refer to those collected between 06/04/2012 00:00 and 06/22/2012 15:00. Samples were classified as "flood samples" if the corresponding discharge was higher than a 800 m3.s-1 discharge threshold (i.e., half the 2-year flood discharge (Launay, 2014)). For time-integrative samples collected with a PT, classification was based on the SPM proportion related to the different hydrological states. For each PT sample, the corresponding SPM flux was calculated using turbidity values for the entire period of collection (total SPM flux) and for the period with water discharge higher than the flood threshold (SPM flux during flood). The PT samples were classified as flood samples if the SPM flux during the flood event represented more than 50% of the total SPM flux. The other samples were classified as "baseflow samples".
3. Results
3.1. Variation of water discharge, SPM concentration and
quality during flushing operations
At Jons, the discharge ranged from 343 to 1600 m3.s-1 (maximum reached on June 14) during the 2012 flushing operations, while SPM concentration ranged from 10 to 905 mg.L-1 (maximum reached on June 13) (Figure 3). The POC concentration was 13.5 ± 3.8 mg.kg-1
263 264 265 266 267 268 269 270 271 272 273 274 275 276 277 278 279 280 281 282 283 284
(mean ± standard déviation) but varied depending on the sampling method (see supplementary material #2 Table S1).
The PSD were mostly characterized by silt (fine silt (from 30 to 82%), coarse silt (5%- 70%)) and clay (0-34%, supplementary material #2 Table S1) depending on the sampling method (see supplementary materials #1.3). Sand particles were only observed in two samples and the proportion never exceeded 26% (supplementary material #2 Table S1).
The TME concentrations remained fairly stable during all the flushing period, while a decrease of the levels of Hg and PCBs was observed in the last collected sample (Figure 4 - supplementary material #2 Table S2). For all the PAHs and 4-n-nonylphenol, the concentration of the first samples (collected from June 7 to 11) were at least 1.2 times higher (up to 6 times) than the two other samples (collected from June 11 to 16) (Figure 4 - supplementary material #2 Table S3). For DEHP, the only clear trend is a lower value (by a factor ten) found in the first sample.
3.2. Specificity of SPM characteristics during flushing events
3.2.1. Water discharge and SPM concentration
The water discharge measured at Jons during the 2012 flushing operations was similar to that of several floods occuring that year (Figure 3). Peaks of SPM concentration were concomitant to those of water discharge (June 13th and 14th), and the highest one during the flushing operation was almost 25% higher than during flood events (Figure 3). Due to sediment resuspension in reservoirs, for equivalent water discharge at Jons, mean SPM concentrations during the flushing operations of June 2012 were 8 times higher than during floods (Figure 5). In 2016, the discharge was lower than in 2012 (Figure 5) due to a
285 286 287 288 289 290 291 292 293 294 295 296 297 298 299 300 301 302 303 304 305 306 307
different management of the flushing operations (Diouf, 2017). However, the mean SPM
concentration was 6 times higher than during flood events at equivalent water discharge.
3.2.2. SPM Fluxes
From 2011 to 2016, the annual SPM fluxes ("output" fluxes) at Jons remained fairly constant with values ranging from 0.71 to 0.96 Mt.y-1. Flood events, representing 16-37% of the year duration, contributed to the major part of annual SPM fluxes and transported 48- 89% of the annual flux (Figure 6). While representing only 3-5% of the year (Figure 6), the contributions of 2012 and 2016 flushing operations represented 37% and 23% of the total annual SPM flux, respectively. However, the contribution in 2012 might have been overestimated due to a flood event occurring in two upstream tributaries (Ain and Fier) during the flushing operation of Verbois dam. Thus, the contribution of the 2012 event should range from 0.15 to 0.26 Mt (21-37% of the annual flux) (Launay, 2014). Lastly, SPM fluxes during baseflow conditions remained quite constant over the years and contributed to less than 20% of the total annual fluxes.
The water discharges and SPM concentrations measured at other monitoring stations located upstream, on the main tributaries, were used to estimate the "input" SPM fluxes at Jons (Poulier et al., 2019) (Figure 7). The two hydrological years with flushing operations (2012 and 2016) were characterized by higher output SPM fluxes compared to estimated input ones, with an export of about 0.1-0.2 Mt. In contrast, sediment storage of approximately 0.2 Mt.y-1 was observed during years without flushing operations and despite the occurrence of flood events (outputs < inputs). From September 2012 to August 2016 (i.e. the period starting from the end of a flushing operation to the end of the next one), about 0.6 Mt of SPM were thus stored in the Upper Rhône according to this estimation.
308 309 310 311 312 313 314 315 316 317 318 319 320 321 322 323 324 325 326 327 328 329 330
3.3.
Relative contribution of flushing events to SPM and
contaminant concentrations and fluxes
Contaminant concentrations, PSD and POC of samples collected during the 2012 flushing operations were compared to 2011-2016 data during other hydrological conditions (baseflow and flood) (Thollet et al., 2018). Regardless of the sampling period or sampling method used, SPM were mostly silt sized with a non-negligible proportion of clay (Table S4). Presence of sand remained very sparse. The POC concentrations were almost twice lower in samples collected during flushing operations than for the other periods (p < 0.01, Table S4).
Different trends were observed for the contaminants of interest. Concentrations were not statistically different during flushing operations, baseflow, and flood conditions for Cd ,4-n-nonylphenol (Figure 8), PCB118 and PCB153 (supplementary material #2 Table S5). For the other TME (Cu, Pb, Zn) and for PCB101 and PCB138, concentrations during flushing operations were significantly lower (p <0.05) than under baseflow regime but similar to values measured during flood events (Figure 8, Table S5). For Hg, the mean concentration during flushing operations (39 ± 6 pg.kg-1) was significantly lower than for other hydrological conditions (58 ± 15 pg.kg-1 for baseflow and 50 ± 12 pg.kg-1 for floods). PCB180 exhibited a similar behavior (Table S5). In contrast, SPM sampled during flushing operations were more contaminated by PAHs and DEHP than SPM sampled during baseflow or flood conditions (Figure 8). Due to a low number of samples (n=3-4), this increase was only significant (p < 0.05) for some of the PAHs including fluorene (Figure 8, Table S5).
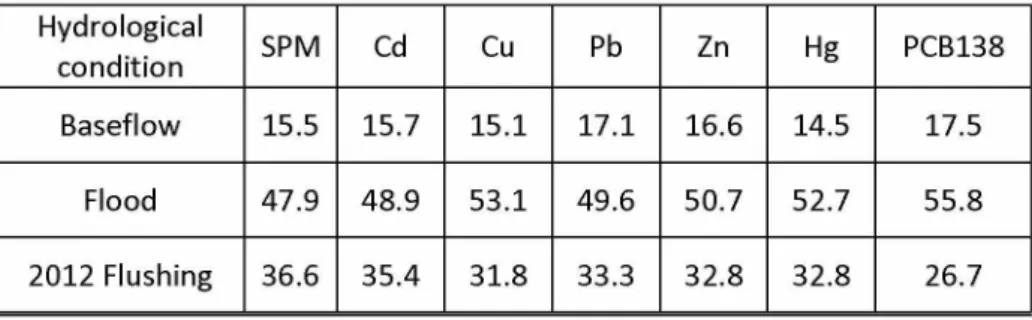
The fluxes of particulate contaminants during the June 2012 flushing operations were estimated based on discharge and SPM concentrations (Table 1). For all contaminants, the flushing operations transported about one third of the total annual flux.
331 332 333 334 335 336 337 338 339 340 341 342 343 344 345 346 347 348 349 350 351 352
4. Discussion
4.1. Why are SPM concentrations higher during flushing
operations than during flood events at équivalent water
discharge?
Our results demonstrate that the hydrological processes that occur during flushing operations are different from those occurring during flood events (Figures 5-7). In fact, the operations conducted on the dams by drawdown flushing to erode buried materials (Fruchard and Camenen, 2012) resuspended sediments that cannot be affected by flood events. This is why SPM concentrations were higher during flushing operations than flood events at equivalent water discharge. Thus, the use of a power relationship between discharge and SPM as described in Sadaoui et al. (2016) and Poulier et al. (2019) would lead to the underestimation of the SPM concentrations and fluxes transiting during flushing operations (Figure 5). For example, the total SPM fluxes during the 2012 and 2016 flushing operations would be 0.07 Mt and 0.05 Mt, respectively, when using the equation proposed by Poulier et al. (2019), i.e., almost 4 times lower than the measured fluxes (0.26 Mt and 0.19 Mt, respectively - Figure 7).
The excess of annual SPM flux measured at Jons during hydrological years with flushing operations is related to the resuspension of sediment stored during years without flushing (Figure 7). The flushing operations led to a substantial resuspension of silt-sized particles that were stored during other flood events (Table S4). However, this estimation indicates a disequilibrium in the SPM budget over the six years studied on the Upper Rhône River (2011 - 2016 - Figure 7). Therefore, part of the stored sediments was not sufficiently
353 354 355 356 357 358 359 360 361 362 363 364 365 366 367 368 369 370 371 372 373 374
resuspended during flushing operations to reach Jons, and an excess of 0.6 Mt of sediment was trapped in this area despite the 2012 and 2016 flushing operations. Additional investigation on the reservoirs of this area would be necessary to characterise the proportion of SPM stored and resuspended during extreme events.
4.2. Which parameters influence particulate contaminant
concentrations?
Variations of particulate contaminant concentrations were observed both during the flushing operations and during the different hydrological conditions.
First, the variations observed during the flushing operations for POC and several contaminant concentrations (Hg, PCBs; PAHs, 4-n-nonylphenol and DEHP) are mostly related to the PSD. The lowest concentrations of POC, PAHs and 4-n-nonylphenol were observed on samples collected from 06/11-14/2012 and characterized by at least two third of particles coarser than 15 pm (coarse silt and sand). Also, the highest concentration of POC (22.1 ± 0.9 mg.kg-1) was observed in the sample collected from 06/07-09/2012 with the second highest proportion of clay (17.5%). The increase in PAHs concentrations observed in the sample collected from the 06/09-11/2012 (Figure 4) was related to the resuspension of buried materials in the two most upstream dams as the operations started on 06/09/2012 at Verbois and Chancy-Pougny (Figure 2). This will be further discussed in the next section.
Second, the differences of POC and contaminants observed between the various hydrological conditions (Figure 8, Table S5) are related both to the particle size and the origin of the SPM. The decrease of concentrations observed during the flushing operations for most TME, Hg, PCB101, PCB138, and PCB150 is related to the PSD as such contaminants
375 376 377 378 379 380 381 382 383 384 385 386 387 388 389 390 391 392 393 394 395 396 397
are mainly adsorbed onto finest particles (Delle Site, 2001; Luoma and Rainbow, 2008; Steen
et al., 1978). In fact, coarser particles were transported during the flushing operations than
during flood events or baseflow (Table S4). Decrease of POC due to PSD was observed both on CFC and PT samples. However, the presence of different trends depending on the contaminant demonstrates that other parameters such as the origin of the particles or local hot spots might also be involved. In this area, input by tributaries might be characterized by different geochemical signature as the concentrations observed for TME and Hg were associated with the geological backgrounds of their watersheds (Poulier et al., 2019; Thollet
et al., 2018). For example, the mean concentration of Hg measured from 2011 to 2016
varied by a factor 5 between the Arve River (main SPM contributor - 0.026 ± 0.008 mg.kg-1, n = 16) and the Bourbre River (highest Hg concentration - 0.136 ± 0.040 mg.kg-1, n = 6). For the different behavior of the PAHs congeners (Table S5), preliminary results on PAHs concentration in SPM collected in the upper Rhône River demonstrate that the different congeners of PAHs have different origins, mainly road traffic and domestic heating (Botha et
al., 2014, Poulier et al., 2018).
Furthermore, preliminary work on modeling and fingerprinting conducted on SPM at Jons during the 2012 flushing operations confirmed that SPM mostly originated from the resuspension of SPM deposited in the dams (i.e. mainly from the Arve River) with a low contribution of particles freshly eroded from the other tributaries (Begorre et al., 2018).
Finally, our results confirmed that despite the observed variation of concentrations on the Upper Rhône River, contaminant fluxes transported during dam flushing operations were mostly driven by an increase of SPM concentration, rather than by a change in contaminant contents.
398 399 400 401 402 403 404 405 406 407 408 409 410 411 412 413 414 415 416 417 418 419 420
4.3.
Can we explain the increase of some particulate contaminant
concentrations?
The observed increase of PAHs and DEHP concentrations during the flushing operations compared to other hydrological conditions (Figure 8 - supplementary material #2 Table S5) may be related to the resuspension of legacy-contaminated sediments stored behind the dams, due to the drawdown flushing method used. In fact, the SPM resuspended and collected during the flushing operations were stored since 2003 (the last previous flushing operation), i.e. before the implementation of emission regulation of these pollutants (EC, 2008). On the other hand, SPM collected at Jons during baseflow and flood events started in 2011, i.e. after the implementation of the various regulations. PAHs are known to be produced mainly by incomplete combustion (pyrogenic processes) in domestic heating systems using wood (Hedberg et al., 2002; Sicre et al., 2008; Zhang and Tao, 2009). This induces higher PAH concentrations in urban areas and in winter. As reducing PAH emissions by 30% was a priority in the 2nd French National Health and Environment Plan (PNSE 2, 2009), the use of wood was gradually replaced by other more efficient heating systems. This was especially the case in the Arve basin (Figure 1), with a decrease of PAH emissions observed since 2008 (Atmo Auvergne-Rhône-Alpes, 2018). In fact, concentrations of Benzo[a]pyrene measured in SPM downstream of Chancy-Pougny from 2003 to 2008 (NAÏADES, 2019) ranged from 10 to 120 pg.kg-1 (48 ± 34 pg.kg-1, n=24). In 2009, concentrations dropped and ranged from 16 to 67 pg.kg-1 (38 ± 25 pg.kg-1, n=4). During the 2012 flushing operations, the highest concentration (143 pg.kg-1) was measured on the SPM sample collected at the beginning of the operations on the most upstream dam (06/09/2012 - Figure 1), and is therefore probably related to sediments stored before the regulation.
421 422 423 424 425 426 427 428 429 430 431 432 433 434 435 436 437 438 439 440 441 442
Finally, the increase of DEHP can also likely be explained by a change in régulations. In fact, DEHP is listed as a priority substance under the European Water Framework Directive (WFD; CEC, 2000). Its emissions are therefore regulated since 2008. DEHP was also included in 2011 in the Annex XIV of REACH by Regulation (EU, 2011), inducing the need of authorizations (and restrictions) for its specific uses.
5. Feedback for future studies on sediment dynamics and quality
during dam flushing operations
Our study demonstrates that SPM dynamics on the Upper Rhône River differed between flushing operations and natural floods, and confirms the necessity to monitor both discharge and SPM concentrations during such events. Also, the physico-chemical characteristics of SPM and associated contaminants might help to understand the dynamics and quality of the sediments. In this part, we focus on the best methodology to study sediment dynamics and quality during dam flushing operations.
i) Design the monitoring to assess SPM concentrations and associated fluxes
Both aspects (concentrations and fluxes) are important for assessing the ecological impact of dam reservoir flushing operations:
• For computing fluxes and mass budgets, continuous records of discharge and SPM concentration are required using gauging stations and turbidity records calibrated with frequent water samples. General relationships between SPM and discharge should not be used during flushing operations (see Figure 5).
• Monitor the entire flushing period for discharge and calibrated turbidity time series. We recommend assessing the type of flushing operations conducted (e.g.,
443 444 445 446 447 448 449 450 451 452 453 454 455 456 457 458 459 460 461 462 463 464
pressure flushing or drawdown flushing (Fruchard and Camenen, 2012; Kondolf et
al, 2014)).
ii) Select the contaminants and other physico-chemical parameters to assess SPM
quality
• Optimise the selection of contaminants based on the results of previous monitoring (baseflow, flood, dam flushing operations or on sediments stored behind dam reservoirs), including the screening of new contaminants that were not sought or detected before;
• Selection criteria include: priority pollutants according to regulations, performance of the analytical methods (limit of quantification, uncertainty) and emergent pollution, watershed anthropic pressure;
• Monitor SPM quality over extended periods of time. Time integrative sampling systems like passive particle traps are appropriate (Masson et al., 2018).
iii) Extend the observations beyond the dam flushing event (temporally and
spatially)
Comparison with other periods of time and various hydrological conditions (average, baseflow, floods, other dam flushing events) are necessary to assess the relative impact of a dam flushing operation:
• It is useful to have at least one monitoring station with multi-year records of discharge, SPM concentration and physico-chemical parameters (POC and PSD); • It is also important to monitor the discharge and SPM load of the main tributaries
465 466 467 468 469 470 471 472 473 474 475 476 477 478 479 480 481 482 483 484 485 486
of the tributaries might also help understand the results observed at the monitoring station.
• Store SPM samples in proper conditions and with associated documentation to allow for future analyses, in case suspicious results are obtained for a given contaminant, or for future re-analysis of past events, for other contaminant and/or using better analytical methods.
4. Conclusions
Variations of SPM and associated contaminant concentrations and fluxes were investigated from 2011 to 2016, including two dam flushing operations, at a permanent monitoring station located on the Upper Rhône River, France.
Despite the fact that flood events contributed to most of the annual flux of SPM, fluxes triggered by flushing operations were substantial (21-37% of the total annual SPM) despite their low annual duration (less than twenty days). These novel results demonstrate the necessity to have a long-term monitoring station located downstream to evaluate the impact of these operations.
Additional measurements of water discharge and SPM concentration along the Upper Rhône River and the main tributaries were used to investigate the spatial variation and to estimate the input/output SPM fluxes. The output fluxes measured at Jons were lower than the input fluxes during hydrological years without flushing operations and otherwise higher, attesting of a removal of the stored SPM. Flushing operations triggered the resuspension of sediments stored during flood events in reservoirs located along the Upper Rhône River. It is therefore crucial to continue such monitoring to investigate the fate of this excess of stored
487 488 489 490 491 492 493 494 495 496 497 498 499 500 501 502 503 504 505 506 507 508
sediment. Moreover, the composition of SPM changed during flushing operations as demonstrated by the analysis of several parameters and contaminants. Although the variations of POC and contaminants during the flushing operations were mostly related to changes in particle size, the origin of particles (e.g., resuspension of deeply stored sediments) was also important. Finally, we shared a general methodology to conduct similar monitoring.
Acknowledgements
This study was supported by the Rhône Sediment Observatory (OSR), a multi-partner research program partly funded by the Plan Rhône, and by the European Regional Development Fund (ERDF) allocated by the European Union. The PhD scholarship of Marina Launay was funded by the Region Rhône-Alpes (convention number: 12-013144-01 for the PhD third year). We would like to thank the OSR staff for water and suspended sediment sampling during the flushing operations and for their helpful and constructive comments, especially: F. Eyrolle, J. Gattacceca, G. Grisot, M. Lagouy and F. Thollet. We are very grateful to CNR, DREAL ARA, SIG and EDF services for cooperating with OSR and sharing their monitoring data.
Reference
AFNOR, 2009. NF ISO 10694: Particle Size Analysis - Laser Diffraction Methods. 51 pp.
AFNOR, 2000. XP X33-012: Characterisation of sludges - Determination of polynuclear aromatic hydrocarbons (PAH) and polychlorinated biphenyls (PCB). 28 pp.
AFNOR, 1995. NF ISO 10694: Soil quality - Determination of organic and total carbon after dry combustion (elementary analysis). 7 pp.
509 510 511 512 513 514 515 516 517 518 519 520 521 522 523 524 525 526 527 528 529 530 531
Antonelli, C., Eyrolle, F., Rolland, B., Provansal, M., Sabatier, F., 2008. Suspended sediment and 137Cs fluxes during the exceptional December 2003 flood in the Rhone River, southeast France. Geomorphology 95, 350-360. https://doi.org/10.1016/i.geomorph.2007.06.007
Atmo Auvergne-Rhône-Alpes, 2018. Amélioration des connaissances sur les transferts Air- Eau des HAP - Mesures en vallée de l'Arve (report in French).
Begorre, C., Dabrin, A., Masson, M., Grisot, G., Dherret, L., Eyrolle, F., Veron, A., Mourier, B., Coquery, M., 2018. Origin and historical inputs of suspended particulate matter from the Rhône tributaries: use of the non-reactive geochemical signature of particles. in: EGU General Assembly Conference. p. 16371.
Botta, F., Albinet, A., Emmanuelle, U., Leoz-Garzandia, E., 2014. Origine des HAP dans les milieux aquatiques - Bilan des méthodes d'identification des sources applicables au domaine de l'eau et premier choix des profils caractéristiques appropriés. ONEMA - INERIS : 46 p (report in French).
Brandt, A., 2000. A review of reservoir desiltation. Int. J. Sediment Res. 15, 321-342.
Branger, F., Thollet, F., Crochemore, M., Poisbeau, M., Raidelet, N., Farissier, P., Lagouy, M., Dramais, G., Le Coz, J., Guérin, A., Tallec, G., Peschard, J., Mathys, N., Klotz, S., Tolsa, M., 2014. Le projet base de données pour les observatoires en hydrologie : un outil pour la bancarisation, la gestion et la mise à disposition des données issues des observatoires hydrologiques de long terme à Irstea. La Houille Blanche, 33-38. https://doi.org/10.1051/lhb/2014005. (report in French).
Bravard, J.-P., Clémens, A., 2008. Le Rhône en 100 questions. Méditerranée, Groupe de Recherche Rhône-Alpes sur les Infrastructures et l'Eau (report in French), 295 pp.
532 533 534 535 536 537 538 539 540 541 542 543 544 545 546 547 548 549 550 551 552 553 554
Bravard, J.P., Gaydou, P., 2015. Historical development and integrated management of the rhône river floodplain, from the Alps to the Camargue Delta, France, Geomorphic Approaches to Integrated Floodplain Management of Lowland Fluvial Systems in North America and Europe. https://doi.org/10.1007/978-1-4939-2380-9 12
Bretier, M., Dabrin, A., Bessueille-Barbier, F., Coquery, M., 2019. The impact of dam flushing event on dissolved trace elements concentrations: Coupling integrative passive sampling and discrete monitoring. Sci. Total Environ. 656, 433-446. https://doi.org/10.1016/i.scitotenv.2018.11.303
Brown, C.B., 1944. The control of reservoir silting. US Gov. Print. Off. 521, 168 pp. Charpentier, R., 2016. Bilan sur les incertitudes et les zêta-scores. AGLAE, 38pp.
Delle Site, A., 2001. Factors affecting sorption of organic compounds in natural sorbent/water systems and sorption coefficients for selected pollutants. A review. J. Phys. Chem. Ref. Data 30, 187-439. https://doi.org/10.1063/1.1347984
Di Silvio, G., 2001. Basic classification of reservoirs according to relevant sedimentation processes, in: Proceedings of The Congress-International Association For Hydraulic Research. pp. 285-293.
Diouf, S., 2017. Barrages de Verbois et Chancy-Pougny - Abaissements de mai 2016 - Tome 1 : bilan hydraulique et sédimentaire. SIG (report in French), 37 pp.
Diouf, S., 2013. Vidange-chasse des retenues de Verbois et de Chancy-Pougny - Campagne 2012 - Tome 1 : Bilan hydraulique et sédimentaire. SIG (report in French), 45 pp.
Dong, J., Xia, X., Zhang, Z., Liu, Z., Zhang, X., Li, H., 2018. Variations in concentrations and bioavailability of heavy metals in rivers caused by water conservancy projects: Insights from water regulation of the Xiaolangdi Reservoir in the Yellow River. J. Environ. Sci.
1-555 556 557 558 559 560 561 562 563 564 565 566 567 568 569 570 571 572 573 574 575 576 577 9. https://doi.Org/10.1016/i.ies.2018.02.009
Dugué, V., Walter, C., Andries, E., Launay, M., Le Coz, J., Camenen, B., Faure, J.B., 2015. Accounting for hydropower schemes' rules in the 1-D hydrodynamic modeling of the Rhône River from Lake Geneva to the Mediterranean Sea., in: 36th IAHR World Congress. The Hague - Netherlands.
Dumas, C., Ludwig, W., Aubert, D., Eyrolle, F., Raimbault, P., Gueneugues, A., Sotin, C., 2015. Riverine transfer of anthropogenic and natural trace metals to the Gulf of Lions (NW Mediterranean Sea). Appl. Geochemistry 58, 14-25. https://doi.org/10.1016/i.apgeochem.2015.02.017
EC, 2008. Directive 2008/98/EC of the European Parliament and of the Council of 19 November 2008 on waste and repealing certain directives. Off. J. Eur. Union 3-30. Espa, P., Brignoli, M.L., Crosa, G., Gentili, G., Quadroni, S., 2016. Controlled sediment
flushing at the Cancano Reservoir (Italian Alps): Management of the operation and downstream environmental impact. J. Environ. Manage. 182, 1-12. https://doi.org/10.1016/Menvman.2016.07.021
EU, 2011. Annex XIV of REACH by Regulation (EU). Off. J. Eur. Union 5 p.
Evrard, O., Laceby, J.P., Lepage, H., Onda, Y., Cerdan, O., Ayrault, S., 2015. Radiocesium transfer from hillslopes to the Pacific Ocean after the Fukushima Nuclear Power Plant accident: A review. J. Environ. Radioact. 148, 92-110. https://doi.org/10.1016/Menvrad.2015.06.018
Ferrand, E., Eyrolle, F., Radakovitch, O., Provansal, M., Dufour, S., Vella, C., Raccasi, G., Gurriaran, R., 2012. Historical levels of heavy metals and artificial radionuclides reconstructed from overbank sediment records in lower Rhône River (South-East
578 579 580 581 582 583 584 585 586 587 588 589 590 591 592 593 594 595 596 597 598 599 600
France). Geochim. Cosmochim. Acta 82, 163-182. https://doi.Org/10.1016/i.eca.2011.11.023
Frings, R.M., Ten Brinke, W.B.M., 2018. Ten reasons to set up sediment budgets for river management. Int. J. River Basin Manag. 16, 35-40. https://doi.org/10.1080/15715124.2017.1345916
Fruchard, F., Camenen, B., 2012. Reservoir sedimentation: different type of flushing-friendly flushing example of Genissiat dam flushing. ICOLD Int. Symp. Dams a Chang. world 6 pp. Grimardias, D., Guillard, J., Cattanéo, F., 2017. Drawdown flushing of a hydroelectric reservoir on the Rhône River: Impacts on the fish community and implications for the sediment management. J. Environ. Manage. 197, 239-249. https://doi.org/10.1016/Menvman.2017.03.096
Guertault, L., Camenen, B., Peteuil, C., Paquier, A., 2014. Long term evolution of a dam reservoir subjected to regular flushing events. Adv. Geosci. 39, 89-94. https://doi.org/10.5194/adgeo-39-89-2014
Hauer, C., Wagner, B., Aigner, J., Holzapfel, P., Flodl, P., Liedermann, M., Tritthart, M., Sindelar, C., Pulg, U., Klosch, M., Haimann, M., Donnum, B.O., Stickler, M., Habersack, H., 2018. State of the art, shortcomings and future challenges for a sustainable sediment management in hydropower: A review. Renew. Sustain. Energy Rev. 98, 40 55. https://doi.org/10.1016/i.rser.2018.08.031
Hedberg, E., Kristensson, A., Ohlsson, M., Johansson, C., Johansson, P.Â., Swietlicki, E., Vesely, V., Wideqvist, U., Westerholm, R., 2002. Chemical and physical characterization of emissions from birch wood combustion in a wood stove. Atmos. Environ. 36, 4823 4837. https://doi.org/10.1016/S1352-2310(02)00417-X