Economic Feasibility of
Shipping Containers Through the Arctic
byMASRussell Pollock
B.S. Naval Architecture and Marine Engineering Webb Institute, 2008
SACHUSETTS INSTfiTiTE
OF TECHNOLOGY
JUL
1 0 2009
LIBRARIES
SUBMITTED TO THE DEPARTMENT OF CIVIL AND ENVIRONMENTAL ENGINEERING IN PARTIAL FULFILLMENT OF THE REQUIREMENTS FOR THE DEGREE OF
MASTER OF SCIENCE IN TRANSPORTATION
AT THE
MASSACHUSETTS INSTITUTE OF TECHNOLOGY
June 2009
ARCHIVES
© 2009 Massachusetts Institute of Technology All rights reserved
Signature of Author ... Depart Certified by ... Accepted by ... ... 1-01 . , ... . .o. ... ... .... :ment of Civil and Environmental Engineering
May 8, 2009
...
Henry S. Marcus
SAf ,/,,besis Supervisor
Jva Ilcl vcl LIallU Chairman, Departmental Committee for Graduate Students
Economic Feasibility of
Shipping Containers Through the Arctic
by
Russell Pollock
B.S. Naval Architecture and Marine Engineering Webb Institute, 2008
SUBMITTED TO THE DEPARTMENT OF CIVIL AND ENVIRONMENTAL ENGINEERING ON MAY 8, 2009 IN PARTIAL FULFILLMENT OF THE REQUIREMENTS FOR THE DEGREE OF
MASTER OF SCIENCE IN TRANSPORTATION
Abstract
As the Arctic ice cover continues to retreat, the possibility of regular transit through the Arctic becomes an increasing reality. Liner companies could take advantage of distance savings (up to 4000 nautical miles less than existing routes) available from transit through the Arctic by offering faster port-to-port voyage times while simultaneously reducing voyage expenses.
The purpose of the study is to investigate the economic feasibility of a liner service with shipping routes through the Arctic. To accomplish this, information pertaining to Arctic conditions, containerships and icebreakers, and container ports was collected and used to build a model that estimates the expense and time of port-to-port voyages through the Arctic. Different combinations of vessels, routes, and speeds through the Arctic were evaluated with the model. The expense and time of the Arctic voyages were then compared to the equivalent
existing liner routes.
The likelihood of year-round reliable containership service through the Arctic in the future depends on one's perspective. One the one hand, it won't happen for decades due to the presence of ice. Current predictions of a largely ice-free Arctic range from 2030 to later than 2100. On the other hand, if some favorable assumptions are made, it deserves serious consideration once minimally ice-strengthened containerships are able to be reliably escorted through the Arctic at a speed of 10kts.
Acknowledgements
The author would like to thank the American Bureau of Shipping for the funding and support that made this report possible. Specifically, Peter Tang-Jensen and his colleagues provided valuable assistance during this project.
This study was accomplished with the support and assistance of many individuals who merit recognition for their contributions. First, the author would like to thank Professor Hank Marcus for his invaluable guidance and supervision as advisor of this study. Dr. Lawson Brigham provided several Arctic studies and presentations and answered countless questions regarding icebreaker operations. Rob Dvorak completed his graduate thesis, Engineering and
Economic Implications of Ice-Classed Containerships, at the same time as this study and
provided advice many technical details pertaining to ice-strengthening. Finally, the sources used in the liner and LNG shipping industries deserve thanks for providing technical and operational data for this study.
Executive Summary
As the Arctic ice cover continues to retreat, the possibility of regular transit through the
Arctic becomes an increasing reality. Liner companies could take advantage of distance savings
(up to 4000 nautical miles less than existing routes) available from transit through the Arctic by
offering faster port-to-port voyage times while simultaneously reducing voyage expenses.
The purpose of the study is to investigate the economic feasibility of a liner service with
shipping routes through the Arctic. To accomplish this, information pertaining to Arctic
conditions, containerships and icebreakers, and container ports was collected and used to build
a model that estimates the expense and time of port-to-port voyages through the Arctic.
Different combinations of vessels, routes, and speeds through the Arctic were evaluated with
the model. The expense and time of the Arctic voyages were then compared to the equivalent
existing liner routes. The primary conclusions from the study are:
* Routes that achieve significant distance savings through Arctic transit, such as Northern Asia to Northern Europe, have the potential to offer a lower voyage cost and substantially lower voyage time than corresponding existing routes. * Present day Arctic conditions allow for these advantages during summer months
only. Ice conditions during at least the four most severe winter months greatly increase voyage expenses and transit times, eliminating the possibility of current year-round consistent liner schedules.
* Arctic conditions need to allow an average speed through the Arctic of at least 10 knots during all times of the year before regular service through the Arctic begins to look attractive.
Arctic Routes
There are three routes that can be used to cross the Arctic Ocean: the Northern Sea
The Northern Sea Route follows the northern coast of Russia. It currently has the most
favorable ice conditions for transit and is nearly ice-free four months of the year. Resultantly,
the model created in this study uses the NSR. Portions of the NSR have been in use since the
1930's when the former U.S.S.R. used it to supply towns along the Siberian coast. Nearly all
commercial use ended with the collapse of the U.S.S.R. Portions of the NSR are currently used
for mineral transport from Russian mines. Russia is currently trying to persuade the United
Nations that the Arctic seabed is on the Eurasian continental shelf which would provide weight
to Russia's desire to claim territorial waters extending to and including the North Pole.
A northwestern passage from Europe to the Far East was sought as early as the 1 5th
Century. Existence of what is known today as the Northwest Passage was proven in the 1800s
but not transited non-stop until 1944. The NWP, which leads through the Canadian Arctic
Archipelago and above the northern coast of Alaska, has not been used for commercial
transport due to severe, unpredictable ice conditions and has historically been less navigable
than the NSR. Canada has declared control over most of the NWP, a claim not recognized by
the United States or the European Union who view the NWP as an international strait. The
designation of international strait implies a "right of passage" through any territorial waters.
If the Arctic ice cap continues to decrease in size, it may be possible in the future to sail
directly over the North Pole. Such a route would be outside the control of Russia and Canada
and would avoid the relatively shallow waters in portions of the NSR and NWP.
Vessels
Several different types of containerships, as well as a dedicated icebreaker, were used in
different alternatives for Arctic transit. Two sizes of containership (750 TEU and 5000 TEU)
were investigated.
There are currently five nominally 750 TEU icebreaking containerships in continuous use
today in the Arctic. The designer of the vessels, Aker Arctic, also has a conceptual design for a
5000 TEU icebreaking containership that is based on the 750 TEU vessels. The icebreaking
containership is capable of independent operation in ice but is at least twice as expensive to
build as a standard containership.
The minimally ice-strengthened containership used in the study is ice-strengthened
according to ABS Ice Class Al. When travelling through ice-covered waters, it is escorted by an
icebreaker. The ice-strengthened containership has the same principal characteristics as the
standard containership with the exception of additional steel and equipment added to the hull
according to the ice class.
The standard containership was primarily used in the study to calculate the voyage
expense and time for existing liner routes. Principal characteristics and operational expenses
for the 750 TEU and 5000 TEU standard containerships were provided by industry sources.
The 5000 TEU vessel's predicted ice capabilities were used to model an icebreaker
escort for alternatives using a minimally ice-strengthened containership. If the
ice-strengthened containership will encounter ice during its voyage, it is escorted by an icebreaker.
While two different sizes of containerships were analyzed with the model, this study
focuses on the larger 5000 TEU containership. The 750 TEU containership was found to be too
Cases
Theoretical alternatives were created using favorable Arctic conditions in order to show what conditions will be necessary to make Arctic routes attractive to container services. Of all the alternatives evaluated, the most relevant are listed below.
Case 6: Standard Containership, Suez Canal, 22.2kts
This base case uses an existing route and is used to evaluate the Arctic cases.
Case 5: Standard Containership, NSR, Unescorted, 22.2kts
While certainly not possible in present-day conditions, this is the best possible case as it is allows a standard containership to operate at service speed through the shorter Arctic route.
Case 4: Ice-strengthened Containership, NSR, Unescorted, 22.2kts
This case is the same as the previous with the exception of slightly higher capital and operating costs due to the ice-strengthening.
Case 3: 8 months Ice-strengthened Containership, NSR, Unescorted, 22.2kts
4 months Transshipment to Icebreaking Containership, 6.5kts
During the 4 winter months, the ice-strengthened containership delivers containers to a port close to the Arctic, where they are transshipped to an icebreaking containership for delivery to a port on the other side of the
Arctic. The containers are then loaded on another ice-strengthened
containership for delivery to the destination port.
Case la: 8 months Ice-strengthened Containership, NSR, Unescorted, 22.2kts 4 months Ice-strengthened Containership, NSR, Icebreaker Escort, 17.5kts
The last three cases are the least capital intensive alternatives while ice is present in the NSR. An ice-strengthened containership is escorted through the Arctic at the service speed of the icebreaker. While this is not realistic today, it is used to demonstrate sensitivity to speed.
Case Ib: 8 months Ice-strengthened Containership, NSR, Unescorted, 22.2kts
4 months Ice-strengthened Containership, NSR, Icebreaker Escort, 10kts
When an ice-strengthened containership can be escorted at 10kts or more during every part of the year, Arctic liner routes become potentially attractive alternatives to existing routes. Even if the containership lies at anchor, slow steams, or makes an extra port call to account for the 6.5 day time difference between the 8mo speed and 4mo speed, it is faster to use the NSR than the corresponding existing route. If the icebreaker escort is fully subsidized, significantly lower expenses are incurred over the base.
Case Ic: 8 months Ice-strengthened Containership, NSR, Unescorted, 22.2kts
4 months Ice-strengthened Containership, NSR, Icebreaker Escort, 5.5kts A containership averaging 5.5kts through the Arctic during the winter months
cannot provide regular container service year round because the winter voyage time is twice that of the voyage time if the vessel makes 22.2kts. 5kts
is the current average speed of the 5000 TEU containership through the Arctic during the 4 worst winter months.
All cases start with the same origin and destination ports, the same fuel oil price, and
the same number of containers. The last three cases, Cases la-1c, were analyzed with and
without the cost of an icebreaker escort to take into account the possibility of a government
subsidized escort. To investigate the effect of fuel price on the relative expense of Arctic
transit, alternatives were evaluated at $250, $500, and $1000 per ton. Many assumptions were
made in the analysis and it is acknowledged that different conclusions may be reached if
different assumptions are used. The model was specifically created to allow users the ability to
evaluate the effect of their own assumptions. The Arctic cases oversimplify real-world
operations and are not intended to be interpreted as presently realistic alternatives.
Concluding Comments
Containership owners and operators should be particularly interested in watching the
presence of oil tankers and LNG carriers in the Arctic. As the ice cover melts, a strong desire
has emerged to search for and recover natural resources in the Arctic. Containerships will be
able to take advantage of the support infrastructure developed to service the petroleum
industry and learn from their operational experience in the Arctic.
The likelihood of year-round reliable containership service through the Arctic in the
future depends on one's perspective. One the one hand, it won't happen for decades due to
the presence of ice. Current predictions of a largely ice-free Arctic range from 2030 to later
than 2100. On the other hand, if some favorable assumptions are made, it deserves serious
consideration once minimally ice-strengthened containerships are able to be reliably escorted
Table of Contents
Table of Contents... ... ... ... 9
List of Tables and Figures ... ... .. ... 11
Definitions and Nom enclature ... 12
1.0 Chapter 1: Introduction... .... ... ... ... 13
1.1 O bjectives ... ... ... ... 13
1.2 Tasks ... . ... ... 13
1.3 H istory... ... . ... ... 15
1.4 Background ... .. ... 16
2.0 Chapter 2: Description of Scenarios... 17
2.1 Scenario 1: Ice-strengthened Containership, Icebreaker Escort... . 17
2.2 Scenario 2: Icebreaking Containership ... 17
2.3 Scenario 3: Standard Containership, Transshipment to Icebreaking Containership... 18
2.4 Scenario 4: Standard Containership, Unescorted ... 18
2.5 Scenario 5: Standard Containership, Canal Route... 18
3.0 Chapter 3: Ports and Shipping Routes... 19
3.1 Origin-Destination Ports ... ... 19
3.2 Selected Routes ... 20
3.3 Transshipm ent Ports... ... .. ... 21
3.3.1 Port of Adak, Alaska ... ... 21
3.3.2 Port of M urm ansk, Russia... ... 21
3.3.3 Additional Considerations ... ... .... ... ... . 22
4.0 V essels ... ... ... 23
4.1 Standard Containership ... 23
4.2 Icebreaking Containership ... ... 23
4.3 Ice-strengthened Containership... 24
4.4 Aker DAPPB Concept ... ... ... 25
4.5 Icebreaker Escort... 26
5.0 A nalysis ... 27
5.1 M odel... ... . ... ... 27
5.2 Present Day ... 27
5.3 Hypothetical Cases ... ... 29
5.2.1 Case 6: Standard Containership, Suez Canal, 22.2kts ... 30
5.2.2 Case 5: Standard Containership, NSR, Unescorted, 22.2kts ... 30
5.2.3 Case 4: Ice-strengthened Containership, NSR, Unescorted, 22.2kts ... 32
5.2.4 Case 3: 8mo Ice-strengthened Containership, 4mo Transshipment... 33
5.2.5 Case la: Ice-strengthened, 8mo Unescorted 22.2kts, 4mo Escorted 17.5kts ... 35
5.2.6 Case Ib: Ice-strengthened, 8mo Unescorted 22.2kts, 4mo Escorted 10kts... 37
5.2.7 Case Ic: Ice-strengthened, 8mo Unescorted 22.2kts, 4mo Escorted 5.5kts ... 39
5.3 Requirements for Commercially Viable Liner Service Through NSR ... 42
6.0 Conclusions ... 45
6.1 Considerations in Real World... 45
6.1.1 Vessel Lim itations ... ... 45
6.1.2 Navigational and Operational Issues... ... 45
6.1.3 Governmental Policy ... 47
6.2 Future of Arctic Shipping ... 48
Bibliography... 50
Sources Co nsulted ... 51
Appendix A: M odel User M anual... 52
A .1 O pening the M odel... ... ... 52
A.2 Entering General Inputs ... 53
A.3 View ing M odel Results ... ... ... 54
A.4 View ing Vessel Inform ation ... 54
A.5 View ing Port Inform ation ... ... 54
A.6 Viewing Route Information... 54
Appendix B: Selected M odel Sheets ... 56
Appendix C: Favorable Assumptions ... 69
List of Tables and Figures
Table 1.1: List of Scenarios...14
Table 3.1: Route Distance Comparison ... 20
Table 4.1: Standard Containership Characteristics ... ... 23
Table 4.2: 5000 TEU Icebreaking Containership Characteristics ... 24
Figure 1.1: N orilsk N ickel ... 16
Figure 4.1: Representative Containership ... 23
Figure 5.1: Present Day Expenses ... 28
Figure 5.2: Present Day Voyage Times ... 28
Figure 5.3: Present Day Average Expenses...29
Figure 5.4: Case 5 Voyage Expenses ... 31
Figure 5.5: Case 5 Voyage Time ... . ... 31
Figure 5.6: Case 4 Voyage Expenses ... 32
Figure 5.7: Case 4 Voyage Time ... ... 33
Figure 5.8: Case 3 Expenses ... ... 34
Figure 5.9: Case 3 Voyage Time ... ... 35
Figure 5.10: Case la Expenses (Paid Escort) ... 36
Figure 5.11: Case la Expenses (Free Escort) ... 37
Figure 5.12: Case la Voyage Time...37
Figure 5.13: Case lb Expenses (Paid Escort) ... 38
Figure 5.14: Case lb Expenses (Free Escort) ... 39
Figure 5.15: Case lb Voyage Time ... ... 39
Figure 5.16: Case ic Expenses (Paid Escort) ... 40
Figure 5.17: Case ic Expenses (Free Escort) ... 41
Figure 5.18: Case ic Voyage Tim e ... 41
Figure 5.19: Case Average Expense ... ... 42
Figure 5.20: Case lb, Constant Voyage Times ... 43
Figure 5.21: Case lb Expense, Constant Voyage Times ... 44
Figure 6.1: Deck Ice Removal ... 46
Figure 6.2: Nighttim e Visibility ... 47
Definitions and Nomenclature
hr Hour km Kilometer kt nm/hr nm Nautical mile, 1.852km kW Kilowatt m Meter t Metric ton dwt DeadweightTEU Twenty foot Equivalent Unit
LOA Length Over All
LBP Length Between Perpendiculars
B Beam
D Depth
T Draft
Standard Containership Non ice-classed containership
NSR Northern Sea Route
1.0 Chapter
1:
Introduction
1.1 Objectives
The objectives of this research project are: (1) to identify alternative scenarios for
moving containers through the Arctic, (2) to study the ship designs and economics involved in
each scenario, and (3) to point to the key issues that should be monitored for future
development. The purpose of these objectives is to investigate the economic feasibility of using
Arctic shipping routes to transport containers from origin to destination port. The process by
which these objectives will be realized is detailed below.
1.2 Tasks
The first portion of this project involves collecting research related to Arctic shipping
and identifying relative information. Particular attention was given to any work involving
container shipping through the Arctic, as there is little published information in this area.
Projections of less-severe ice conditions in the future shed light on the increasing attractiveness
of transporting containers through the Arctic. Sea trials of new Arctic vessel designs, such as
Aker Arctic's Double Acting Ship (DAS), have validated preliminary performance predictions.
Studying past works related to Arctic shipping provided data inputs for the analysis and aided in
the creation of realistic operating scenarios. Section 1.3 highlights a few recent developments
in Arctic shipping.
After reviewing the collected literature, alternative operating scenarios were identified
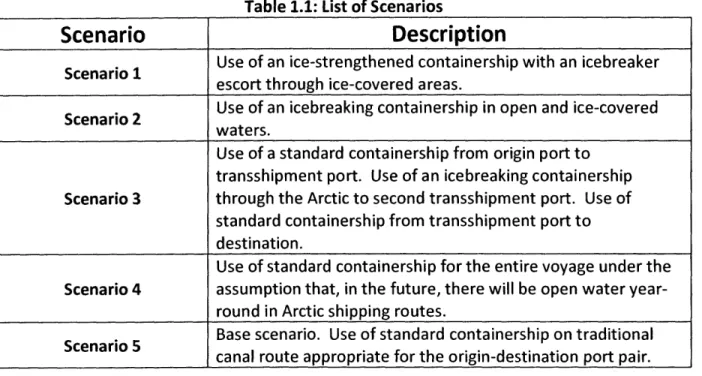
and investigated. Four Arctic scenarios were created and will be compared to a base scenario
using traditional shipping routes. Table 1.1 gives brief descriptions of the five scenarios created
Table 1.1: List of Scenarios
Scenario
Description
Use of an ice-strengthened containership with an icebreaker
Scenario 1
escort through ice-covered areas.
Use of an icebreaking containership in open and ice-covered
Scenario 2
waters.
Use of a standard containership from origin port to transshipment port. Use of an icebreaking containership
Scenario 3 through the Arctic to second transshipment port. Use of
standard containership from transshipment port to
destination.
Use of standard containership for the entire voyage under the
Scenario 4 assumption that, in the future, there will be open water
year-round in Arctic shipping routes.
Base scenario. Use of standard containership on traditional
Scenario 5
canal route appropriate for the origin-destination port pair.
To best illustrate the potential advantage of shipping containers through the Arctic,
origin-destination ports were chosen that have Arctic routes significantly shorter than the
regularly used existing canal routes. Chapter 3 discusses the chosen origin-destination ports, transshipment ports, and shipping routes.
The final step in the data gathering process was to identify vessel designs needed for
each scenario and obtain their associated capital and operating expenses. Vessel data was
acquired from industry sources and previous research. A description of the vessels used in the
study may be found in Chapter 4.
After information on ports, routes, and containerships was collected, a computer model
was created to analyze the alternative scenarios. The data was then entered in the model to
compare the characteristics of each scenario. The model allows for a comparison of scenarios
vessel. An overview of the computer model and instructions for use may be found in Appendix
A.
The analysis, found in Chapter 5, was performed using the computer model to evaluate
the scenarios at each route and month combination. Criteria for evaluation will include items
such as capital expense, fuel costs, operating expenses, length of voyage, and total cost per
Twenty foot Equivalent Unit (TEU) shipped. Conclusions in Chapter 6 regarding the feasibility of
each scenario were drawn from the results of the analysis.
1.3 History
Sea trade between Europe and the Far East led to the desire to find a shorter trade
route in the 15th century. After North America succeeded in blocking Columbus's western
voyage to India, England sent John Cabot in search of a Northwest sea passage to Asia in 1497.
Similarly, the English began looking for northeast sea route to China and India in the 1550s.
Henry Hudson, for whom Hudson Bay is named, explored parts of what are today the
Northwest Passage (NWP) and the Northern Sea Route (NSR). The Russian Great Northern
Expeditions mapped much of the coast and waters along the NSR from 1733-1742. Swede Nils
A. E. Nordenski6ld became the first person to transit the NSR by sea in 1879. The NWP was first
transited by sea in 1906 after Roald Amundsen's arduous three-year voyage. It was not until
1944 that a Royal Canadian Mounted Police schooner sailed through the NWP for the first time
without becoming stuck in ice during the winter season. The Administration of the Northern
Sea Route was officially established by the U.S.S.R. in 1932 and supported commercial transit
until the breakup of the Soviet Union, after which NSR traffic rapidly declined. The NWP has yet
1.4 Background
In September of 2008, the NWP and NSR were simultaneously open for the first time
since satellite observation began in the 1970s [1]. As the extent of Arctic sea ice continues to
shrink, the feasibility of commercial shipping through the Arctic Ocean becomes an increasing
reality. Norilsk Nickel, a Russian mining company, recently built an icebreaking containership
(Figure 1.1) to transport metallurgical products from Dudinka to Murmansk, Russia. By early
2009, the company had five of these vessels capable of independent year-round operation on
their routes [2]. Since 2002, Fortum, a Nordic energy company, has been operating two
106,000 dwt icebreaking tankers year-round in the Baltic Sea [3]. Container services will be
able to take advantage of shorter Arctic routes between ports and the absence of canal fees as
Arctic ice cover continues to shrink.
e 1.1: Norilsk Nickel
2.0 Chapter 2: Description of Scenarios
In the decades ahead, a container service through the Arctic may take on any number of
forms. This study captures a broad range of possibilities by looking at five operating scenarios.
Scenarios vary by vessel type, use of transshipment ports or non-stop service, and assisted or
unassisted transit through ice-covered waters. All scenarios use current ice conditions as
simulated by the Aker Arctic Shuttle Container Link study. Scenarios may be infeasible in
current Arctic ice conditions, but become viable and attractive as conditions become less
severe. A base scenario using a standard containership sailing on the appropriate canal route is
included for comparison.
2.1 Scenario 1: Ice-strengthened Containership, Icebreaker Escort
A containership with ice strengthening travelling through the Arctic will need an
icebreaker escort when it reaches heavily ice-covered waters. The capital costs associated with
this scenario are only slightly greater than those of the base scenario due to added weight
involved with added hull steel and adaption of machineries to the Arctic environment.
However, total transit costs associated with the use of one, possibly two, icebreaker escorts will
be high.
2.2 Scenario 2: Icebreaking Containership
Currently, an icebreaking containership is the only vessel capable of solitary year-round
Arctic container transport. Despite this distinction, Aker Arctic estimates speeds below 3kts in
portions of the NSR during the coldest month of the year [4]. An icebreaking containership has
high capital and operating costs, but avoids the expense of an escort and should be the fastest
2.3 Scenario 3: Standard Containership, Transshipment to Icebreaking Containership
Transshipment allows ice-classed vessels to remain in the Arctic, where they operate
most cost-efficiently. A particularly appealing aspect of the use of transshipment ports is that
any containership can be used to deliver cargo to the port for Arctic transport. A non
ice-classed containership will sail to a (future) transshipment port close to the Arctic, such as
Murmansk, Russia, or Adak, Alaska, where its cargo will be unloaded and transferred to an
icebreaking containership of the same capacity. The icebreaking containership will carry
containers to a transshipment port on the other side of the Arctic, where the process is
reversed. This scenario assumes the existence of transshipment ports along the chosen route.
2.4 Scenario 4: Standard Containership, Unescorted
Scenario 4 represents the extreme case of ice-free Arctic transit. Such a case may be
realized in the future if the extent of Arctic ice continues to decrease. This scenario will show
the significant transit time savings of Arctic routes when compared to corresponding traditional
routes, as the standard containership will operate at speeds in excess of 22kts in ice-free waters
instead of breaking heavy ice at 3kts.
2.5 Scenario 5: Standard Containership, Canal Route
The Arctic scenarios will be compared to Scenario 5, which can be thought of as a base
scenario. It will model the shortest shipping route, i.e. Panama or Suez canals, for a given
origin/destination port pair. For instance, from Hamburg to Yokohama, the route will lead
through the Suez Canal. A route from Seattle to Rotterdam will use the Panama Canal. The
3.0 Chapter 3: Ports and Shipping Routes
Overseas container liner services are characterized by fast, consistent, year-round
transport of goods. Notwithstanding storms or machinery breakdowns, containership
companies are expected to be unwavering in their schedule. Many current routes are
dependent on either the Panama or Suez canals. A closing of one of these would seriously
impact international shipping. Arctic routes offer shorter distances between existing
origin-destination ports and eliminate the dependency on canals.
"In the 21st century, Arctic seaways have the potential to serve as a major avenue for shipping between these continents (Asia, Europe, and North America), as explorers envisioned as early as 500 years ago." [5]
In the future, container liners could use the NSR and NWP to shorten transit times, reduce fuel
costs, increase frequency of service, and avoid canal congestion.
3.1 Origin-Destination Ports
Container liner operators could see large benefits in using Arctic routes between the
following regions: Northern Asia to Northern Europe, US West Coast to Northern Europe, and
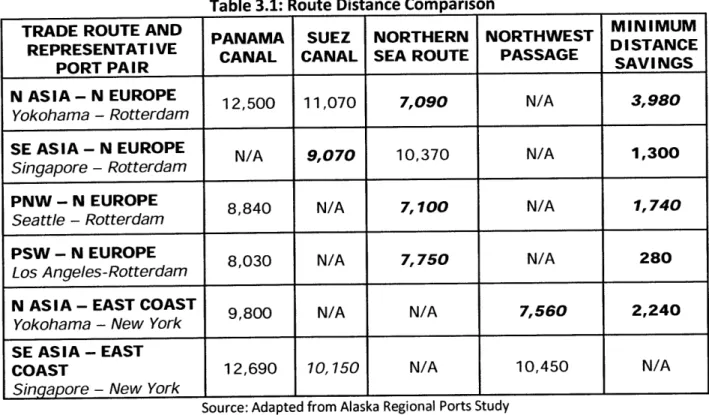
Northern Asia to the US East Coast. Arctic routes offer significant reductions in distance when
compared to the current canal routes (Table 3.1). A direct container service between
Yokohama and Rotterdam could reduce the route distance by 3600 nm by sailing through the
NSR rather than following the normal Suez Canal route. For a given origin-destination pair, the
shortest Arctic and canal route were chosen. For instance, the base scenario for the Yokohama
Table 3.1: Route Distance Comparison
TRADE ROUTE AND PANAMA SUEZ NORTHERN NORTHWEST MINIMUM
REPRESENTATIVE CANAL CANAL SEA ROUTE PASSAGE DISTANCE
PORT PAIR SAVINGS
N ASIA - N EUROPE
N ASIA - N EUROPE 12,500 11,070 7,090 N/A 3,980
Yokohama - Rotterdam
SE ASIA - N EUROPE N/A 9,070 10,370 N/A 1,300
Singapore - Rotterdam
PNW - N EUROPE
PNW - N EUROPE 8,840 N/A 7,100 N/A 1,740
Seattle - Rotterdam
PSW - N EUROPE
PSW - N EUROPE 8,030 N/A 7,750 N/A 280
Los Angeles-Rotterdam
N ASIA - EAST COAST 9,800 N/A N/A 7,560 2,240
Yokohama - New York
SE ASIA - EAST
COAST 12,690 10, 7150 N/A 10,450 N/A
Sinqapore - New York
Source: Adapted from Alaska Regional Ports Study
3.2 Selected Routes
Routes were chosen for the analysis based on the port pairs that had the biggest
difference in distances between the canal routes and Arctic routes. Yokohama - Rotterdam
and Seattle - Rotterdam were chosen because their shipping routes through the Arctic have
significantly shorter distances than the canal route alternatives and trade between the ports is
large enough to justify regular container service. The Seattle - Rotterdam base route uses the
Panama Canal. Transit and wait times and canal fees are based on the existing canal
infrastructure, as opposed to the canal after the expansion project is completed. Routes using
the NWP were not included because unpredictable ice conditions in the passage make speed
estimations unreliable. However, as the Arctic ice cover continues to shrink, the NWP may be a
3.3 Transshipment Ports
The use of transshipment ports allows for dedicated vessels serving Arctic routes.
Ice-classed vessels operating in open water typically have higher operating costs than non
ice-classed vessels because of the compromise between performance in ice and open water. A
transshipment port is ideally located on an Arctic shipping route near the Arctic yet in a region
with open water year-round. Standard containerships can sail in ice-free waters and
load/unload containers at transshipment ports. Ice-classed containerships can transport
containers between transshipment ports, limiting the operational area of these vessels to the
region in which they were designed to operate. Representative potential transshipment ports
are discussed below.
3.3.1 Port of Adak, Alaska
Adak, a former Cold War naval air station in the Aleutian Islands, is well-situated as a
North Pacific transshipment port. The Navy closed the station in 1997 leaving an enormous
airbase and port facility largely unused. Currently owned by the Aleut Corporation, the existing
port facilities built by the Navy would easily allow for the construction of a large container
terminal. As a naval air station, Adak was home to over 6,000 people; according to the 2000
census, 316 people were living on Adak. A transshipment port would revitalize Adak and take
advantage of many pre-existing facilities on the island.
3.3.2 Port of Murmansk, Russia
One of the few Arctic ports that are continually ice-free, Murmansk lies at the western
container terminal has been proposed as part of a recent port development plan in anticipation
of transshipment operations [6]. Construction is expected to begin this year [7].
3.3.3 Additional Considerations
In addition to those listed above, other ports deserve further research. Iceland is
situated halfway between the eastern edge of the NWP and western edge of the NSR. A port in
Iceland could serve as a transshipment facility for NSR traffic bound for the US or Europe and
NWP traffic bound for Europe. Ports of northern Europe are close enough to the NSR to
consider the elimination of a transshipment port for NSR traffic headed to ports such as
4.0 Vessels
4.1 Standard Containership
Information on the non ice-classed containership used in the scenarios was provided by
an industry source. The nominally 5000 TEU vessel's principal characteristics are shown in
Table 4.1. Figure 4.1 shows a containership representative of the vessel described in the table.
Table 4.1: Standard Containership Characteristics
LOA (m) 294 LBP (m) 283 B (m) 32.2 D (m) 21.8 T (m) 13.5 TEU 4,800 MCR (kW) 51,390 Max Speed (kts) 25 Source: Industry
Fi2ure 4.1: Reoresentative Containership
Source: http://containerinfo.co.ohost.de
4.2 Icebreaking Containership
The icebreaking containership used in the analysis is the Aker Arctic 5,000 TEU Arctic
study. The design is based on Aker's Double Acting Ship (DAS) design (Figure 1.1). A general
arrangement and lines plan of the 5,000 TEU DAS concept are contained in Appendix D. In
open water and light ice conditions, the vessel sails bow-first. When greater icebreaking
capability is needed, the vessel operates with the icebreaking stern leading the way. The
rationale behind the unconventional design is that it allows better open water performance
than traditional icebreakers. The DAS concept uses azimuthing thrusters, rather than
conventional shafted propellers as a means of propulsion. When operating stern-first,
additional icebreaking performance is gained from the "flushing" action of the thrusters. The
propeller wash of the thrusters moves broken ice away from the hull, clearing a path for the
ship. Principal characteristics of the 5000 TEU icebreaking containership may be found in Table
4.2.
Table 4.2: 5000 TEU Icebreaking Containership Characteristics
LOA (m) 281 LBP (m) 269 B (m) 34.6 D (m) 21.3 T (m) 13.5 DWT (t) at 9m draft 68,000 TEU 5,000 Shaft Power (kW) 35,000 Max Speed (kts) 19
Source: Arctic Shuttle Container Link Study
4.3 Ice-strengthened Containership
The range of capabilities defined by "ice-strengthened" classifications ranges from
and Economic Implications of Ice-Classed Containerships, contains a detailed analysis of
regulatory ice classes. This study will use ABS ice class Al because it gives a good balance
between ice performance and operating cost. A heavily ice-strengthened containership was
deemed undesirable for the purposes of this study because it would closely match the
icebreaking containership. The characteristics of the ice-strengthened containership will be
very similar to those of the standard containership with the exception of increased weight for
the hull and adaption of machineries to the Arctic environment. Compared to a standard
containership, the ice-strengthened containership will have an approximately 2-3% increase in
weight, a 1-2% increase in construction cost, and a 1-2% increase in fuel and operating costs [8].
There is no increase in power requirements. Thus, the capital cost and operating characteristics
of an ice-strengthened containership will be slightly higher than that of a standard
containership.
4.4 Aker DAPPB Concept
The Double Acting Pusher Puller Barge concept developed by Aker Arctic and Wartsila
aims to reduce the compromise between open water and icebreaking performance and
operating cost of an icebreaking cargo ship [9). Similar to Aker Arctic's Double Acting Ship
(DAS) design, the DAPPB is an integrated tug barge (ITB) that will be pushed through open
water by a pusher tug and pulled through the ice by an icebreaking tug. The bow of the barge is
designed for open water performance, while the icebreaking puller tug is optimized for ice
conditions. The DAPPB is advertized as an oil tanker, but could also be designed as a container
barge. The DAPPB may be a future possibility for Arctic container shipping, but the concept
4.5 Icebreaker Escort
Scenario 1 uses icebreakers as escorts through the Arctic region. The capabilities and
expenses of the 5000 TEU Icebreaking Containership are used to approximate a dedicated
5.0 Analysis
5.1 Model
The model used to perform the analysis was created using Microsoft Excel. It is
composed of spreadsheets that contain data concerning routes, ports, vessels, and cargo.
Appendix A contains instructions for using the model as well as selected spreadsheets from the
model. Containerships of 5000 TEU and 750 TEU are used in each scenario to show the effect
of scale on the shipping expenses. In addition to the sheets displaying the scenarios for the two
containership sizes, the 'Comparison' sheet contains graphical comparisons of the 5000 TEU
scenarios, the 'Cases' sheet contains the hypothetical cases constructed for Section 5.3, and the
'Data Justification' sheet lists the source or rationale for data used in the model. An electronic
copy of the model is submitted with the report.
5.2 Present Day
The two most important factors in the feasibility of an Arctic route are the total voyage
expense and seasonal time variability. If the voyage time fluctuates by more than a day or two,
a regular container service would be difficult to establish because additional ships would have
to be used during periods of long voyage times in order to keep the same route capacity. As
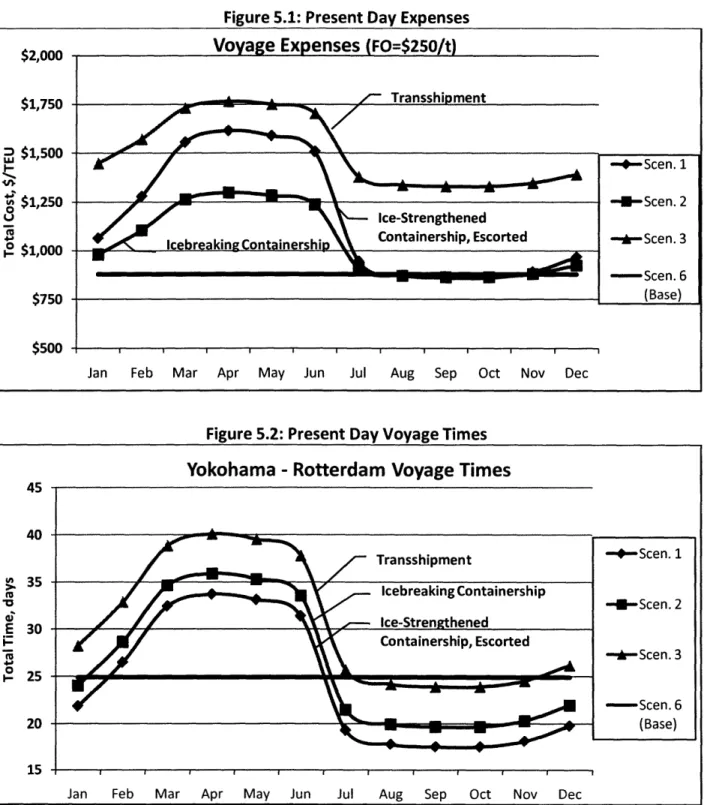
can be seen in Figure 5.1, Scenarios 1 and 2 incur similar expenses to the base scenario for 6
months of the year. Their voyage times are relatively constant and much shorter than the base
case for the same 6 months (Figure 5.2). For the remaining half of the year, however, both
voyage expenses and time increase substantially.
July through December, NSR conditions are favorable enough for Scenarios 1 and 2 to
allow 5 day shorter voyages for nominally the same expense as the base route, but the poor
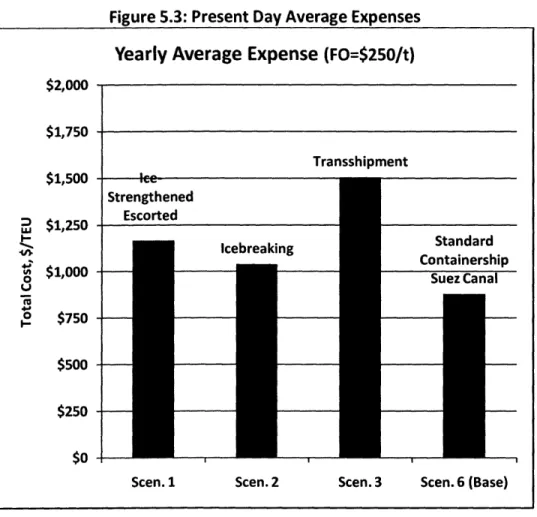
service. Even if the time variability were overlooked, Figure 5.3 shows that the existing Suez
Canal route is less expensive over the course of a year. There is currently too much ice cover in
the NSR to allow its establishment as a viable alternative to existing routes.
Figure 5.1: Present Day Expenses
Voyage Expenses (FO=$250/t)
$2,000 $1,750 $1,500 $1,250 $1,000 $750 $500 -4-Scen. 1 -- )-Scen. 2 -*-Scen. 3 - Scen. 6 (Base) Transshipment Ice-Strengthened
Icebreakin Containership Containership, Escorted
Jan IJun Jul Aug Sep Oct Nov Dec
Jan Feb Mar Apr May Jun Jul Aug Sep Oct Nov Dec
Figure 5.2: Present Day Voyage Times
Yokohama - Rotterdam Voyage Times
Transshipment Icebreaking Containership Ice-Strengthened Containership, Escorted -4-Scen. 1 -I-Scen. 2 -*-Scen. 3 - Scen. 6 (Base)
Figure 5.3: Present Day Average Expenses Yearly Average Expense (FO=$250/t)
$2,000 $1,750 Transshipment $1,500 le Strengthened S$1,250 Escorted SIcebreaking Standard Containership o 0 Suez Canal 4 $750 $500 $250 $0
Scen. 1 Scen. 2 Scen. 3 Scen. 6 (Base)
5.3 Hypothetical Cases
As shown in Section 5.2, current conditions make regular Arctic liner service commercially infeasible. The following hypothetical cases purposely use favorable assumptions to show what conditions are needed for Arctic container routes to become attractive alternatives to existing routes. Appendix C contains a list of major assumptions. All cases were constructed by modifying data in the present-day scenarios. The numbers used to describe the cases match the most similar present-day scenarios. All cases use Yokohama and Rotterdam as origin and destination ports, vessels with a nominal capacity of 5000 TEU at an 85% load factor, and a fuel oil cost of $500/t.
If Arctic ice cover decreases year after year, eventually the NSR will be ice-free 12
ice-free NSR. Before Arctic conditions could develop that permit operations as described in
Cases 5 and 4, the NSR would be largely ice-free for most of the year but be obstructed by ice
during the coldest portion of the year. Cases 3 and 1 simplify this by assuming ice-free transit 8
months out of the year and the need for icebreaking capability 4 months out of the year. In
other words, the NSR is ice-free for 8 months and obstructed by ice for 4 months.
5.2.1 Case 6: Standard Containership, Suez Canal, 22.2kts
Case 6 represents the voyage time and expenses for a 5000 TEU standard containership
sailing from Yokohama to Rotterdam via the Suez Canal. This base case represents a current
route that the following cases may be compared to. Most liner routes have intermediate stops
that serve many smaller ports between the main origin and destination. Case 6 uses a two-port
voyage to simplify the model and make the case directly comparable to the Arctic cases. Costs
and time associated with passage through the Suez Canal are included in this case. With the
exception of canal transit, the containership runs at 22.2kts from port to port. The one-way
voyage expense of $1,082/TEU and time of 24.9 days is constant throughout the year and
shown for comparison in the figured describing the cases below.
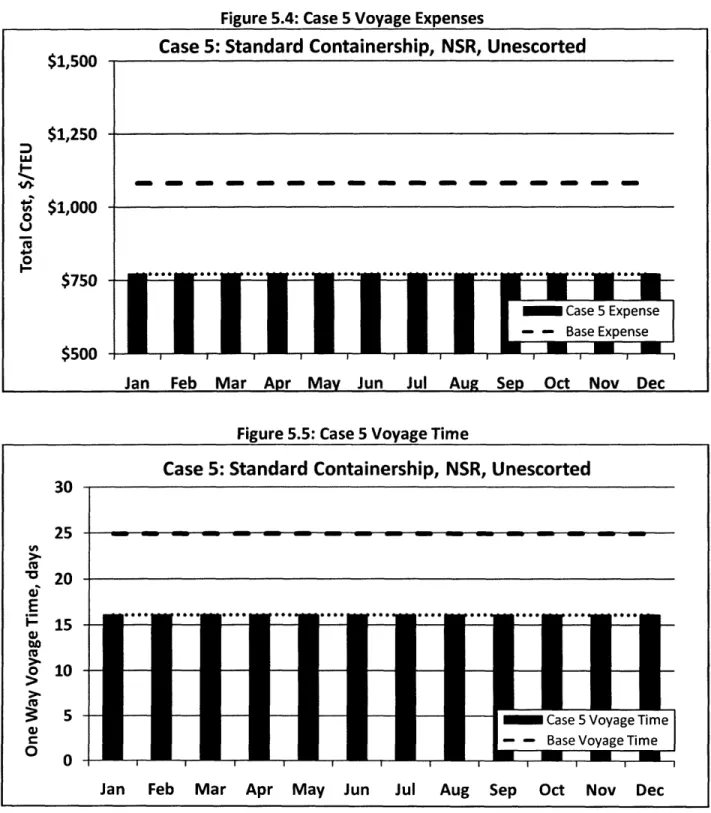
5.2.2 Case 5: Standard Containership, NSR, Unescorted, 22.2kts
Case 5 is the "best case" voyage that illustrates the time and cost savings possible if the
NSR was ice-free. As in Case 6, the values are constant due to the hypothetical absence of ice.
Figure 5.4 shows a difference of $310/TEU between Case 5 and Case 6. This substantial savings
5,000 TEU standard containership would be capable of 4 more round-trip voyages, or 40,000
more TEU moved, per year using the NSR than the same vessel using the existing Suez Canal
route. If the NSR were to become continually ice-free, many container routes could be
significantly shortened through its use.
Figure 5.4: Case 5 Voyage Expenses
Case 5: Standard Containership, NSR, Unescorted
$1,500 $1,250 I-U $1,000 0 $750 Case 5 Expense Base Expense $500
Jan Feb Mar Apr May Jun Jul Aug Sep Oct Nov Dec
Figure 5.5: Case 5 Voyage Time
Case 5: Standard Containership, NSR, Unescorted
30 25 -20 E 15 o 10
5 FCase 5 Voyage Time
a) - BaseVoyageTime
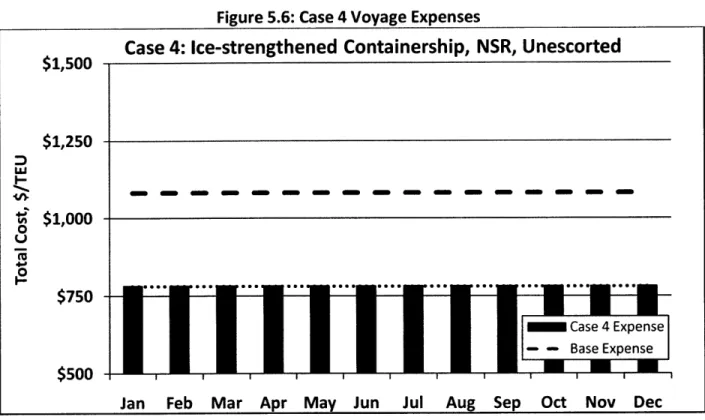
5.2.3 Case 4: Ice-strengthened Containership, NSR, Unescorted, 22.2kts
Use of an ice-strengthened containership is the single difference between Case 5 and
Case 4. The accepted definition of "ice-free waters" is waters that are less than 10% covered by
ice; therefore, the term can be very misleading. Operations of an ice-strengthened
containership would be much less affected by a small presence of ice because of a reinforced
hull. Figure 5.6 and Figure 5.7 show the voyage expenses and time associated with Case 4. The
slightly higher capital and operating expenses lead to a $10/TEU increase in voyage expenses
over Case 5. As the speeds of both ships are equal, voyage times are the same for Cases 4 and
5.
Figure 5.6: Case 4 Voyage Expenses
Case 4: Ice-strengthened Containership, NSR, Unescorted
$1,500 $1,250 w I-$1,000 0 $750 Case 4 Expense - - Base Expense $500
Figure 5.7: Case 4 Voyage Time
Case 4: Ice-strengthened Containership, NSR, Unescorted
30
25
---20
E
>10
-S 5 - Case 4 Voyage Time
O - - Base Voyage Time
0 1
Jan Feb Mar Apr May Jun Jul Aug Sep Oct Nov Dec
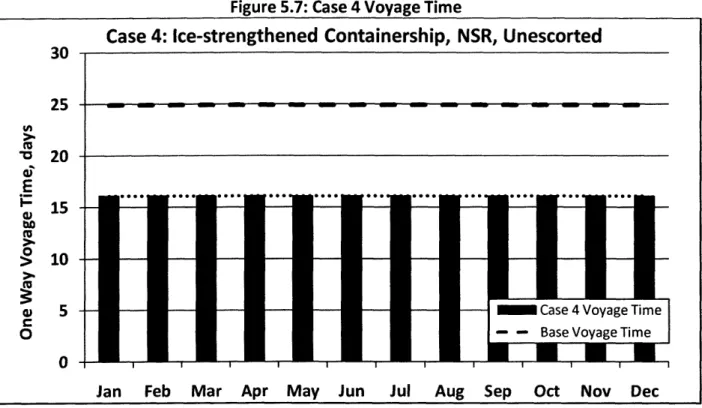
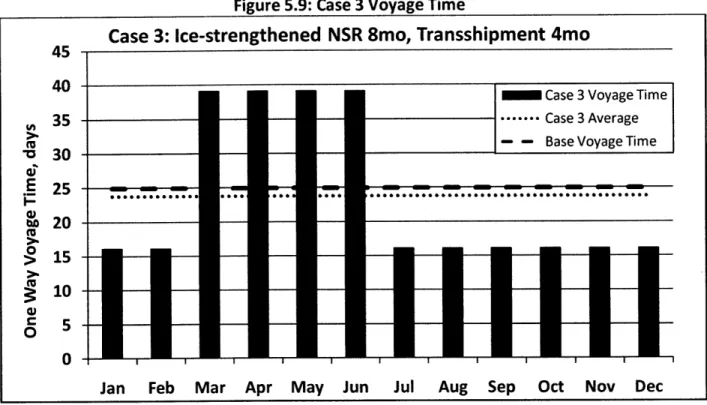
5.2.4 Case 3: 8mo Ice-strengthened Containership, 4mo Transshipment
Cases 4 and 5 show the potential time and cost savings possible if there was effectively no ice in the NSR. From an Arctic shipping perspective, they represent the best possible situation that is far from realistic today.
Case 3 simulates ice conditions 4 months out of the year and ice-free conditions for the remaining 8 months. An ice-strengthened containership is used to transport containers from origin to destination, as in Case 4, during the free months. The remaining 4 months, an ice-strengthened containership delivers containers to a hypothetical port in Adak, Alaska where they are transshipped to an icebreaking containership for transit through the NSR to Murmansk, Russia. An ice-strengthened containership then delivers the containers from Murmansk to Rotterdam.
As can be seen in Figure 5.8 and Figure 5.9, operation in ice significantly increases
voyage expenses and time. Three components lead to the increase in expenses. First, the 23
day increase in voyage time due to reduced speeds through ice and two transshipment port
calls more than doubles the total voyage time. Assuming year-round use of the icebreaking
containership, the total daily expense of ownership and operation is more than $33,000 above
that of the standard containership (Appendix A, 'Vessels' sheet). If the icebreaking
containership is idle for a portion of the year, expenses would drastically increase above what is
assumed in the calculation. The final component of increased expenses comes from calling at
the two transshipment ports. Interestingly, the average voyage time of Case 3 is slightly lower
than the base case. However, the average cost of shipping containers as described in Case 3 is
$123/TEU more than the existing (Base) route, which alone makes Case 3 an unattractive
alternative.
Figure 5.8: Case 3 Expenses
Case 3: Ice-strengthened NSR 8mo, Transshipment 4mo
$2,250
$2,000
$I
oI/-
Case 3 Expense
**** , Case 3 Average 3 $1,750 1-.-- Base Expense I-S$1,500 O u R $1,250 - $1,000 $750 $500
Figure 5.9: Case 3 Voyage Time
Case 3: Ice-strengthened NSR 8mo, Transshipment 4mo
45
-40 Case 3 Voyage Time
b 35 -
I
I
I
.... Case 3 Average, - - BaseVoyageTime
Jan Feb Mar Apr May Jun Jul Aug Sep Oct Nov Dec
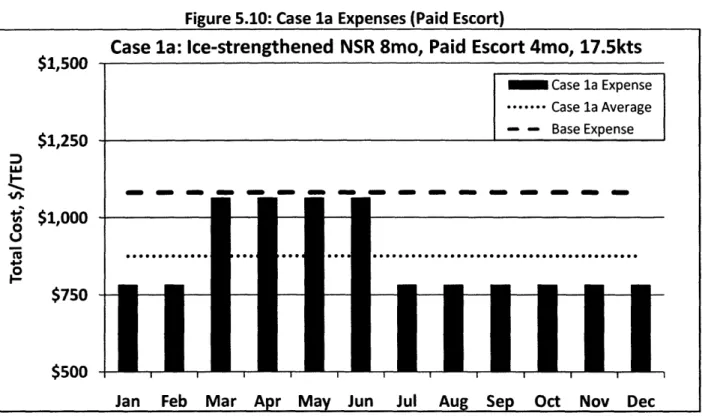
5.2.5 Case la: Ice-strengthened, 8mo Unescorted 22.2kts, 4mo Escorted 17.5kts
Using an icebreaker to escort an ice-strengthened containership through ice-covered
waters is an alternative to an icebreaking containership. Cases la through Ic are identical
except for the NSR transit speed during the 4 months of ice. The variations of speed in Case 1
show the overall voyage cost and time sensitivity to NSR transit speed. To show the effect of
the escort cost, the expense of each "sub-case" is shown with and without the escort fee. The
daily cost of owning and operating an icebreaking containership is used to approximate the
escort fee (Appendix A, 'Vessels' sheet).
Case la uses an ice-strengthened containership year-round with a 17.5kts escort
through the NSR during the 4 months of ice. While 17.5kts is unrealistic with the given ice
conditions, Figure 5.10 shows that at such a speed, Case la has lower voyage expenses than the
base case. If there was no escort fee, perhaps to promote use of the NSR, Figure 5.11 shows
- 0J S20 > 15 M 10 5 5 0 n
E
25l
l lIm-that the only cost difference between Case la and Case 4 is due to the slower transit speed
through the NSR.
The variability in one-way voyage time between ice and ice-free months is about 1.5
days which is small enough to allow a regular year-round service without adding additional
vessels during the ice-covered portion of the year. If Arctic conditions develop in the future
that allow an average speed through the NSR similar to that of Case la, year-round regular
service could be established that allows for one-way voyages 8 days shorter than the existing
Suez Canal route offers.
Figure 5.10: Case la Expenses (Paid Escort)
Case la: Ice-strengthened NSR 8mo, Paid Escort 4mo, 17.5kts
Case la Expense ... Case la Average - Base Expense - - - !- - - ---! -i $1,250 $1,000 o U $750 $500
Figure 5.11: Case la Expenses (Free Escort)
Case la: Ice-strengthened NSR 8mo, Free Escort 4mo, 17.5kts
$1,500 SCase la Expense ... Case la Average $1,250 -- Base Expense $1,000 0 U 12 $750 $500
Jan Feb Mar Apr May Jun Jul Aug Sep Oct Nov Dec
Figure 5.12: Case la Voyage Time
Case la: Ice-strengthened NSR 8mo, Escorted 4mo, 17.5kts
30 25 -" 20 15 o > 10
Case la Voyage Time
5 ** . Case la Average
O -- BaseVoyageTime
Jan Feb Mar Apr May Jun Jul Aug Sep Oct Nov Dec
5.2.6 Case ib: Ice-strengthened, 8mo Unescorted 22.2kts, 4mo Escorted 10kts
The speed of an icebreaker escort is not always dictated by its maximum capabilities. According to Dr. Lawson Brigham, former Deputy Director of the U.S. Arctic Research
Commission, a typical escort convoy will not exceed 10kts to avoid damage to the escorted
ships from high-speed collisions with broken ice left in the trail of the icebreaker. Case lb
simulates NSR ice conditions that allow for an average of 10kts transit speed.
Despite a 7.5kts decrease in NSR transit speed from Case la, even the voyage time in
the winter is still 2.5 days shorter than the Suez Canal route. However, 6.5 day variability
between ice and ice-free voyage times would present difficulties in establishing a regular
service (Figure 5.15). Over the course of a year, Figure 5.13 shows that Case lb yields a
$100/TEU lower expense per TEU than the base case even with an escort fee. If the escort fee
is removed the Case lb voyage expense decreases to $238/TEU less than the base case (Figure
5.14). While the average voyage expense is lower than that of the base case, the high
variability in voyage time, nearly one week, makes this case an unattractive alternative.
Figure 5.13: Case lb Expenses (Paid Escort)
Case Ib: Ice-strengthened NSR 8mo 22.2kts, Paid Escort 4mo
10kts Escort Speed Restriction
$1,500 Case lb Expense ****... Case lb Average 1,250- - Base Expense $1,000 0 o $750 f $500 Apr n - e r
Figure 5.14: Case lb Expenses (Free Escort)
Case Ib: Ice-strengthened NSR 8mo 22.2kts, Free Escort 4mo
10kts Escort Speed Restriction
Case lb Expense S...Case lb Average -- Base Expense U 7-. $1,000 $750 $500 im m m m m m
1--*
0
*
0
0I*
0
0I
1 *14.
I
0-0
-0 - - -11111111111 T - -- - 1 I I 1 I I IJan Feb Mar Apr May Jun Jul Aug Sep Oct Nov Dec
Figure 5.15: Case lb Voyage Time
Case Ib: Ice-strengthened NSR 8mo 22.2kts, Escorted 4mo
10kts Escort Speed Restriction 30 25 M 20 E e 15 M 0 o > 10 0 5 O 0
Eu..I
S...
a....
. I ...
I
. .
. '-
...
' "
"*a&
ur
mm
miww
[
Jan Feb Mar Apr May Jun Jul Aug Sep Oct Nov Dec5.2.7 Case ic: Ice-strengthened, 8mo Unescorted 22.2kts, 4mo Escorted 5.5kts
Case ic uses an escort speed of 5.5kts from March to June and, like Cases la and ib,
assumes an open water speed of 22.2kts for the remaining months. The present-day average
$1,500 $1.250 -- I , , , i , m ---- -- I I I I
~-~--SCase Ib Voyage Time
*...
Case Ib Average
-- BaseVoyageTime -I O QO000speed through the Arctic from March to June is 5.0kts. The Aker Arctic speed data, which uses
present-day ice conditions to predict transit speeds, drops as low as 4kts for portions of the
NSR, resulting in the long voyage times seen in Figure 5.18. Again, the seasonal variability in
voyage times would make it difficult to establish a regular container service in conditions like
this. The long NSR transit times greatly raise the voyage expense March through June (Figure
5.16), as this study assigns the icebreaker escort fee on a daily basis. If there were no escort
fee, Figure 5.17 shows that even with the long ice transit times, the average voyage expense
per container is $140 cheaper in Case lc than for the Suez Canal route.
Figure 5.16: Case 1c Expenses (Paid Escort)
Case Ic: Ice-strengthened NSR 8mo 22.2kts, Paid Escort 4mo
$2,250 5.5kts Arctic Speed 1l Case 1c Expense $2,000 ... Case 1c Average
D
$1/-
- Base Expense
$1,750(
$1,500
---Q $1,250 o $1,000 $750 $500Figure 5.17: Case Ic Expenses (Free Escort)
Case 1c: Ice-strengthened NSR 8mo 22.2kts, Free Escort 4mo
$2,500 5.5kts Arctic Speed $2,250 Case la Expense S...Case la Average $2,000 -- - Base Expense 1 $1,750 $1,500 0 i $1,250 $1,000 $750 $500
Jan Feb Mar Apr May Jun Jul Aug Sep Oct Nov Dec
Figure 5.18: Case 1c Voyage Time
Case Ic: Ice-strengthened NSR 8mo 22.2kts, Escorted 4mo
5.5kts Arctic Speed 30
U--o 25 E 20 F 2 0 w 15 0 > 10 * 5 0r - - - -m
w
l
z z z
.n.rrrr
l
II
II
Ff
Case Ic Voyage Time
- ,- Base Voyage Time
... Case Ic Average
i I I I I I I I I I I I
Jan Feb Mar Apr May Jun Jul Aug Sep Oct Nov Dec
5.2.8 Case to Case Comparison
While it is useful to examine the cases on an individual basis, it is difficult to see their
merits and disadvantages compared to one another using that method. From Figure 5.19, one
-can see that, based solely on expense, transshipment (Case 3) is not an attractive alternative to the existing Suez Canal Route (Case 6). The variations of Case 1 show the effect of speed through the NSR on the voyage expense. Even if it were possible to travel through the NSR at the containership's service speed (22.2kts) for 8 months of the year, it would be necessary to average at least 10kts through the NSR for the remaining 4 months (Case ib) in order to realize a significant advantage over the existing route. However, if Arctic conditions were to allow an ice-free NSR in the future, Cases 5 and 4 show that voyage expenses could be reduced by as much as 25% compared to the existing route (Case 6).
Figure 5.19: Case Average Expense
Yearly Average Voyage Expense
$1,500 $1,250 a $1,000 -4-1 o $750 -$500 -$250 -$0
-Case 6 Case 5 Case 4 Case 3 Case la Case lb Case 1c
Note: Cases la-1c include escort fee
5.3 Requirements for Commercially Viable Liner Service Through NSR
the future. In order for that to happen, the total voyage expense of an NSR route must be
lower than a corresponding existing route, and the total voyage time must be consistent and
shorter than that of an existing route.
Case lb uses an ice-strengthened containership travelling at 22.2kts for 8 months and at
10kts with an icebreaker escort for 4 months. When Arctic conditions allow for transit similar
to that described in Case lb, the voyage expense and time are both less than those of the
existing Suez Canal route. However, there is a 6.4 day difference between the ice and ice-free
voyage times. To achieve consistent times, the ice-free voyage times were increased to the
icebreaker escort voyage times, as shown in Figure 5.20. While the average time savings is
reduced from 6.7 days to 2.4 days, the average expense is $180/TEU less than the Suez Canal
route (Figure 5.21).
Figure 5.20: Case Ib, Constant Voyage Times
Case Ib: Consistent Voyage Times 40 35
S30
d 25--E > 20 -m 15 -010
-Case lb Mod Voyage Time
5 - -- Base Voyage Time
0 O0
Figure 5.21: Case lb Expense, Constant Voyage Times
Case Ib: Free Escort, Consistent Voyage Times
$1,500
$1,500 Case lb Modified S...Case lb Average - - Base Expense $1,250 t $1,000 0 U ' $750 $500-Jan Feb Mar Apr May Jun Jul Aug Sep Oct Nov Dec
To investigate the effect of fuel price on the voyage expense savings, fuel prices of $250/t and $1000/t were analyzed. As the price of fuel increases, the potential savings from Arctic transit increases due to burning less fuel due to a shorter voyage than the existing route. These numbers reflect the ship at anchor for 6.4 days during the 8 month ice-free period. Other alternatives include travelling at slower speeds or including an extra port stop during the 8 months.
Until it is possible to average at least 10kts through the NSR at any given time of the year, liner service through the Arctic will not be an attractive possibility. In fact, containership operators would want to be able to reliably travel at 10kts every trip, not just on average. Presently, it is not possible to average 10kts or more from February to June [4]. For those 5 months, the average speed through the NSR is 5.8kts, signifying that favorable conditions for
6.0 Conclusions
6.1 Considerations in Real World 6.1.1 Vessel Limitations
While Norilsk Nickel currently operates a fleet of five 750 TEU icebreaking
containerships between Dudinka and Murmansk, Russia, approximately a 1300nm voyage
through Arctic waters, the Aker Arctic 5000 TEU Icebreaking Containership is a concept that has
yet to be built. While Norilsk Nickel's nickel-carrying containerships give real-world credibility
to the 5000 TEU concept and its icebreaking capabilities have been estimated in Aker Arctic's
ice model basin, its true capabilities remain to be seen.
Use of an ice-strengthened containership, escorted as necessary appears to be the most
commercially viable option for Arctic transit. However, the beam of a 5000 TEU containership
(32m minimum) is wider than the 28m beam of the 50 Let Pobedy, the world's largest
icebreaker. Innovative alternatives to conventional icebreaking will be needed to avoid the use
of two escorts for containerships. Aker Arctic has developed a concept known as the oblique
icebreaker that makes a wider channel through the ice by moving sideways rather than straight.
If larger icebreakers are not built in the future and no alternatives come into being, two escorts
will be required or very small containerships, like the Norilsk Nickel would have to be used.
Both of these options would incur significantly higher voyage expenses.
6.1.2 Navigational and Operational Issues
The Arctic environment presents many challenges that must be met for successful
commercial operations. Training facilities and standards will need to be created in order to
to deal with the threat of icing, as shown in Figure 6.1. A sailor with an ice hammer has yet to
be replaced with a more effective method. Containerships travelling through the Arctic will be
especially vulnerable to icing due to the large surface area of container stacks. Thorough
underwater surveys need to be undertaken to produce accurate navigational charts to prevent
groundings. Emergency plans need to be made for Arctic towing, salvage, spills, and rescue, to
name a few. Nighttime ice navigation, essential for commercial vessels, presents many
challenges due to reduced visibility. Figure 6.2 shows how even light snow can severely restrict
visibility, which is essential to navigating through heavy ice.
Figure 6.1: Deck Ice Removal
i ...-