HAL Id: hal-00316903
https://hal.archives-ouvertes.fr/hal-00316903
Submitted on 1 Jan 2001
HAL is a multi-disciplinary open access
archive for the deposit and dissemination of
sci-entific research documents, whether they are
pub-lished or not. The documents may come from
teaching and research institutions in France or
abroad, or from public or private research centers.
L’archive ouverte pluridisciplinaire HAL, est
destinée au dépôt et à la diffusion de documents
scientifiques de niveau recherche, publiés ou non,
émanant des établissements d’enseignement et de
recherche français ou étrangers, des laboratoires
publics ou privés.
depletions over Kavalur, India
H. S. S. Sinha, P. K. Rajesh, R. N. Misra, N. Dutt
To cite this version:
H. S. S. Sinha, P. K. Rajesh, R. N. Misra, N. Dutt. Multi-wavelength imaging observations of plasma
depletions over Kavalur, India. Annales Geophysicae, European Geosciences Union, 2001, 19 (9),
pp.1119-1131. �hal-00316903�
Annales
Geophysicae
Multi-wavelength imaging observations of plasma depletions over
Kavalur, India
H. S. S. Sinha1, P. K. Rajesh1, R. N. Misra1, and N. Dutt1
1Physical Research Laboratory, Navrangpura, Ahmedabad 380 009, India
Received: 17 January 2001 – Revised: 18 June 2001 – Accepted: 18 July 2001
Abstract. Observations of ionospheric plasma depletions
were made over Kavalur (12.56◦N, 78.8◦E, Mag. Lat 4.6◦N), India during March–April 1998 using an all sky op-tical imaging system operating at 630 nm, 777.4 nm and 557.7 nm. Out of 14 nights of observations, plasma de-pletions were seen only on 9 nights. Except for 21 March 1998, which was a magnetically disturbed period, all other nights belonged to a magnetically quiet period. Some of the important results obtained from these observations are: (a) After the onset of the equatorial spread F (ESF), plasma depletions take typically about 2 hrs 40 min to come to a fully developed state, (b) There are three distinct types of plasma depletions: type 1 have an east-west (e–w) extent of 250–350 km with an inter-depletion distance (IDD) of 125– 300 km; Type 2 have an e–w extent of 100–150 km and IDD of 50–150 km; Type 3 have smallest the e–w extent (40– 100 km) and IDD of 20–60 km, (c) Most of the observed plasma depletions (> 82%) had their eastward velocity in the range of 25–125 ms−1. Almost stationary plasma depletions (0–25 ms−1) were observed on one night, which was magnet-ically disturbed. These very slow moving depletions appear to be the result of a modification of the F-region dynamo field due to direct penetration of the electric field and/or changes in the neutral winds induced by the magnetic disturbance, (d) On the night of 21/22 March 1998, which was a mag-netically disturbed period, plasma depletions could be seen simultaneously in all three observing wavelengths, i.e. in 630 nm, 777.4 nm and 557.7 nm. It is believed that this si-multaneous occurrence was due to neutral density modifica-tions as a result of enhanced magnetic activity. (e) Well de-veloped brightness patterns were observed for the first time in 777.4 nm images. Earlier, such brightness patterns were observed only in 630 nm and 557.7 nm images. These bright-ness patterns initially appear as very small regions in the northern part of the image and then in about 90 min time, they attain their peak brightness and encompass the entire field-of-view in about 2 hrs 30 min. In some cases, brightness
Correspondence to: H. S. S. Sinha ([email protected])
patterns contain one or two well developed plasma depletions within them. (f) The brightness patterns reported here differ from the earlier observations in that they do not show any differential behaviour in the direction of movement before and after the midnight, and that they are present for extended periods of time as large as 6 hrs.
Key words. Atmospheric composition and structure
(air-glow and aurora); Ionosphere (equatorial ionosphere; iono-spheric irregularities)
1 Introduction
Plasma depletions are large-scale structures of plasma den-sity associated with the phenomenon of the equatorial spread F. Ionospheric plasma depletions, first observed by Hanson and Sanatani (1973) using a satellite-borne experiment, have been observed subsequently by a number of in situ (Kel-ley et al., 1976; McClure et al., 1977; Benson and Briton, 1983; Jahn et al., 1997; Singh et al., 1997a) and ground-based (Weber et al., 1978; Mendillo and Baumgardner, 1982; Rohrbaugh et al., 1989; Sinha et al. 1991; Mukherjee et al., 1993; Sahai et al., 1994; Sinha, et al., 1996; Mendillo et al., 1997a, b; Taylor et al., 1997; Tinsley et al., 1997; Bittencourt et al., 1997; Fagundes et al., 1997, 1999; Sinha and Raizada, 2000) techniques.
Plasma depletions are produced in the equatorial F-region, move vertically upwards, diffuse along the magnetic field lines and reach lower altitudes at low-latitudes. Sometimes these depletions reach altitudes as high as 2500 km (Fagun-des et al., 1997; Woodman and LaHoz, 1976). It has been generally accepted that plasma depletions are generated in the bottom side of the F-region through the Generalized Rayleigh-Taylor instability mechanism. Various theoretical and experimental studies have identified gravity waves as the seed for the R-T instability to produce irregularities (Kel-ley et al., 1981, 1986; Huang and Kel(Kel-ley 1996; Singh et al., 1997a; Sinha and Raizada, 2000). Sinha and Raizada (2000)
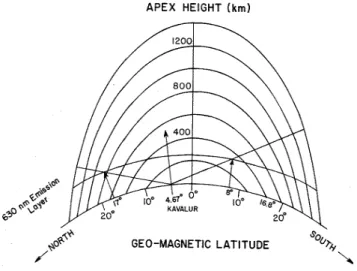
Fig. 1. Viewing geometry of the imager at Kavalur (12.56◦N, 78.8◦E, Mag. Lat 4.6◦N). A field-of-view of ±75◦ covers the 630 nm emission from 17◦N to 8◦S.
attributed gravity waves of either atmospheric origin or gen-erated in high-latitudes during geomagnetic disturbances, to be the seed for the generation of plasma depletions observed over SHAR. Understanding the mechanism of the generation of plasma depletions can be improved if one knows the prop-erties of plasma depletions and the corresponding geophysi-cal conditions at the time of formation, as well as during the growth phase. The location of Kavalur was selected so that it could be possible to observe the irregularities from their for-mative stage up to the generation of well developed deple-tion bands. The optical imaging campaign conducted from Kavalur during March–April 1998 has provided a very good data set, which sheds light on several interesting properties of these large-scale ionospheric irregularities.
2 Experimental details
An all sky optical imaging system developed at the Physi-cal Research Laboratory (PRL) was used for observing the plasma depletions over Kavalur. The original version of the instrument (Sinha et al., 1996) was modified and used for the present campaign from Kavalur. The major modification was the incorporation of a 552 × 816 × 12 bit CCD camera in-stead of a 35 mm film camera. The other change in the instru-ment was the computer controlled moveinstru-ment of a filter wheel instead of a manual filter deployment. These modifications resulted in the very precise recording of time and duration of exposures. This imaging system can be operated for ±5 nights around a new moon night. Three interference filters, with center wavelengths of 630.0 nm, 777.4 nm and 557.7 nm and a full width at half maximum (FWHM) of 1 nm, were used. As the size of the CCD array was slightly smaller than the size of the image of the sky made by the optical imager, the image has been slightly chopped off at the top and also at the bottom.
Images grabbed by the CCD camera were processed for flat field correction, image intensifier noise, background il-luminations and stationary features, as described by Sinha and Raizada (2000). Calculations of plasma depletion pa-rameters were made by using the assumption that 630 nm, 777.4 nm and 557.7 nm emissions come from layers which have their centroids located at 250 km, 350 km and 250 km, respectively. For estimations of the east-west extent and in-terdepletion distance, an east–west line scan of the image was taken for a number of pixels (±8) around an east-west line, passing through the center of the image (local zenith). The speed of the movement of plasma depletions was calculated from such line scans from a number of images taken every 15 min. In addition to plasma depletions, extended regions having a significantly higher brightness, as compared to the background, were also observed in this campaign. In order to study the relative change in the brightness of these regions, a box average of 50 × 50 pixels was taken in the middle of these extended regions in each image. The locus of the box center pointed towards the approximate direction in which these bright patches were moving.
3 Observations
The all sky optical imaging system was operated from Kavalur (12.56◦N, 78.8◦E, Mag. Lat 4.6◦N) during March– April 1998. Figure 1 shows the viewing geometry at Kavalur for the 630 nm emission. Although a 180◦ field-of-view (FOV) system was employed, the actual usable FOV was only about ±75◦from the zenith.
As there was no ionosonde available at Kavalur, the move-ment of the F layer and the spread F were monitored by an ionosonde, which was operated every 15 min at SHAR (14◦N, 80◦E, 5.5◦N dip latitude). Out of a total of 14 nights of observations, plasma depletions were observed only on 9 nights. Very strong plasma depletions were observed on 20, 21, 23 and 29 March 1998. A brightness wave was also seen on many of these 9 nights.
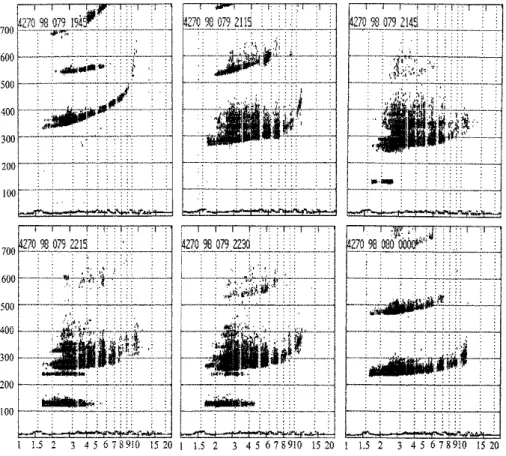
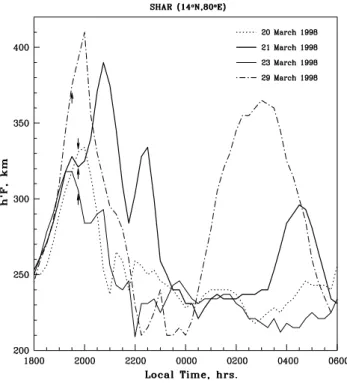
The onset time of spread F on all four nights when very strong plasma depletions were observed was between 19:30 and 19:45 local time (LT). Figure 2 shows ionograms taken at 19:45, 21:15, 21:45, 22:15, 22:30 and 00:00 LT on the night of 20/21 March 1998, when an intense spread F and well de-veloped plasma depletions were observed. On this night, the onset of spread F was at 19:45 LT and it continued through-out the night and could be clearly seen up to 06:00 LT. Spread F activity on the other three nights was also very intense. Fig-ure 3 shows the variation in the height of the base of the F2
-region (h’F) computed from ionograms taken on the nights of 20, 21, 23 and 29 March 1998. On two nights (21 and 29 March), the onset of spread F was at a time when the F layer was moving upwards; on one night (23 March), the onset occurred when the F layer was coming down and on another night (20 March), the onset started when the F layer was about to reach its peak.
Fig. 2. Ionograms taken at SHAR (14◦N, 80◦E, 5.5◦N dip latitude) at 19:45, 21:15, 21:45, 22:15, 22:30 and 00:00 LT on the night of 20/21 March 1998.
4 Results
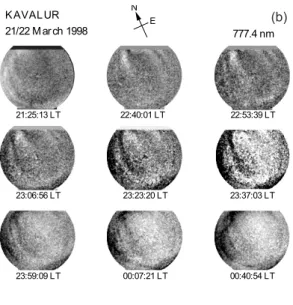
Figures 4a to c show a series of plasma depletions observed in 630 nm, 557.7 nm and 777.4 nm on the night of 21/22 March 1998. Out of the four nights when very strong plasma depletions were observed, it was only on this night (21/22 March 1998) that plasma depletions were observed in all three wavelengths simultaneously. Although the imaging ob-servations started at 19:59:10 LT on the night of 21/22 March 1998, fully developed plasma depletions could be seen only at 22:34:39 LT, 23:16:48 LT and 21:25:13 LT in 630 nm, 557.7 nm and 777.4 nm, respectively. Another interesting observation was that the nature of 630 nm and 557.7 nm images was quite different up to about midnight, beyond which, there was practically one-to-one correspondence in the 630 nm and 557.7 nm images. Absolutely no depletions were seen in 557.7 nm images before 23:16:48 LT. Develop-ment and moveDevelop-ment of two band-like structures can be very clearly seen in the 630 nm and 557.7 nm images. The inten-sity of the 777.4 nm images was relatively weaker. In addi-tion to the depleaddi-tions in the 630 nm intensity, Fig. 4 a also shows the appearance of a bright region in the northern part of the image (at 23:19:49 LT), with its sudden intensification (23:33:01 LT), its band-like appearance and ultimate spread in the entire field-of-view up to 01:09:54 LT. Subsequently, the plasma depletions became weak. The time interval be-tween the appearance of the brightness pattern and its growth to the peak intensity was about 93 min. Before attaining its
peak intensity, the brightness pattern contains a well marked plasma depletion within it. Similar brightness patterns, but with slightly reduced intensity, were observed in 557.7 nm as well. But no such brightness patterns were found in 777.4 nm images on the same night.
Figure 5 shows the 630 nm images taken during the night of 20/21 March 1998. On this night, observations started at 21:06:12 LT. Signatures of the onset of spread F could be seen even in the very first image, when very weak depletions were observed. Plasma depletions appear to be fully devel-oped at 22:20:17 LT when these could be seen most promi-nently. Enhancement of the 630 nm intensity is also seen in these images. At 21:48:29 LT, the brightness pattern appears as a very small region in the northern part of the image. This region subsequently grows in intensity as well as size and beyond 23:19:32 LT, it engulfs the entire field-of-view. This brightness pattern also contains a well marked plasma deple-tion within it, and takes about 91 min to grow to its peak value.
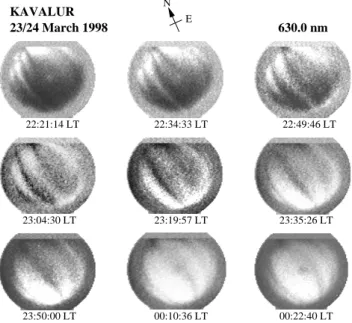
Figure 6 shows the 630 nm images taken during the night of 23/24 March 1998. Appearance of plasma depletions in these images is slightly different. Here, three weak plasma depletions were observed at 22:04:27 LT (not shown in Fig. 6). Initially these depletions were seen in the north-ern part of the image (at 22:21:14 LT) and they were very close to each other. The separation between these deple-tions gradually increased. By 00:22:40 LT, the depledeple-tions became quite weak and were subsequently not observed.
Fig. 3. Variation of h’F over SHAR during the nights of 20, 21, 23
and 29 March 1998. Arrows show the time of onset of spread F.
These images also show the existence of brightness pat-terns. A small brightness pattern appeared in the northern side at 21:43:09 LT (not shown in Fig. 6), intensified and moved in a southern direction and attained its peak intensity at 23:19:57 LT in about 96 min. This brightness pattern is able to cover the entire field-of-view only at 00:10:36 LT, i.e. it takes 2 hrs 27 min to encompass the entire FOV.
Figure 7 shows the 630 nm images taken during the night of 29/30 March 1998. The first signatures of plasma deple-tions were seen in the image taken at 20:04:56 LT (not shown in Fig. 7). In the initial part of the night (up to 22:49:05 LT), three, well separated and very strong plasma depletions could be seen. From 23:04:14 LT onwards, the depletion on the s-w sector had s-weakened, but had taken the form of three very closely spaced bands, which can be seen up to 23:35:13 LT. Afterwards the depletions became too weak. The brightness patterns were seen on this night as well. The brightness was not seen in the image taken at 20:20:11 LT after which there was gap in the data up to 21:17:59 LT. At 21:17:59 LT, the brightness pattern was seen as a small, bright region in the northern part of the image. This brightness pattern attained its peak value at 22:35:03 LT in about 78 min after its first detection. In absence of an image when this brightness pat-tern was first observed, one can say that it must have taken more than 78 min to come to its peak brightness.
In order to determine the east–west movement of plasma depletions passing over Kavalur, east–west line scans of each image were taken. An average of 17 such line scans around an east–west line passing through the zenith ware taken. Such an average line scan represents the intensity of an east–
west band (±8 pixels) in the center of the image. Figure 8 shows such an average line scan taken for four 630 nm im-ages, at approximately 15 min intervals, on the night of 20 March 1998. One can clearly see the development and east-ward movement of one such plasma depletion (shown by an upward arrow) at 22:05:17 LT. A second depletion (shown by downward arrows) also moves eastwards and decays. The eastward velocity of plasma depletions was determined from such line scans.
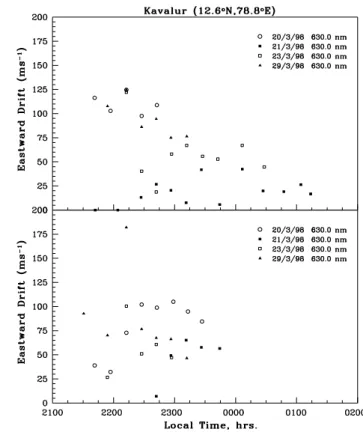
The top and bottom panels of Fig. 9 show the eastward ve-locity of two of the most prominent plasma depletions which could be observed for an extended period, calculated from the 630 nm images on four nights. The direction of move-ment of plasma depletions was eastwards on all four nights. In general, the eastward drift velocity was maximum dur-ing 21:30–22:30 LT and then it decreased to very low val-ues around 01:00 LT, sometimes exhibiting a secondary peak around 00:30 LT. The fastest moving plasma depletions were observed on the night of 29/30 March 1998, when eastward velocities as high as 182 ms−1 were observed. Contrary to this, very slow moving plasma depletions were observed on the night of 21/22 March 1998, when eastward velocities ranged between 0–25 ms−1. It is interesting to note that the night of 21/22 March 1998 was a disturbed night. On the other two nights (20 and 23 March 1998), eastward veloci-ties had intermediate values.
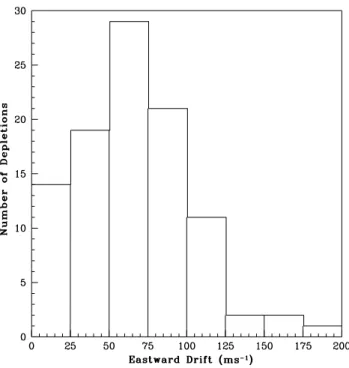
On the night of 28 March 1998, plasma depletions could not be seen continuously due to intermittent cloudiness and hence, no velocity estimates were made for that night. Figure 10 shows the histogram of the different velocities acquired at different times by all 22 depletions seen during an eight night observation period. This shows that there is a lot of variability in the velocity of plasma depletions. At the lower end of velocity (0–25 ms−1), the contribution is primarily from the depletions on the magnetically disturbed night and from a few depletions in the later part of the night. Most of the depletions (82.5%) have velocities in the range of 25– 125 ms−1. There were only five occasions when eastward velocities in excess of 125 ms−1were observed.
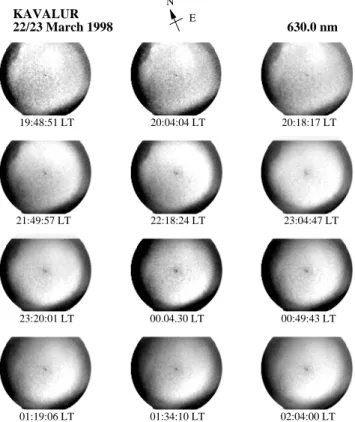
In addition to plasma depletions which were observed on four nights, very strong plasma enhancements or bright-ness patterns were also observed at all three wavelengths on many nights. Figure 11 shows a series of images in 630 nm recorded on the night of 22/23 March 1998, where a small, bright region was first observed at 19:35:12 LT (not shown in Fig. 11) in the northeast direction, which grew in intensity but did not change much in its size, up to about 21:49:57 LT, after which, the size of the brightness pattern started increas-ing and it started movincreas-ing southwards. Beyond 23:04:07 LT, the size of the brightness pattern did not change significantly, but its intensity showed a wavy pattern. Similar brightness patterns were also observed in the 557.7 nm images on the same night.
We have observed for the first time the presence of bright-ness patterns in the 777.4 nm images also. Appearance of brightness patterns in the 777.4 nm images has not been re-ported previously. Figure 12 shows the brightness patterns
N E 630.0 nm KAVALUR 23:03:13 LT 23:19:49 LT 23:33:01 LT 23:55:26 LT 00:17:23 LT 00:36:14 LT 00:59:02 LT 01:17:48 LT 21/22 March 1998 01.09.54 LT (a) 777.4 nm KAVALUR N E 23:23:20 LT 00:07:21 LT 22:40:01 LT 22:53:39 LT 23:37:03 LT 00:40:54 LT 23:59:09 LT 21/22 March 1998 23:06:56 LT 21:25:13 LT (b) KAVALUR 557.7 nm 00:33:11 LT N E 23:16:48 LT 23:30:31 LT 00:01:32 LT 00:15:12 LT 00:47:01 LT 01:15:33 LT 01:25:02 LT 01:07:50 LT 21/22 March 1998 (c)
Fig. 4. Plasma depletions as seen in
im-ages taken over Kavalur on the night of 21/22 March 1998 (a) at 630 nm, (b) at 557.7 nm and (c) at 777.4 nm. Times written below images represent local time in hrs, min and s. The arrow points towards the geomagnetic north.
observed in the 777.4 nm images on the night of 22/23 March 1998. The brightness pattern appears in the FOV in the north-ern part of the image, as early as 19:53:10 LT, moves to-wards the equator along the western part of the image and by 23:25:51 LT, it spreads over the entire FOV. Afterwards, it does not show much movement, but by 00:53:52 LT, it is pri-marily seen only in the eastern half of the image. It is present up to 02:07:28 LT, when observations were stopped.
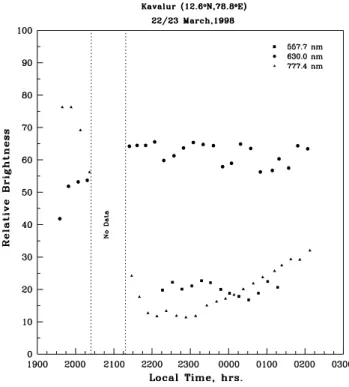
In order to have an idea of the relative change in the in-tensities of these brightness patterns, intensity values at all three wavelengths were normalized to 100 arbitrary units. Figure 13 shows relative brightness variations observed in the 557.7 nm, 630 nm and 777.4 nm images during the night of 22/23 March 1998. The relative brightness of the 630 nm images is about three times more compared to those in the 557.7 nm and 777.4 nm images. The relative brightness in the 630 nm and 557.7 nm images show a periodicity which varies between 80 and 90 min. The relative brightness of the 777.4 nm images, however, do not show any such wavy structures. The brightness in the 630 nm images shows an increase in intensity by a factor of about 1.5 from 19:30 to
21:30 and beyond 21:30 these patterns show a periodicity ranging between 80 and 90 min. The 777.4 nm images, how-ever, show an entirely opposite trend. The relative brightness of the 777.4 nm images is very high at 19:30 and it drops by a factor of 4 by 21:30 and becomes minimum at 23:00, beyond which, it starts increasing.
5 Discussion
5.1 Growth time of plasma depletions
One of the important features of plasma depletions that is still not clearly understood is the fact that they are observed only on some of the spread F nights (Fagundes et al., 1999; Sahai et al., 2000). In order to understand this aspect, an attempt was made to estimate the typical time for the development of plasma depletions once the ESF has set in. Ionosonde obser-vations from SHAR and imaging obserobser-vations from Kavalur taken during the present campaign (Fig. 4 to Fig. 7) show that after the onset of ESF, plasma depletions take 2 hrs 35 min, 2 hrs 49 min, 2 hrs 49 min and 2 hrs 34 min to come to
630.0 nm N E KAVALUR 21:48:29 LT 22:05:22 LT 22:20:17 LT 22:34:20 LT 22:50:52 LT 23:06:41 LT 23:19:32 LT 23:34:34 LT 23:49:15 LT 20/21 March 1998
Fig. 5. Plasma depletions in the 630 nm images taken over Kavalur
on the night of 20/21 March 1998. The arrow points towards the geomagnetic north. E 630.0 nm 23/24 March 1998 KAVALUR N 22:21:14 LT 22:34:33 LT 22:49:46 LT 23:04:30 LT 23:19:57 LT 23:35:26 LT 23:50:00 LT 00:10:36 LT 00:22:40 LT
Fig. 6. Plasma depletions in the 630 nm images taken over Kavalur
on the night of 23/24 March 1998. The arrow points towards the geomagnetic north.
the fully developed stage on the nights of 20/21, 21/22, 23/24 and 29/30 March 1998, respectively.
The main mechanism for the generation of largescale structures associated with the spread F is the Generalised Rayleigh-Taylor Instability (GRTI) mechanism. The growth rate of GRTI depends on many parameters, such as electron density gradient, ion-neutral collision frequency, vertical and zonal winds, electric fields, tilt of ionosphere, etc. It is
well-N KAVALUR 630.0 nm E 21:17:59 LT 21:42:48 LT 22:04:46 LT 22:20:11 LT 22:35:03 LT 22:49:05 LT 23:04:14 LT 23:19:58 LT 23:35:13 LT 29/30 March 1998
Fig. 7. Plasma depletions in the 630 nm images taken over Kavalur
on the night of 29/30 March 1998. The arrow points towards the geomagnetic north.
Table 1. East–west scale (λE−W), inter-depletion distance (IDD)
and the total number of plasma depletions observed (N) in each category during eight nights of observation.
Type of λE−W (IDD) N
Depletion km km
Type 1 250–350 125–300 10 Type 2 100–150 50–150 16 Type 3 250–350 to 40–100 20–60 2
known that the growth rate of GRTI is not sufficient to pro-duce the observed amplitudes starting from thermal fluctu-ations and it is necessary to have some other mechanism to produce a seed perturbation. Gravity waves are considered to be the main source that produce the necessary initial density perturbation needed for the generation of these irregularities (Kelley et al., 1981). As the growth rate of GRTI depends on a number of parameters, one expects to observe irregularities in different stages of development when these parameters as-sume different values. The contribution to the growth rate of GRTI instability by the gravitational term is more when the F layer is at higher altitudes, while zonal winds and electric fields are effective at lower altitudes (Tsunoda 1981, Kelley et al., 1981). In addition, during the descending phase of the F layer, the tilt of the ionosphere is such that zonal winds have a stabilising effect.
As shown in Fig. 3, the location of h’F was at different altitudes and the layer was moving either upwards or down-wards. Thus, the background ionospheric conditions on all four nights, which we have reported here show a signifi-cant variation. But the interesting result is that on all four
Fig. 8. Variation in the relative intensity of 630 nm along an east–
west band (±8 pixels) passing through the center of the image (i.e. the local zenith) in four images taken over Kavalur at approximately 15 min intervals on the night of 20/21 March 1998. Upward and downward arrows show eastward movement of two plasma deple-tions.
nights, the irregularities take nearly same time (2 hrs 40 min) to come to a fully developed stage from the time that the first signatures of ESF were seen on the ionograms. Thus, our results indicate that even though there are differences in the background ionospheric conditions at the onset time, the average growth time required for the appearance of fully de-veloped depletions is nearly the same in all cases. This also tells us that plasma depletions will be produced if the back-ground conditions are conducive and can provide some min-imum growth rate. These background conditions need not be the same on all nights. But if these minimum conditions are not satisfied, depletions in large-scale structures may not develop to the extent wherein they are defined as plasma de-pletions.
Thus, present observations show that, on an average, plasma depletions take about 2 hrs 40 min to come to a fully developed stage after the onset of ESF. Singh et. al. (1997b) found from their satellite-borne ion probe that the small ion perturbations took nearly 3 hrs to develop into a wave struc-ture. Our observations show an excellent agreement with the satellite-borne in situ measurement. Thus, the time required for the growth of fully developed plasma depletions can be taken to be in the range of 160–180 min.
Fig. 9. Eastward drift velocity of plasma depletions over Kavalur
during nights of 20/21, 21/22, 23/24 and 29/30 March 1998. Top and bottom panels show velocities of two different depletions ob-served on the same night.
5.2 East–west extent and inter-depletion distance
Our observations of plasma depletions, as shown in Fig. 4 to Fig. 7, show basically three types of plasma depletions. Ta-ble 1 shows the number of depletions observed in each class during the present campaign. The first type of depletion has a fairly large east-west extent (250 km to 350 km) and nor-mally, one sees two such depletions (Fig. 4 a, b and Fig. 5) most of the time. The eastward velocities of these deple-tions were such that when one depletion moved out of the eastern horizon, another one started appearing in the west. The typical inter-depletion distance (IDD) for such deple-tions was in the range of 125–300 km. The second category of plasma depletion is the one wherein about three plasma depletions, each having a relatively small east-west extent (100–150 km) were observed initially and all of these moved nearly with the same velocity, at least up to 00:00 LT, beyond which, their velocities showed differential behaviour. The range of IDD for such depletions was 50–150 km. The third type of plasma depletion initially had a large east-west extent (250 km to 350 km), but after about 23:00 LT, three to four depletions, each having very a small east-west extent (40– 100 km), bunched together and moved very slowly (Fig. 7). The range of IDD for such depletions was 20–60 km.
Inter-depletion distances give information about the wave-length of the initial seed perturbation, which grows and
ulti-Fig. 10. Histogram of the number of depletions observed in
differ-ent velocity ranges during all eight nights of observation.
mately results in the generation of electron density irregulari-ties. So the observed inter-depletion distances should be rep-resentative of the scale sizes of the gravity waves responsible for the initial perturbation. There are basically three types of gravity waves, which can produce large-scale plasma ir-regularities in the F-region. The first ones, which are the most well-known type, are the gravity waves present in the F-region. It was shown by Hines (1974) that at 225 km altitude, gravity waves have a lower wavelength cutoff of 100 km. Thus, F-region gravity waves are basically large-scale grav-ity waves. The second type of gravgrav-ity waves is present in the E-region and they produce the electric field perturbations, which can be transported along the geomagnetic field lines to the F-region (Prakash, 1999). These gravity waves from the E-region could have scale sizes down to about 15–20 km (Prakash, 1999). The third type of gravity waves comes from the auroral regions during a magnetic disturbance (Kelley et al. 1981); such gravity waves have scale sizes in excess of 1000 km.
In view of the above, we feel that the Type 1 depletions, which have wavelengths in the range of 250–350 km, are pro-duced by the gravity waves in the F-region. The depletions that we classified as Type 2 and Type 3 have very small val-ues of inter-depletion distance (< 150 km). We believe that these depletions are produced due to the E-region gravity waves through the mechanism suggested by Prakash (1999). As we have observed the simultaneous existence of all three type of depletion, our results point to the simultaneous in-volvement of many types of gravity waves, in addition to the GRTI, in the production of the observed plasma depletions. The east–west extent and the inter-depletion distances
ob-served by us are in agreement with those obob-served by Singh et al. (1997b).
5.3 Simultaneous occurrence in the 630, 777.4 and 557.7 nm images
An interesting observation is that only on the night of 21/22 March 1998, were plasma depletions present simultaneously in all three wavelengths. On this particular night, the first signatures of plasma depletions were seen at 21:25:13 LT in the 777.4 nm images; the depletions were next seen in the 630 nm images at 22:34:39 LT and finally in the 557.7 nm at 23:16:38 LT. An attempt was made to find out what special features were associated with this night, which gave rise to simultaneous observations of plasma depletions in 630 nm, 777.4 nm and 557.7 nm. The onset of spread F on this night was at 19:45 LT, when the base of the F layer was located around 320 km.
The 557.7 nm signal is made up of two parts, one coming from the F-region and the other coming from the mesosphere. The F-region OI 557.7 nm emission is through the dissocia-tive recombination of O+2 or NO+molecules, which are pro-duced through charge exchange or ion atom exchange reac-tions between O+and neutrals. The mesospheric emission of OI 557.7 nm is given by the Barth mechanism. Normally, the contribution of mesospheric component is dominant as com-pared to that of the F-region. A modification of the neutral and plasma density distribution, which follows a magnetic disturbances event, can thus result in a significant increase in the F-region’s contribution to the 557.7 nm signal.
Simultaneous observations of plasma depletions in 630 nm and 557.7 nm were conducted earlier by Mendillo et al. (1997a), who found that very similar structures were present in both the 630 and 557.7 nm images. The present ob-servations, on the other hand, show that up to about midnight, although the 630 nm images show the presence of plasma de-pletions, no such structures are seen in the 557.7 nm images. Beyond midnight, both images show more or less similar structures. We feel this was the case because on this par-ticular night, there was a strong magnetic disturbance dur-ing which heatdur-ing of low-latitudes and the subsequent mod-ification of the neutral density took place through a large-scale circulation. In the presence of such density changes, an enhanced contribution of a 557.7 nm emission from the F-region is possible.
Although very weak signatures of depletion in 777.4 nm were present as early as 21:25:13 LT, the depletions became very prominent after 23:23:20 LT. As the time interval be-tween the onset of the magnetic disturbance and the obser-vation of prominent depletions was around 6 hrs, the occur-rence of prominent depletions in the 777.4 nm images could be due to the enhancement of atomic oxygen subsequent to the magnetic disturbance, as suggested by Prolss (1982, 1995).
N E 19:48:51 LT 20:04:04 LT 20:18:17 LT 21:49:57 LT 22:18:24 LT 23:20:01 LT 00:49:43 LT 01:34:10 LT 630.0 nm KAVALUR 22/23 March 1998 00.04.30 LT 02:04:00 LT 23:04:47 LT 01:19:06 LT
Fig. 11. Plasma enhancements or brightness patterns in the 630 nm
images taken over Kavalur on the night of 22/23 March 1998. The arrow points towards the geomagnetic north.
5.4 Eastward velocity
Except for a single plasma depletion which had an eastward velocity of 182 ms−1, most of the plasma depletions ob-served in the present campaign had their eastward velocities in the range of 25–125 ms−1. These observations are com-mensurate with the normal behaviour of the F-region dynamo and are in agreement with values reported earlier (Mendillo et al., 1997a; Fejer, 1991; Sinha and Raizada, 2000). Some of the plasma depletions had very small to practically zero east-ward drift velocity. Plasma depletions observed on the night of 21/22 March 1998 belong to this class. These plasma de-pletions had their eastward drift velocities in the range of 0– 25 ms−1. Very slowly moving depletions, as observed by us during a magnetically disturbed period, have been observed earlier only once by Fagundes et al. (1999) during a magneti-cally quiet and weak spread F period. Fagundes et al. (1999) observed north–south aligned bands, which practically did not move for about an hour.
Our observations of very slow depletions were made on a magnetically disturbed night. On this night, these depletions started appearing around 21:34:29 LT. We feel that these sluggish depletions could be due to a severe modification of the F-region dynamo electric fields. The modification of the region dynamo can be due to the modification of the F-region neutral winds or due to the direct penetration of mag-netospheric electric fields to the equatorial ionosphere
(Gon-N E 777.4 nm KAVALUR 22/23 March 1998 19:53:10 LT 20:07:41 LT 20:21:42 LT 21:53:33 LT 22:22:07 LT 23:08:15 LT 23:25:51 LT 00:08:24 LT 00:53:32 LT 01:23:17 LT 01:37:31 LT 02:07:28 LT
Fig. 12. Plasma enhancements or brightness patterns in the 777.4 nm images taken over Kavalur on the night of 22/23 March 1998. The arrow points towards the geomagnetic north.
zales et al., 1979). The time of the first appearance of these sluggish depletions (21:34:29 LT) is commensurate with time scales of the direct electric field penetration mechanism. The appearance of depletions in the later part of the night can be explained in terms of a dynamo field modification due to the direct penetration of electric fields and/or planetary wave circulation. Details of these effects during a magnetic distur-bance are discussed in the next section.
5.5 Effect of magnetic disturbance
Out of the four nights of observations which we have de-scribed here, 21 March 1998 was a magnetically disturbed night, with Kp values reaching as high as 6− and 6+
dur-ing the periods 12:00–15:00 UT and 15:00–18:00 UT, re-spectively. Interestingly, it was only on this night that we observed plasma depletions which showed very small (0– 25 ms−1) eastward drift. In addition, on this night, we could observe plasma depletion structures in all three wavelengths (630 nm, 557.7 nm and 777.4 nm). In the following para-graphs, an attempt is made to examine the possible influence of this high-latitude disturbance on the features observed at a low altitude station.
The coupling of high-latitude and low-latitude spheres can be either through the changes in the neutral atmo-sphere caused by the heating and subsequent changes in the neutral wind pattern or through electrical field penetrations
Fig. 13. Variation in the relative brightness of the airglow
enhance-ments in an area of 50 × 50 pixels approximately located at the center of the brightness pattern on the night of 22/23 March 1998.
which can change the plasma dynamics at low-latitudes and affect neutral winds through momentum transfer (ion drag). Sahai et al. (1998) have shown that whenever Kp index
as-sumes a value greater than 5, the drift of magnetic distur-bance to equatorial latitudes can result due to prompt pene-tration of high-latitude electric fields to lower latitudes. If the changes are due to electrical coupling, low-latitudes follow the high-latitude disturbances almost instantaneously (Gon-zales et al., 1979). If the observed effects of high-latitude magnetic disturbances appear at low latitudes after a time period of 4–6 hrs, it can be thought of as a result of the in-duced effect of the high-latitude activity on equatorial neutral atmosphere either through large-scale circulation or through travelling atmospheric disturbances.
Plasma depletions, once generated, usually drift eastwards with ambient plasma. The eastward velocity depends on the F-region dynamo, which is controlled essentially by neutral zonal winds and electric fields. Therefore, any change in the drift velocity of plasma depletions can be thought of as a re-sult of the corresponding change in the neutral wind velocity or ionospheric electric fields, thereby affecting the F-region dynamo. Since 21 March 1998 was the only disturbed night during the present observation period, it can be concluded that the sluggish plasma depletions observed on that night could be due to the effect of the enhanced geomagnetic ac-tivity.
The time of occurrence of high Kp values shows that
the change in the F-region dynamo could be either due to a change in the neutral wind pattern or due to the
penetra-tion of disturbance electric fields to low-latitudes. There are primarily three mechanisms which can cause heating in the low-latitudes and a change in the wind pattern and hence, a change in the F-region dynamo electric fields (Prolss, 1982). They are (1) ring current neutral particle injection, (2) large-scale circulation and (3) travelling atmospheric disturbances. The F-region dynamo can also be altered almost instanta-neously by direct penetration of magnetospheric and plasma-spheric electric fields. The time scales involved in the ring current neutral particle injection and large-scale circulation does not match with the first appearance of (∼21:34:29 LT) slow drifting bubbles reported here. If the travelling atmo-spheric disturbances would have been responsible, then we expect to observe signatures of large-scale gravity waves in our all sky images, as seen by Sinha and Raizada (2000). But such signatures were absent in the images of 21 March 1998. Therefore, one can conclude that the observed changes in plasma depletion drifts at the time of first appearance (21:34:29 LT) on 21 March 1998 might be due to the direct penetration of the disturbance electric fields from the high-latitudes to low-high-latitudes, affecting the F-region dynamo. Based on the time scales involved, plasma depletions ob-served in the later part of this night (after 23:00 LT) can be due to dynamo field modifications either through the direct electric field penetration and/or the planetary wave circula-tion.
The fact that plasma depletions were seen in the 557.7 nm and 777.4 nm images taken on the night of 21 March 1998 points to the fact that there had been a modification of neutral densities also on this night. The appearance of plasma depletion structures in the 557.7 nm images starts only around 23:10:48 LT, but the 630 nm emissions show clear plasma depletions beforehand. The otherwise faint 777.4 nm emission showed very clear plasma depletions from about 23:23:20 LT. This corresponds to a time gap of nearly 6 hrs after the commencement of high-latitude distur-bances (assuming 12:00 UT to be the starting time).
Prolss (1982, 1995) has shown that the geomagnetic dis-turbances can cause density enhancements of all types of neutral particles at low-latitudes, while at higher latitudes, heavier elements (Ar, N2 etc.) show enhancement, and
lighter elements (O, He etc.) show a depletion in density at F layer altitudes. This can result in a reduction of electron den-sity in the F layer at mid- and high-latitudes (negative iono-spheric storm). The enhancement of the atomic oxygen den-sity at F layer heights in the equatorial and low-latitudes can affect the F-region airglow chemistry and result in enhanced emission at 777.4 nm and 557.7 nm. Therefore, it can be con-cluded that the observed enhancements in the 557.7 nm and 777.4 nm emissions were due to the increase in low-latitude neutral densities as a result of the magnetic disturbance. 5.6 Plasma enhancement / brightness patterns
The brightness patterns reported here include some new re-sults. We have observed for the first time the presence of brightness patterns in the 777.4 nm images. Our observations
indicate that these brightness patterns start with a very small spatial extent in the northern part of the image and typically take about 90 min to grow to their peak amplitudes. Dur-ing their intensification, these bright regions grow in size and most of the time cover the entire field-of-view. Sometimes, these brightness patterns contain one or more well developed plasma depletions within them. The general trend observed in our images is that these brightness patterns start appear-ing in the northern part of the FOV and slowly move towards the southern part of the image, i.e. towards the equator. In most cases they reach the southern part by local midnight. After midnight, the brightness patterns grow in size, at times covering the entire field-of-view (Fig. 11), and hence, show practically no movement.
Colerico et al. (1996) has reported the appearance and dy-namics of brightness waves (BW) in the all sky images dur-ing MISETA campaign and concluded that they are the op-tical signatures of midnight temperature maximum (MTM). Mendillo et al. (1997a) have also reported the appearance of BWs in their all sky images and attributed this phe-nomenon to MTM. It is interesting to note that BWs re-ported by Mendillo et al. (1997a) were very short-lived and were termed as transients. Sinha and Raizada (2000) re-ported the existence of brightness by a factor as high as 3.8, which existed for a much longer time (∼ few tens of min). The present understanding of this phenomenon is that the observed brightness in the 630 nm and 557.7 nm images is due to the enhancement in the airglow emission caused by the downward movement (midnight collapse) of the F layer, which is due to the reversal of meridional neutral winds from equatorwards to polewards as a result of the pressure bulge, which accompanies the MTM (Colerico et. al, 1996). There are pre-midnight as well as midnight BW events. The equa-torward or poleward movement of the BWs depends on the (eastward or westward) tilt of the MTM and the movement of the instrument location through the MTM at the corotation speed of the Earth. The absence of BWs are not expected in the 777.4 nm images due to the fact that the 777.4 nm emis-sion does not depend on h’F variations.
There are two main differences in brightness patterns seen in our images. Colerico et al. (1996) have classified the BW events as pre-midnight brightness waves (PMBWs) and mid-night brightness waves (MBWs), depending on their time of occurrence. The PMBWs occur during 20:00–22:00 LT, while MBWs are observed during 00:00–02:00 LT. In some cases, both PMBWs and MBWs are observed on the same night. The direction of movement of PMBWs is equator-ward, whereas the MBWs move poleward. The brightness patterns observed by us do not show any such difference in their direction of motion during different parts of the night. As shown in Fig. 11, brightness patterns observed by us are continuously present from 19:48:51 LT to 02:04:00 LT. The second difference is the appearance of brightness patterns in the 777.4 nm images (Fig. 12). This is a new observation and prompts us to investigate more the origin of these bright-ness patterns, as their appearance in about 777.4 nm in not expected if the generation of BWs is due to the phenomenon
of the MTM.
Figure 13 shows the variation in the relative brightness of these brightness patterns with time for all three wavelengths obtained on 22/23 March 1998. In the initial part of the night, i.e. up to 21:30 hrs, 630 nm images showed a brightness en-hancement by a factor of 1.5 with time and in the same dura-tion the 777.4 nm images showed a decrease in brightness by a factor of 4. Beyond 21:30 hrs, the 630 nm and 557.7 nm im-ages show a wave-like behaviour with a periodicity of 80–90 min, whereas the 777.4 nm images do not show any wave-like pattern. These features appear to be a new type and need to be explained.
6 Summary
This paper reports some new observations of ionospheric plasma depletions taken using an all sky optical imaging sys-tem developed at PRL. It is found that plasma depletions take 2 hrs 40 min to 3 hrs to come to a fully developed state. There were three distinct classes of plasma depletions with east-west extents of 250–350 km, 100–150 km and 40–100 km and corresponding inter-depletion distances of 125–300 km, 50–150 km and 20–60 km, respectively.
Out of the 14 nights of observation, the simultaneous oc-currence of plasma depletions in the images of 557.7 nm, 630 nm and 777.4 nm was observed only on 21/22 March 1998. This particular night was characterized by a mag-netically disturbed period and the onset of equatorial spread F occurring at a time when the base of the F layer was at 320 km; the h’F on this night showed two well marked peaks in a time interval of about 90 min. It appears that the plasma depletions observed on this night were initiated by magnetic storm induced neutral density perturbations, which penetrated down to equatorial latitudes by large-scale plane-tary wave circulation.
Plasma depletions, as seen in 630 nm, were found moving eastwards on all eight nights. Most of the plasma depletions had eastward velocities in the range of 25–125 ms−1. On one occasion (night of 29/30 March 1998), an eastward ve-locity as high as 182 ms−1 was also observed. On the night of 21/22 March 1998, which was a magnetically disturbed night, plasma depletions were found to be very sluggish with eastward velocities in the range of 0–25 ms−1. We feel that in the initial part of this night, the slow eastward movement of plasma depletions was due to the modification of the F-region dynamo electric fields by direct penetration of distur-bance electric fields from high-latitudes. Plasma depletions observed in the later part of the night (after 23:00 LT) could be due to dynamo field modifications either through direct electric field penetration and/or planetary wave circulation. Similar slowly moving depletions have been observed earlier by Fagundes et al. (1999).
In addition to plasma depletions, plasma enhancements or brightness patterns were also observed on many nights. The present work reports for the first time the presence of bright-ness patterns in the 777.4 nm images. It was hitherto believed
that the brightness waves in 630 nm and 557.7 nm are a result of the MTM, which is not expected to affect the 777.4 nm emission. Thus, the mechanism of brightness patterns ob-served by us has yet to be fully understood. The brightness patterns initially appear in the northern part of the image, they grow in size and attain their peak intensity in typically about 90 min and in 1.5 to 2.5 hrs, these patterns encom-pass the entire field-of-view. These brightness patterns show slightly different behaviour in the 630 nm and 777.4 nm im-ages. In the 630 nm images, the intensity of these bright-ness patterns shows an increase by a factor of about 1.5 from 19:30 to 21:30, whereas the 777.4 nm images show a decrease by a factor of 4 during the same period. Beyond 21:30, the 630 nm and 557.7 nm images show a wave type perturbation with a period of 80–90 min. These brightness patterns are different from those reported earlier by Mendillo et al. (1997a) and Sinha and Raizada (2000), and appear to be of a new type.
Acknowledgements. The authors are thankful to the director and the
staff of ISRO Telemetry Tracking & Command Network (ISTRAC), Bangalore and Dr. G. S. D. Babu of V. B. Observatory, Kavalur for providing all necessary facilities for conducting this experi-ment at Kavalur. Authors are grateful to the director of the Space Physics Laboratory (SPL), Trivandrum for providing the ionograms of SHAR. This work was supported by the Physical Research Lab-oratory, Ahmedabad.
Topical Editor M. Lester thanks P. Fagundes and another Referee for their help in evaluating this paper.
References
Benson, R. F. and Brinton, H. C., Ionospheric plasma bubble en-counters or F-region bottomside traversals, J. Geophys. Res., 88, 6243–6252, 1983.
Bittencourt, J. A., Sahai, Y., Fagundes, P. R., and Takahashi, H., Simultaneous observations of equatorial F-region plasma deple-tions and thermospheric winds, J. Atmos. Terr. Phys, 59 (9), 1049–1059, 1997.
Colerico, M., Mendillo, M., Nottingham, D., Baumgardner, J., Meriwether, J., Mirick, J., Reinisch, B. W., Scali, J. L., Fe-sen, C. G., and Biondi, M. A., Coordinated measurements of F-region dynamics related to the thermospheric midnight tem-perature maximum, J. Geophys. Res., 101, 26, 783–793, 1996. Fagundes, P. R., Sahai, Y., Batista, I. S., Abdu, M. A., Bittencourt,
J. A., and Takahashi, H., Vertical and zonal equatorial F-region plasma bubble velocities determined from OI 630 nm nightglow imaging, Adv. Space Res., 20 (6), 1297–1300, 1997.
Fagundes, P. R., Sahai, Y., Batista, I. S., Abdu, M. A., Bittencourt, J. A., and Takahashi, H., Observations of day-to-day variability in precursor signatures to equatorial F-region plasma depletions, Ann. Geophysicae, 17, 1053–1063, 1999.
Fejer B. G., Low latitude electrodynamic plasma drifts, J. Atmos. Terr. Phys, 53, 677–693, 1991.
Gonzales C. A, Kelly, M. C., Fejer, B. G., Vickrey, J. F., and Wood-man, R. F., Equatorial electric fields during magnetically dis-turbed conditions 2. Implications of simultaneous auroral and equatorial measurements, J. Geophys. Res., 84, 5803–5812, 1979.
Hanson, W. B. and Sanatani, S., Large Ni gradients below the equa-torial F peak, J. Geophys. Res., 78, 1167–1173, 1973.
Hines, C. O., The upper atmosphere in motion, Geophys. Monogr. Ser. Vol. 18 (American Geophysical Union, Washington DC, USA), 1974.
Huang, C. S. and Kelley, M. C., Nonlinear evolution of equatorial spread-F 2. Gravity wave seeding of Rayleigh Taylor instability, J. Geophys. Res., 101, 293–302, 1996.
Jahn, J.-M., LaBelle, J., Sobral, J. H. A., Aggson, T. L., and Han-son, W. B., Detection of an equatorial spread-F bubble by ground based photometers and the San Marco 5 satellite, J. Atmos. Sol. Terr. Phys., 59, 1601–1609, 1997.
Kelley, M. C., Haerendal, G., Kappler, H., Valenzuela, A., Balsley, B. B., Carter, D. A., Ecklund, W. L., Carlson, C. W., Hausler, B., and Torbert, R., Evidence for a Rayleigh-Taylor type instabil-ity and upwelling of depleted densinstabil-ity regions during equatorial spread-F, Geophys. Res. Lett., 3, 448–450, 1976.
Kelley, M. C., Larson, M. F., LaHoz, C., and McClure, J. P., Gravity wave initiation of equatorial spread F: A case study, J. Geophys. Res., 86, 9087–9100, 1981.
Kelley, M. C., LaBelle, J., Kudeki, E., Fejer, B. G., Basu, S., Basu, Su., Baker, K. D., Hanuise, C., Argo, P., Woodman, R. F., Swartz, W. E., Farley, D. T., and Meriwether, J., The Condor equatorial spread F-campaign: Overview and results of the large scale mea-surements, J. Geophys. Res., 91, 5487–5503, 1986.
McClure, J. P., Hanson, W. B., and Hoffman, J. F. , Plasma deple-tions and irregularities in the equatorial ionosphere, J. Geophys. Res., 82, 2650–2656, 1977.
Mendillo, M. and Baumgardner, J., Airglow characteristics of equa-torial plasma depletions, J. Geophys. Res., 87, 7641–7652, 1982. Mendillo, M., Baumgardner, J., Colerico, M., and Nottingham, D., Imaging science contributions to equatorial aeronomy: initial re-sults from the MISETA program, J. Atmos. and Solar-Terr. Phys., 59, 1587–1599, 1997a.
Mendillo, M., Baumgardner, J., Nottingham, D., Aarons, J., Renisch, B., Scali, J., and Kelley, M. C., Investigations of thermospheric-ionospheric dynamics with 6300 ˚Aimages from the Arecibo observatory, J. Geophys. Res., 102 (A4), 7331–7343, 1997b.
Mukherjee, G. K., Carlo, L., and Patil, P. T., First all sky imaging observations from India, South Pacific STEP Workshop, Univer-sity of Newcastle, Newcastle, Australia, 5–9 July 1993. Prakash, S., Production of electric field perturbations by gravity
wave winds in the E-region suitable for initiating equatorial spread F, J. Geophys. Res., 104 (A5), 10, 051–069, 1999. Prolss, G. W., Perturbation of the low latitude upper atmosphere
during magnetic substrom activity, J. Geophys. Res., 87, 5260– 5266, 1982.
Prolss, G. W., Ionospheric F-region storms, Volland, H. (Ed.), Handbook of Atmospheric Electrodynamics, Vol. 2, CRC Press, Boca Raton, 195–248, 1995.
Rohrbaugh, R. P., Hanson, W. B., Tinsley, B. A., Cragin, B. L., and McClure, J. P., Images of transequatorial depletions based on field-aligned airglow observations from Haleakala in 1984– 1986, J. Geophys. Res., 94, 6763–6770, 1989.
Sahai, Y., Aarons, J., Mendillo, M., Baumgardner, J., Bittencourt, J. A., and Takahashi, H., OI 630 nm imaging observations of equa-torial plasma depletions at 16◦dip latitude, J. Atmos. Terr. Phys., 56, 1461–1475, 1994.
Sahai, Y., Fagundes, P. R., Bittencourt, J. A., and Abdu, M. A., Occurrence of large scale equatorial F-region plasma depletions during geo-magnetic disturbances, J. Atmos. Terr. Phys., 60,
1593–1604, 1998.
Sahai, Y., Fagundes, P. R., and Bittencourt, J. A., Transequatorial F-region ionospheric plasma bubbles: solar cycle effects, J. Atmos. Solar Terr. Phys., 62, 1377–1383, 2000.
Singh, S., Bamgboye, D. K., McClure, J. P., and Johnson, F. S., Morphology of equatorial plasma depletions, J. Geophys. Res., 102(A9), 20, 019–029, 1997a.
Singh, S., Johnson, F. S., and Power, R. A., Gravity wave seeding of equatorial plasma bubbles, J. Geophys. Res., 102(A4), 7399– 7410, 1997b.
Sinha, H. S. S. and Raizada, S., Some new features of ionospheric plasma depletions over the Indian zone using all sky optical imaging, Earth Planets and Space, 52, 540–559, 2000.
Sinha, H. S. S., Chandra, H., Misra, R. N., and Prakash, S., Optical imaging of plasma depletions associated with equatorial spread-F, XX General Assembly, IUGG, Vienna, pp 248, 1991. Sinha, H. S. S., Misra, R. N., Chandra, H., Raizada, S., Dutt, N., and
Vyas, G. D., Multi-Wavelength optical imaging of ionospheric
plasma depletions, Ind. J. Rad. and Space Phys. 25, 44–52, 1996. Taylor, M. J., Eccles, J. V., LaBelle, J., and Sobral, J. H. A., High resolution OI (630 nm) image measurements of F-region depletion drifts during the Guar´a campaign, Geophys. Res. Lett., 24(13), 1699–1702, 1997.
Tinsley, B. A., Rohrbaugh, R. P., and Hanson, W. B., Images of transequatorial F-region depletions in 630 and 777 nm emis-sions compared with satellite measurements, J. Geophys. Res., 102(A2), 2057–2077, 1997.
Tsunoda, R. T., Time evolution and dynamics of equatorial backscatter plumes - 1. Growth phase, J. Geophys. Res., 86, 139– 149, 1981.
Weber, E. J., Buchau, J., Eather, R. H., and Mende, S. B., North-south aligned equatorial airglow depletions, J. Geophys. Res., 83, 712–716, 1978.
Woodman, R. F. and LaHoz, C., Radar observations of F-region equatorial irregularities, J. Geophys. Res., 81, 5447–5466, 1976.