HAL Id: hal-01717303
https://hal.archives-ouvertes.fr/hal-01717303
Submitted on 26 Feb 2018
HAL is a multi-disciplinary open access
archive for the deposit and dissemination of
sci-entific research documents, whether they are
pub-lished or not. The documents may come from
teaching and research institutions in France or
abroad, or from public or private research centers.
L’archive ouverte pluridisciplinaire HAL, est
destinée au dépôt et à la diffusion de documents
scientifiques de niveau recherche, publiés ou non,
émanant des établissements d’enseignement et de
recherche français ou étrangers, des laboratoires
publics ou privés.
Deep GeMS/GSAOI near-infrared observations of
N159W in the Large Magellanic Cloud
A. Bernard, B. Neichel, M.R. Samal, Annie Zavagno, M. Andersen, C.J.
Evans, H. Plana, T. Fusco
To cite this version:
A. Bernard, B. Neichel, M.R. Samal, Annie Zavagno, M. Andersen, et al.. Deep GeMS/GSAOI
near-infrared observations of N159W in the Large Magellanic Cloud. Astronomy and Astrophysics - A&A,
EDP Sciences, 2016, 592, pp.A77. �10.1051/0004-6361/201628754�. �hal-01717303�
c
ESO 2016
Astrophysics
&
Deep GeMS/GSAOI near-infrared observations of N159W
in the Large Magellanic Cloud
A. Bernard
1, 2, B. Neichel
1, M. R. Samal
1, A. Zavagno
1, M. Andersen
3, C. J. Evans
4, H. Plana
5, and T. Fusco
1, 21 Aix-Marseille Université, CNRS, LAM (Laboratoire d’Astrophysique de Marseille) UMR 7326, 13388 Marseille, France
e-mail: [email protected]
2 ONERA (Office National d’Études et de Recherches Aérospatiales), BP 72, 92322 Chatillon, France 3 Gemini Observatory, c/o AURA, Casilla 603, La Serena, Chile
4 UK ATC, Royal Observatory, Blackford Hill, Edinburgh, EH9 3HJ, UK
5 Laboratorio de Astrofísica Teórica e Observacional, Universidade Estadual de Santa Cruz,
Rodovia Jorge Amado km16 45662-900 Ilhéus BA, Brazil Received 20 April 2016/ Accepted 25 May 2016
ABSTRACT
Aims.The formation and properties of star clusters at the edge of HIIregions are poorly known, partly due to limitations in angular resolution and sensitivity, which become particularly critical when dealing with extragalactic clusters. In this paper we study the stellar content and star-formation processes in the young N159W region in the Large Magellanic Cloud.
Methods. We investigate the star-forming sites in N159W at unprecedented spatial resolution using JHKs-band images obtained
with the GeMS/GSAOI instrument on the Gemini South telescope. The typical angular resolution of the images is ∼100 mas, with a limiting magnitude of H ∼ 22 mag (90% completeness). Photometry from our images is used to identify candidate young stellar objects (YSOs) in N159W. We also determine the H-band luminosity function of the star cluster at the centre of the HIIregion and use this to estimate its initial mass function (IMF).
Results. We estimate an age of 2 ± 1 Myr for the central cluster, with its IMF described by a power-law with an index of Γ = −1.05 ± 0.2, and with a total estimated mass of ∼1300 M . We also identify 104 candidate YSOs, which are concentrated in clumps
and subclusters of stars, principally at the edges of the HIIregion. These clusters display signs of recent and active star-formation such as ultra-compact HIIregions, and molecular outflows. This suggests that the YSOs are typically younger than the central cluster, pointing to sequential star-formation in N159W, which has probably been influenced by interactions with the expanding HIIbubble.
Key words. stars: formation – circumstellar matter – ISM: bubbles – HII regions – infrared: stars – instrumentation: adaptive optics
1. Introduction
Feedback from massive stars (M > 8 M ) plays a major role in shaping the appearance of their surroundings. Their strong ultra-violet radiation fields ionise the local interstellar medium (ISM), and their intense stellar winds and eventual supernova explosions drive the dynamics of the ISM, while also enriching it with heavy elements from the products of nuclear fusion. However, despite their dominant role in galactic evolution, the formation of mas-sive stars is still not well understood.
Two main models have been proposed to explain the forma-tion of massive stars: monolithic collapse (McKee & Tan 2003) or competitive accretion (Bonnell et al. 2001)1. In the first, the
formation scenario is similar to that in low-mass stars but with high accretion rates (and accretion disks), while in the latter the protostars grow in mass from a surrounding gas reservoir (via fil-amentary feeding) depending on their position in the clump. To understand which model and/or process is the main agent in the formation of massive stars, it is important to observe them, and their host clusters, in their earliest phases. However, due to the nature of the stellar initial mass function (IMF;Salpeter 1955), massive stars are inherently rare objects.
The earliest phases of massive stars evolve on short timescales (∼105yr) and occur deeply embedded in their natal
1 SeeTan et al.(2014) andKrumholz(2015) for recent reviews.
clumps, making them difficult to observe (Churchwell 2002;
Lada & Lada 2003). In this context, recent wide-area, near-infrared (NIR) surveys with the UKIRT and VISTA telescopes (e.g.Lawrence et al. 2007;Minniti et al. 2010;Cioni et al. 2011) have enabled detections of numerous candidate star clusters and star-forming regions (e.g.Borissova et al. 2011;Piatti et al. 2014;
Romita et al. 2016). But characterising the stellar content of such clusters remains an observational challenge, mainly due to limi-tations in angular resolution and sensitivity, which become even more critical in extragalactic systems.
The Large Magellanic Cloud (LMC) contains a rich sample of molecular clouds, and its distance (∼50 kpc, e.g.Pietrzy´nski et al. 2013;De Grijs et al. 2014) is small enough to allow study of individual objects within those clouds. The LMC is also suf-ficiently far from the Galactic plane (b ∼ −33◦) that foreground extinction is relatively small. As such, the LMC provides an ex-cellent system in which to study massive star-formation regions in an extragalactic environment (with a metallicity about half of the solar value, e.g.Dufour et al. 1982;Smith 1999).
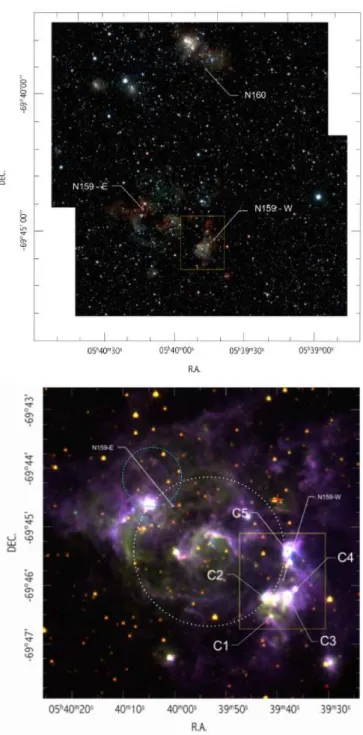
One of the richest star-forming regions in the LMC is the N159/N160 complex (see Fig.1), with its HIIregions first cat-alogued by Henize (1956). The complex is located in a ridge of molecular CO gas (Ott et al. 2008), approximately 600 pc (in projection) south from the spectacular 30 Doradus region, and is the location of the first extragalactic protostar, discovered
byGatley(1981), as well as the first known type I extragalac-tic OH maser (Caswell 1981). An overview of the structural components of the complex was given byBolatto et al.(2000), who described it as three distinct, well-separated regions (span-ning ∼150/220 pc), as follows:
1. N160: associated with HIIregions and young stellar clusters, where massive-star formation is in a relatively evolved stage and the parent clouds are almost entirely photodissociated and dissipated.
2. N159: associated with HIIregions and young stellar clus-ters, but still closely linked with molecular gas and active star formation. N159 hosts massive embedded young stel-lar objects (YSOs), a maser source, and several ultracom-pact HII(UCHII) regions (Chen et al. 2010). N159 harbours two giant molecular clouds: N159E and N159W, located on the eastern and south-western sides of N159, respectively (Johansson et al. 1998;Jones et al. 2005;Fukui et al. 2008). CO observations also reveal a very high concentration of molecular gas at the location of N159W (Cohen et al. 1988;
Johansson et al. 1998;Bolatto et al. 2000).
3. N159S: a giant molecular cloud ∼60 pc south of N159 (thus not included in Fig.1), with seemingly little star-formation activity (Bolatto et al. 2000;Galametz et al. 2013), although the detection of candidate Herbig Ae/Be stars at its north-ern tip suggests cluster formation might just be starting (Nakajima et al. 2005).
The morphology described above suggests sequential star-formation southwards through the complex. This is supported by NIR imaging fromNakajima et al.(2005), who suggested that star formation in N160 may have been initiated by a supergiant shell (SGS 19, with its centre north-northeast of N160) with sub-sequent star formation in N159 and the tip of N159S. This sce-nario is also supported byFarina et al.(2009) from spectroscopic observations of massive stars across the region.
Early studies of the stellar content and exciting stars from op-tical observations of N159 were presented byHeydari-Malayeri & Testor(1982) andDeharveng(1992). From observations with the Spitzer Space Telescope Infrared Array Camera (IRAC),
Jones et al.(2005) argued that the different components in N159
have a common star-forming history, with a wind-blown bubble (∼1−2 Myr old) initiating star formation at the rim. The Papillon Nebula (Meynadier et al. 2004) in the the northeast of the bubble and the C2 and C5 compact clusters (see below) are located on the edge of this bubble (indicated by the ∼40 pc diameter circle in the lower panel of Fig.1). These arguments are substantiated by the map of star-formation rate fromGalametz et al.(2013).
From analysis of Spitzer observations with the Multiband Infrared Photometer,Chen et al.(2010) proposed a more compli-cated pattern of star formation in N159, where the expansion of the HIIregion could have triggered the star formation in N159E but not in N159W. They concluded this from a comparison of the distribution of YSOs and massive stars in both regions, and sug-gested that star formation in N159W may have started sponta-neously (or was triggered by a force that is no longer detectable, e.g. an old supernova remnant).
A first high-resolution NIR study of N159W, taking advan-tage of adaptive optics (AO), was presented by Testor et al.
(2006), who resolved some of the candidate YSOs/clusters
into multiple components for the first time. More recently, 13CO (J= 2−1) observations of N159W with the Atacama Large Millimetre Array (ALMA) have discovered the first two extra-galactic protostellar molecular outflows (Fukui et al. 2015).
Fig. 1.Overview of the N159/N160 complex. Top: composite VISTA
image (Cioni et al. 2011), combining Y (blue), J (green) and Ks (red)
bands. Bottom: composite Spitzer image of N159E and N159W, com-bining 3.6 µm (blue), 4.5 µm (green) and 8 µm (red). The N159W field targetted by GeMS/GSAOI is shown by the yellow square. Compact clusters discussed in the paper are labelled C1-C5. The positions of the close X-ray binary LMC X-1 and the SNR 0540−697 (Chen et al. 2010) are marked in dash-dotted cyan line and red cross respectively.
In this paper we investigate the stellar content of N159W, using deep, high angular-resolution JHKs-band images ob-tained with the Gemini South Adaptive Optics Imager (GSAOI,
McGregor et al. 2004;Carrasco et al. 2011), fed by the Gemini Multi-conjugate adaptive optics System (GeMS, Rigaut et al. 2014; Neichel et al. 2014). The observed field covered a field of ∼9000 across (as shown in Fig. 1). These observations cover a wider field than the previous AO-corrected imaging, at finer angular resolution, and reach some 2−3 mag deeper. This
combination of high angular-resolution and excellent sensitivity in the NIR provides us with an unprecedented view of N159W, to investigate its stellar content and ongoing star formation.
The paper is organised as follows. In Sect. 2 we present the observations, data reduction, and completeness and contamina-tion analysis. Seccontamina-tion 3 discusses the morphology of the region, and colour−colour and colour−magnitude diagrams from the data are used to identify candidate YSOs. In Sect. 4 we derive the luminosity function, and associated IMF of the central clus-ter. Section 5 discusses the star-formation scenario in the N159W complex, with a closing summary in Sect. 6.
2. Observations and data reduction 2.1. Observations
The data were obtained with the Gemini South Adaptive Optics Imager (GSAOI,McGregor et al. 2004;Carrasco et al. 2011), fed by the Gemini Multi-conjugate adaptive optics System (GeMS,
Rigaut et al. 2014; Neichel et al. 2014) on 2014 December 8 as part of programme GS-2014B-C-2 (P.I. B. Neichel). GSAOI provides images of a 8500× 8500 field of view, at a plate scale of ∼20 mas/pixel (seeMcGregor et al. 2004;Carrasco et al. 2011). The focal plane is imaged by a 2 × 2 mosaic of Hawaii-2RG 2048 × 2048 pixel arrays, with 300. 0 gaps between each array.
The observations are summarized in Table 1 and the final three-colour (JHKs) image is shown in Fig.2. Each science ob-servation was randomly dithered around the central pointing by 500 to fill-in the detector gaps, and adjacent sky frames were taken 20.5 from the science field. The average resolution obtained over the field, as measured by the full-width half maximum (FWHM) of the stars on single-exposure frames, is reported in Table1, as is the natural seeing at the time of the observations (measured at zenith). The average FWHM in the Ks-band was 105 mas, while the average Strehl ratio (SR) obtained was 15%. These performances are slightly worse than those expected for such good-seeing conditions, but are consistent with observa-tions at low altitude (airmass between 1.3 and 1.6), as is the case for the LMC as seen from Cerro Pachon. The coordinates of the field centre were α= 05h39m40s, δ= −69◦4505500(J2000), cho-sen to span two star-forming regions of interest and to overlap with the field observed byTestor et al.(2006).
2.2. Data reduction
The data were reduced using the same methods as those from
Neichel et al.(2015), using home-made procedures developed in
yorick
(Munro 1995). The relevant steps were: (i) creation of a master flatfield, based on sky-flat images taken during twilight of the same night; (ii) creation of a master sky-frame based on the dedicated sky images; (iii) correction of the science frames using the relevant master flats/skies, as well as for detector non-linearities and different gains between each detector.In addition, it was necessary to apply an instrumental dis-tortion correction. An initial disdis-tortion map was derived from GeMS/GSAOI observations of the Galactic globular cluster NGC 288, that were correlated with images from the Advanced Camera for Surveys on the Hubble Space Telescope (HST). This distortion map lead to a residual positioning accuracy of ∼000. 2, which is not good enough for the image quality of the GeMS/GSAOI images here. Moreover, this calibration only accounts for the static instrumental distortion – a dynamical component, which depends on the constellation of natural guide
stars and environmental factors like the telescope pointing, still needs to be taken into account.
The dynamical contribution to the distortion map has to be corrected frame by frame, selecting one frame as the primary astrometric reference. By using high-order polynomials and the position of relatively bright stars common to all the frames, we were able to cross-register the images by the following steps: (i) creation of a polynomial base (P)i of distortion modes as Pi(x, y) = Ci,0+ Ci,1x+ Ci,2y + Ci,3x2+ Ci,4xy + Ci,6y2 + ...; (ii) measurement of the vectors Vxand Vyof the positional dif-ference between each image and the redif-ference frame, for each of the bright (<21 mag) stars common to all frames; (iii) perform a Levenberg–Marquardt fit of the Vxand Vyvectors on the poly-nomial base and determination of the αiand βicoefficients such that: Vx= P αiPiand Vy= P βiPi; (iv) application of the inverse distortion map to the full image.
Of course, the quality of the above corrections depends on the number of stars available for the procedure. The N159W ob-servations provided a large number of reference stars and, by us-ing 15 degrees of freedom per axis, we obtained corrected frames with a typical precision of 0.1 pixel. Following the procedure de-scribed above, each individual image was reduced and combined by filter to produce three final reduced images.
2.3.STARFINDERphotometry
Photometry for the stars in the observed field was obtained us-ing the
starfinder
package (Diolaiti et al. 2000). Because of the complex structure of AO-corrected point spread functions (PSFs), and their spatial and temporal variations, photometry of AO images requires PSF-fitting algorithms that provide more ac-curate results than regular aperture photometry (see, e.g.Neichel et al. 2015).starfinder
builds an empirical PSF by combining resultsfor several stars in an image. In the case of spatial variations of the PSF across a field, it is usually divided into subfields, with
starfinder
then used on each subfield in turn. There isnatu-rally a trade-off between having enough stars in each subfield so that an accurate PSF model can be extracted, versus keeping the subfield as small as possible to minimize PSF variations. We ex-perimented with a range of subfield sizes for N159W. The min-imum residual was obtained for subfields of 1600× 1600, shifted by 800 (in x or y) to introduce an overlap between the frames. Each star was then measured several times, using different sets of PSFs, which were then used to investigate the photometric errors.
The other critical aspect of tuning the
starfinder
analy-sis is the choice of the number of iterations, the relative thresh-old, and the correlation threshold for star extraction at each it-eration. These parameters are summarized in Table1. Note thatstarfinder
goes through several iterations of star detection, re-moving the detected stars at each iteration. We can then adjust different threshold levels, pushing toward low signal-to-noise over the iterations. The numbers given in the ninth column of Table1are the thresholds used for each iteration.We adjusted the
starfinder
parameters so that single faint stars were detected without too much contamination from re-maining bad/hot pixels or from structures in the background. Our three final reduced images (J, H, and Ks) have different charac-teristics in terms of noise and resolution, so thestarfinder
pa-rameters have been optimized for each filter. To detect as many of the faint stars as possible we used 2 × 2 binned images. This enabled the detection of faint stars more robustly and, as the pixel size is 20 mas and the typical resolution was ∼100 mas,Fig. 2.Three-colour GeMS/GSAOI image of N159W combining J (blue), H (green), and Ks(red); north is up and east is left. The width of the
image (east to west) is 9000
(∼22 pc). Compact clusters discussed in the paper are labelled C1-C5, and the white circle indicates the H II bubble enclosing the central star cluster.
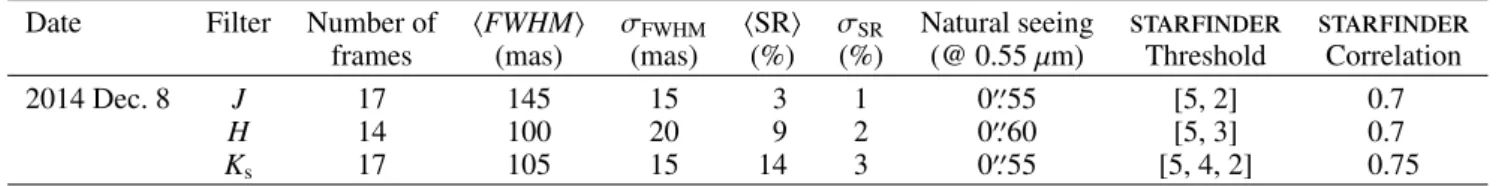
Table 1. Observational details and
starfinder
parameters used for the star detection and photometry for each filter.Date Filter Number of hFWHMi σFWHM hSRi σSR Natural seeing
starfinder
starfinder
frames (mas) (mas) (%) (%) (@ 0.55 µm) Threshold Correlation2014 Dec. 8 J 17 145 15 3 1 000. 55 [5, 2] 0.7
H 14 100 20 9 2 000. 60 [5, 3] 0.7
Ks 17 105 15 14 3 000. 55 [5, 4, 2] 0.75
Notes. The quoted full width half maximum (FWHM) and Strehl ratio (SR) of the point-spread functions (and their corresponding standard deviations) are the means from measurements of over 200 stars uniformly distributed over the field, from all the individual frames. The exposure time for each image was 80 s. The two/three values given for the
starfinder
threshold mean that the algorithm does two/three iterations, with athe binned images are still well sampled, with no loss of spa-tial information. Three bright stars were saturated in the H- and Ks-band observations (with pixel counts in excess of 50 000 e−). These were excluded from the PSF definition and photometry, with their magnitudes adopted from observations of N159/N160 with the Infra-Red Survey Facility (IRSF) by Nakajima et al.
(2005). The final photometric catalogue contains magnitudes for 2185 stars in J, 4187 in H and 3912 in Ks.
2.4. Photometric and astrometric calibration
To calibrate the instrumental magnitudes we evaluated the pho-tometric zero-points, employing values for 40 well-isolated stars in the observed field from the IRSF observations (Nakajima et al. 2005). A reasonable match is found, with a zero-point uncer-tainty of 0.06 mag in J and H, and 0.08 mag in Ks.
As an independent check, we also attempted to derive a zero-point using the 2MASS catalogue (Skrutskie et al. 2006). The pixel size of the 2MASS cameras was only ∼200, so there is a large mismatch compared with the GSAOI images, and only 10 of the isolated stars used above could be securely identified. The zero-point uncertainties from calibration with the 2MASS stars were 0.2 mag in J and H, and 0.1 mag in Ks. Given the smaller number of stars availale, we therefore adopted the zero-points determined using the IRSF catalogue2.
The world-coordinate system was also calibrated using the same 40 isolated stars from the IRSF catalogue (for which the quoted astrometric accuracy is 0.500;Nakajima et al. 2005). The astrometric solution of the GSAOI images was set using the x/y (pixel) positions of each star cf. the IRSF positions, result-ing in a mean astrometric dispersion of 5 mas (i.e. less than the typical FWHM of the images, so no confusion is expected).
2.5. Photometric error and completeness
After calibration, we undertook a series of completeness tests in each filter to estimate the depth and photometric uncertainties of our images. The detectability of a source depends on the local stellar density and the
starfinder
settings, and may also be af-fected by diffuse background in the case of a region like N159W. To determine the completeness of our images we used simulated stars inserted in the real images. As for the PSF analysis, we divided the image in subfields and used the corresponding local PSF fromstarfinder
to construct simulated stars which mimic the real variations across the field.A set of 1000 artificial stars was inserted at random posi-tions in each subfield, following the method from (Neichel et al. 2015). Random magnitudes (in steps of 0.5 mag) between 14.0 and 22.0 were assigned for each filter. The
starfinder
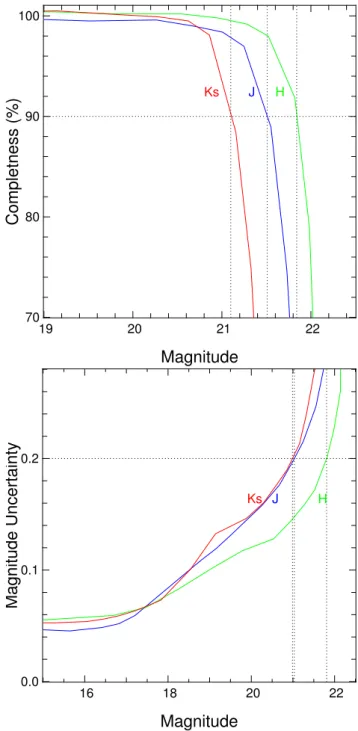
source detections were then run using the exact parameters as those in Table1, and the number of artificial stars successfully recovered was used to estimate the photometric completeness. At the same time we also estimated the photometric error by computing the standard deviation of the difference between the measured and simulated magnitudes.Results of these tests are shown in the upper panel of Fig.3, with 90 % completeness obtained at J= 21.55, H = 21.85, and Ks= 21.85 mag3. Results for the photometric uncertainties are
2 Corrections between the IRSF and 2MASS systems are small,
amounting to <0.05 mag for (J − Ks)IRSF< 1.7 mag (Kuˇcinskas et al.
2008), so are neglected when estimating the final photometric error.
3 This is 2.55, 3.85, and 4.50 mag deeper than the respective limiting
JHKsmagnitudes of the IRSF data (Nakajima et al. 2005).
Ks J H 19 20 21 22 70 80 90 100
Magnitude
Completness (%)
Ks J H 16 18 20 22 0.0 0.1 0.2Magnitude
Magnitude Uncertainty
Fig. 3. Completeness (upper panel) and photometric uncertainties (lower panel) for each filter estimated from the completeness tests.
shown in the lower panel of Fig.3; the final photometric uncer-tainties are given by these errors combined in quadrature with the zero-point errors estimated above.
3. Results
3.1. Morphology of the N159W complex
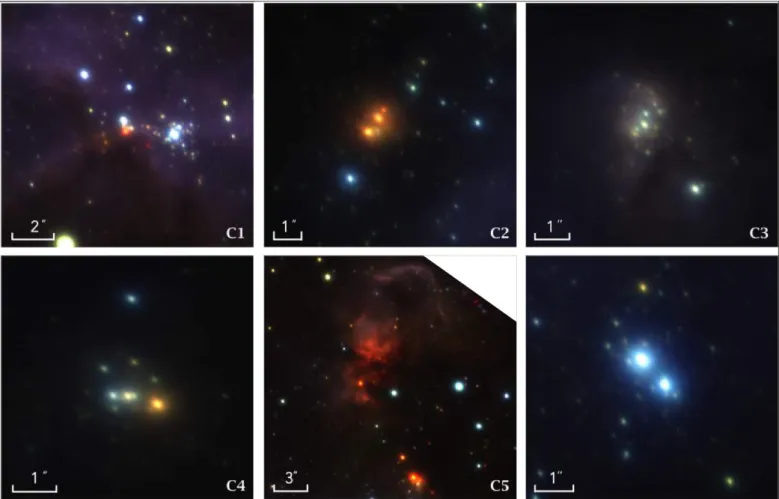
The composite GeMS/GSAOI image of N159W is shown in Fig.2. Toward the south of the observed field we can clearly identify the ionised HII region, forming an almost circular nebula (as indicated by the white circle in the figure). There are two bright stars separated by ∼000. 9 at the centre of the nebula, with J= 14.15 and 14.85 mag (with the northern star the bright-est, as shown in the lower-right panel of Fig.4); these are thought
Fig. 4. Details of the five compact clusters (C1-5) and central two O-type stars (thought to ionise the central cluster) from the three-colour GeMS/GSAOI image; J (blue), H (green), and Ks(red).
to be the primary ionising sources of the HIIregion (Deharveng 1992). Optical spectroscopy from Conti & Fitzpatrick (1991) classified the (then unresolved) composite spectrum as O3-6 V, while also suggesting that it might well be a small compact clus-ter.Deharveng(1992) classified the two stars as O5-6 and O7-O8, and Testor et al. (2006) obtained a NIR spectrum of the brightest star, confirming it as an O star of type O5-6, with an es-timated extinction of AV = 3.54 mag. For completeness, we note thatFarina et al.(2009) classified their spectrum of the central source(s) as O84. The cluster associated with these two massive stars, within the surrounding nebula, is hereafter referred to as the central cluster.
Three compact clusters are observed at the edge of the neb-ula, identified as C1, C2 and C3 in Fig.2. These are located sym-metrically around the nebula, at an almost equidistant projected distance from the centre. Another compact cluster (identified as C4) is located to the north-east of C3, and further north there is a very embedded region, labelled as C5. The properties of each of these are now discussed in turn.
3.1.1. Compact cluster C1
This corresponds to a class II YSO (053940.78−694632.0) iden-tified byChen et al.(2010), which was also classified as a Herbig Ae/Be star byNakajima et al.(2005). Our observations reveal a
4 Their observed coordinates are ∼000.3 from the position of the brighter
star so their spectrum was likely dominated by this object, albeit con-taminated by the other star given their quoted pixel scale and slitwidth.
compact cluster (see Fig.4), with the reddest star consistent with the position of the previously reported YSO/Herbig object. The clump that hosts this cluster has a somewhat cometary shape, with a limb-brightened rim, and is further discussed in Sect.5.
3.1.2. Compact cluster C2
This compact cluster is source P2 fromJones et al.(2005), and N159A7 fromTestor et al.(2006, resolved by their observations into their sources 121, 121a, 123, and 123a). This also corre-sponds to a class I/II YSO (053941.89−694612.0) from Chen et al.(2010), who estimated its mass to be 33.7 ± 2.6 M , with AV = 12.7 mag (while also noting it had multiple components).
The expanded view of C2 from the GeMS/GSAOI images is shown in Fig.4, revealing two dominating components and several other sources, all embedded in a diffuse nebula with a diameter of ∼0.55 pc. The two main components have compa-rable Ks-band magnitudes, while the redder source (123 from
Testor et al.) is probably the source dominating the YSO lumi-nosity and mass estimate fromChen et al.; spectroscopy of this source fromTestor et al.confirms that it is in a very early stage (class 0/I YSO), so it is unlikely to have started ionising its sur-roundings. Interestingly, C2 is one of the two high-mass sources with a reported outflow from the ALMA observations byFukui et al. (2015). They suggest that star formation in this compact cluster was likely triggered by the collision of two thin filaments of gas ∼105yr ago.
3.1.3. Compact cluster C3
This cluster was detected as a compact radio source byHunt & Whiteoak (1994, their source 5) andIndebetouw et al.(2004). It corresponds to 053937.53−694609.8 fromChen et al.(2010), who classified it as a type I/II YSO (with multiple components). Their mass estimate was 31.2 ± 2.9 M , with an inferred spectral type of O7 V (cf. the spectral type of O7.5 V inferred from the analysis of radio data byIndebetouw et al.). C3 is also N159A5 fromTestor et al.(2006), who described it as a tight cluster of five stars (their nos. 133, 136, 137, 138 140), with an estimated extinction of AV= 8−12 mag.
All the components are embedded in nebulosity with a diam-eter of 100. 9 (0.5 pc). Our GeMS/GSAOI data resolve C3 into even more components than past observations with ∼20 sources (see Fig.4).Jones et al. (2005) described the cluster as a compact HIIregion with one or more OB-type stars, and spectroscopy fromTestor et al.(2006) of the brightest member (hence likely dominant source of ionising photons) revealed a late O-type star (also seeMartin-Hernandez et al. 2005).
3.1.4. Compact cluster C4
This corresponds to N159A6 fromTestor et al.(2006), who re-solved it into six stars embedded in nebulosity with a diameter of 0.45 pc. Our observations resolve C4 into at least 12 stars, as shown in the lower-left panel of Fig.4. In particular, star 155 fromTestor et al.(in the centre of the image) is now resolved into a double star. C4 is also source 053935.99−694604.1 fromChen et al.(2010), who classified it as a type I YSO and noted it having multiple components. Indeed, using the photometry fromTestor et al.(their star 151, the bright, red object on the western edge of C4 in Fig.4),Chen et al.estimated a mass of 18.5 ± 1.4 M , with AV= 2.5 mag; this object was also classified as a Herbig Ae/Be star byNakajima et al.(2005).
3.1.5. Compact cluster C5
C5 is a very red region which appears to be deeply obscured with nebulosity detected fin the H- and Ks-bands (see Figs.2and4). It is the most intense 6 cm (4.8 GHz) continuum source seen in ob-servations with the Australia Telescope Compact Array (ATCA) of N159 (Hunt & Whiteoak 1994;Indebetouw et al. 2004), and has the highest dust surface-densities in the whole N159/N160 complex, and one of the highest star-formation rates (Galametz et al. 2013).
The Spitzer observations fromChen et al. (2010) revealed the presence of an embedded YSO in C5, which they classified as type I, estimating a mass of 34.8 ± 8.4 M , with an inferred spectral type of O6 V. More recently, ALMA observations of the dense CO gas in C5 revealed a complex structure (their “N159W-N”;Fukui et al. 2015), with several filaments which are generally elongated in the northeast-southwest direction, and the detection of a blue-shifted lobe of an outflow, thought to be associated with the YSO. Taking into account longer-wavelength data from the Herschel Space Observatory,Fukui et al.estimated the mass and luminosity of the YSO (their “YSO-N”) to be 31 ± 8 M and (1.4 ± 0.4) × 105L , respectively.
No stars are detected in our GeMS/GSAOI images at the lo-cation of the YSO (Chen et al. 2010;Fukui et al. 2015) or the UCHII region (Indebetouw et al. 2004). Indeed, only one very red star (with J= 21.9, H = 18.4 and Ks= 16.2 mag) is detected in/near the clump, some 200(0.5 pc) south of the UCHII region.
3.2. Identification and distribution of young stellar sources 3.2.1. Near-IR colour−colour diagram
To investigate the nature of the stellar population of N159W, in the left-hand panel of Fig.5we show the (H − Ks) vs. (J − H) colour−colour diagram (CCD) for the 1386 sources detected in each of the JHKsbands (for which the photometric error is lower than 0.2 mag). Overlaid on the CCD are curves representing the main sequence (MS) and giant branch (shown in red and orange, respectively;Bessell & Brett 1988), and the locus of T Tauri stars (TTS, shown in blue;Meyer et al. 1997)5.
Reddening vectors are also overplotted in Fig.5(as dashed red lines), drawn from the tip of the giant branch (left), from the base of the MS (middle), and from the reddest TTS (right). In each of these we calculate the reddening adopting a normal extinction law, with: AJ/AV= 0.282, AH/AV= 0.175, AK/AV= 0.112 (Rieke & Lebofsky 1985). Shifting the brightest stars along the reddening vector to the MS, we find that they are consistent with the expected colours of O4-O5 stars, in good agreement with the spectroscopy of the central stars discussed above.
Most of the sources in the left-hand panel of Fig.5are within the reddening band of the MS, which could be a mixture of red-dened field stars and sources with warm circumstellar dust, a standard characteristic of young pre-main-sequence (PMS) ob-jects (Lada & Adams 1992). In contrast, stars lying redwards of the middle reddening vector are expected to be associated with NIR-excess from optically-thick circumstellar disks. We can therefore use the CCD for a first identification of NIR-excess objects.
To understand the potential contamination from back-ground/foreground stars, the same CCD is shown for the con-trol field in the right-hand panel of Fig.5. Most of the sources are also within the MS reddening band, and only a few objects are found further redwards, which could be due to unresolved binaries.
Thus, to try to identify candidate YSOs which are associated with the cluster we applied the following two criteria:
1. H − Ks> 1 σ (where σ is the error on the colour term) from the MS reddening vector.
2. J−H > 0.65 mag to avoid the region in the control field which contains other sources.
We may have missed a few candidates using these criteria, but we aimed to minimise the contamination by non-cluster mem-bers in the final sample. The 36 candidate YSOs with NIR ex-cesses identified using these criteria are indicated in Fig.5with blue circles.
We comment that 2256 sources were detected only in the H-and Ks-bH-ands; while these are not included in Fig.5, some may also be YSO candidates with NIR excesses. Equally, some YSOs appear relatively normal in the NIR, but are found to display ex-cesses when going to even longer wavelengths, e.g. from Spitzer observations (Ojha et al. 2011;Chavarría et al. 2014;Saral et al. 2015). Thus, the number of YSO candidates identified from our analysis is knowingly an underestimate of the likely total in the region. Either deeper J-band observations and/or high spatial-resolution L- and M-band observations are needed to recover all the candidates. Nevertheless, in the next section we attempt to re-cover some of these embedded sources from their H−Kscolours.
5 In which the MS and TTS loci have been converted to the 2MASS
MS Giant T-Tauri Reddening lines Mean error MS Giant T-Tauri Reddening lines Mean error
Fig. 5.Colour−colour diagrams for the cluster region in N159W (left-hand panel) and the control region (right), with the loci of the main sequence (MS), giant branch, and T Tauri stars (TTS) overlaid in red, orange and blue, respectively. Also shown are reddening vectors (dashed red lines) drawn from the tip of the giant brach (left), from the base of the MS (middle), and from the reddest TTS (right). Cluster sources with a NIR excess are indicated in the left-hand panel by the blue circles. The error bars in the lower-right corner show the average uncertainties in the colour terms.
3.2.2. Near-IR colour−magnitude diagram
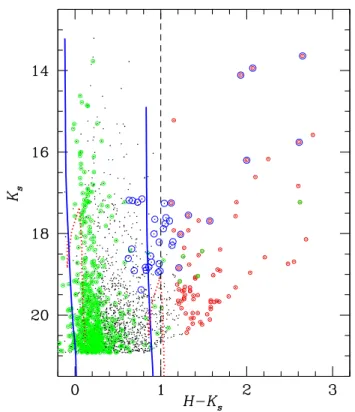
The colour−magnitude diagram (CMD) of the 2256 sources de-tected only in the H- and Ks-bands (with photometric errors of <0.2 mag) is shown in Fig.6(black points), together with stars observed in the control field overlaid (black points with green circles). Also plotted are the zero-age main sequence (solid blue lines) and the 1 Myr PMS isochrone from Siess et al. (2000, dotted red lines)6for extinctions of A
V= 0 and 15 mag. In con-trast with the control field, N159W has a significant number of stars with (H − K) > 0.7 mag, which could be associated with the young population of the cluster. However, trying to disentangle young stars from reddened background stars from such a CMD is complex, so we adopted the following approach. We considered the maximal extinction seen in the direction of N159W, and ap-plied this to the intrinsic colour of a dwarf star. We then consid-ered all sources redder than this as potential NIR-excess sources associated with the cluster region.
We estimated the maximum extinction using the 21 cm HI
ATCA observations fromDickey et al.(1994, which had an an-gular resolution of ∼700). From the HIabsorption in the direction of N159W they estimated N(HI)= 9.62 × 1022cm−2. The gas-to-dust ratio, NH/E(B − V), in the LMC is several times larger than the Galactic value (Lequeux 1989;Clayton 1985). Using the conversion NH/E(B − V) = 2 × 10²²atoms cm−2mag−1from
Lequeux(1989) and RV= AV/E(B − V) = 3.1, we estimated a maximal visual extinction toward N159W of AV∼15 mag7. The resulting E(H − K) for a background star is ∼0.9 mag (from AV= 15.9 × E(H − K), Rieke & Lebofsky 1985). Considering the intrinsic H − Kscolour of 1 Myr PMS stars is ∼0.1 mag (see
6 We employed the isochrones fromSiess et al.(2000) as they are the
only PMS evolutionary models available which extend to a mass limit of 0.1 M and with a subsolar metallicity (calculated for Z= 0.01, cf.
the slightly lower metallicity of the LMC of Z= 0.008).
7 This agrees with the maximum value from the YSO analyses byChen
et al.(2010).
Fig. 6.Colour−magnitude diagram of sources in N159W detected in only the H- and Ks-bands (black points) and those in the control field
(black points with green circles). Also plotted are the zero-age main sequence (solid blue lines) and the 1 Myr PMS isochrone fromSiess et al.(2000, dotted red lines) for extinctions of AV= 0 and 15 mag. Red
circles highlight candidate YSOs identified from our colour cut (see text for details). Blue circles highlight candidate YSOs previously identified from the CCD (Fig.5).
Fig.6), AV= 15 mag would shift their location to maximum of (H − Ks) ∼ 1 mag.
10"
Fig. 7.Locations of the candidate YSOs in the GeMS/GSAOI Ks-band image, compared with the intensity of 8 µm emission from Spitzer
obser-vations (green contours,Jones et al. 2005); north is up and east is left. The blue circles show YSO candidates from analysis of the colour−colour diagram, red circles are those from analysis of the colour−magnitude diagram, see text for details. The left-hand panel shows the region around the central cluster (indicated by the white circle), with the yellow arc showing the location of an apparently limb-brightended rim; the right-hand panelshows the region around the C5 compact clump.
Thus, we considered sources with H − Ks> 1 mag as candi-date YSOs, with intrinsic excesses from disks and/or envelopes. In our sample selection we employed a slightly more conserva-tive colour cut, only selecting those sources with H − Ks> 1 + σ, where σ was the estimated uncertainty on the colour term. Applying this method we identified 68 additional candidates, as shown by red circles in Fig. 6, although we acknowledge that a small number of these might be highly-reddened back-ground sources. This gives 104 candidate YSOs in total: 36 from analysis of the CCD, and 68 additional candidates from the CMD.
3.2.3. Spatial distribution of candidate YSOs
The spatial distribution of YSOs in a star-forming complex pro-vides an excellent tracer of recent star formation. The locations of our candidate YSOs in the region of the central cluster and the C5 clump are shown in the left- and right-hand panels of Fig. 7, respectively, including candidates from analysis of the CCD (blue circles) and CMD (red circles). Also shown are in-tensity contours of 8 µm emission from the Spitzer IRAC data (Jones et al. 2005). The locations of the candidate YSOs are generally correlated with the 8 µm emission, which also corre-sponds to dense clumps of molecular gas (e.g.Seale et al. 2012). In contrast, there are only a few candidate YSOs in the central cluster region (indicated by the white circle in Fig.7), where the 8 µm emission is less intense.
The 8 µm morphology around the cluster resembles many Galactic bubbles associated with HIIregions (e.g.Deharveng & Zavagno 2011). The 8 µm IRAC band contains emission features at 7.7 and 8.6 µm which are commonly attributed to polycyclic aromatic hydrocarbons (PAHs; e.g.Peeters et al. 2004). PAHs are believed to be destroyed in ionised gas (Pavlyuchenkov et al. 2013), but are thought to be excited in the photo-dissociation region at the interface of a HIIregion and a molecular cloud,
by the absorption of far-UV photons from the exciting stars of the HIIregion. In particular, PAH emission is thought to be a good tracer of the formation of B-type stars (Peeters et al. 2004), which heat the surrounding dust to high temperatures, exciting the PAH bands and fine-structure lines. Indeed, bright, compact emission around B-type stars has been seen in Galactic bubbles (e.g.Zavagno et al. 2007; Samal et al. 2014;Dewangan et al. 2015;Kerton et al. 2015).
In summary, the locations of the candidate YSOs support the idea that the compact 8 µm emission and molecular clumps in N159W appear to be associated with recent massive-star forma-tion, (see alsoJones et al. 2005;Testor et al. 2006). In contrast, the relative absence of YSOs in the central cluster suggests it was formed earlier. Possible scenarios for the history of the re-gion are discussed in Sect.5.
4. Properties of the central cluster
We now discuss the properties of the central cluster, defined as the sources detected within the white circle in Figs.2and7. 4.1. Age
We estimated the age of the central cluster using the CMD of its member stars (see Fig.8). We preferred to use the J-band here rather than H or Ks to minimize the effect of potential NIR-excesses on the age estimate. The zero-age main sequence (blue line, Marigo et al. 2008) and PMS isochrones for ages of 0.5−3 Myr (Siess et al. 2000) are also plotted in the figure, after correction for the distance (50 kpc) and mean extinction (AV= 2.8 mag,Testor et al. 2006).
The main sequence is well defined (albeit sparsely popu-lated) down to J ∼ 18.5 mag in Fig. 8. At fainter magnitudes a number of redder stars are seen and, from comparison with the isochrones from Siess et al. (2000), some are probably
Fig. 8.Colour−magnitude diagram of stars in the region of the central cluster, with the two central O-type stars indicated by the large blue symbols. PMS isochrones fromSiess et al.(2000, for Z= 0.01) and ages of 0.5, 1, 2, and 3 Myr (from right to left), corrected for a distance of 50 kpc and average extinction of AV= 2.8 mag, are indicated by the solid
black lines, with the zero-age main sequence fromMarigo et al.(2008) shown by the blue line.
PMS stars. The majority of these stars are located redwards of the 3 Myr isochrone (after correction for the mean extinc-tion), indicating that the cluster is unlikely to be older than 3 Myr. However, background sources could also populate this PMS zone. To minimise such contamination we selected only sources within a radius of 400(1 pc) of the central massive stars, where the stellar density is greatest. These sources are marked with open circles in Fig. 8, and most are located between the 0.5 and 3 Myr isochrones, confirming the young age of the clus-ter. From this spatially-restricted subsample the average age es-timated for the central cluster is 2 ± 1 Myr.
4.2. Mass function
We also investigated the IMF and total mass of the central clus-ter. We limited our analysis to the region indicated by the white circle in Fig.2as it represents a well-bounded sample (in terms of age, metallicity and distance), and the observed present-day mass function should then be a fair representation of the under-lying IMF. Here we used the H-band photometry, as the number of sources and photometric accuracy were better cf. the other bands (while also avoiding potential NIR excesses which might influence the Ks-band photometry).
In constructing the luminosity function for the cluster we corrected for possible field-star contamination using two approaches8. The first method used statistics from the control field, while the second attempted to disentangle cluster and field stars based on their location in the H vs. H − Ks CMD
8 Note that by adopting a completeness criterion of 90% in Sect.2.5,
the impact of incompleteness below this magnitude limit is negligible.
18 19 20 21 22 0 20 40 60
H−Magnitude
# Stars
Fig. 9.H-band luminosity functions for the central cluster (dashed line), and the control field (dotted line). The luminosity functions are also shown after correction for field-star contamination, using the control field (black solid line) and the colour-cut selection (red line). Error bars are estimated from Poisson statistics, and the (90%) completeness limit is indicated by the vertical solid line (H= 21.85 mag).
(see Neichel et al. 2015). Corrections were done for magni-tude bin by subtracting the estimated number of field stars from the detected source counts. The two methods gave consistent results, as shown in Fig. 9, in which estimated uncertainties are from Poisson statistics (i.e., the square root of the number of stars). As our sample is limited in size, these uncertainties are the primary limitation on determination of the luminosity function.
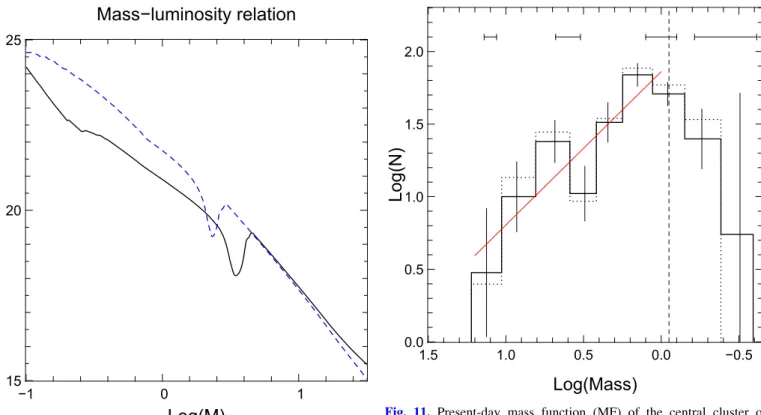
To construct the present-day mass function of the cluster we converted the luminosity function using mass-luminosity rela-tions (Fig. 10), constructed from isochrones from Siess et al.
(2000) for M < 6 M , and from Marigo et al. (2008) for more massive stars, adopting the same distance and average extinction as before. Given the uncertainty in the exact age of the cluster, we estimated the mass function using both the 1 and 3 Myr re-lations, and then calculated the average to account for a small spread of ages. The final mass function, assumed to be represen-tative of the IMF given the young age, is shown in Fig.11. The typical uncertainties on the mass estimates are indicated above the mass function, and the estimated uncertainties on the number in each bin are again from Poisson statistics.
We do not expect significant variations in NIR extinction across the central cluster, so adopting a mean value in this analysis should have a limited impact on the estimated masses. To investigate this further we estimated the Ks-band extinction from the H − Kscolours (as described byGutermuth et al. 2005), finding an average AKs= 0.3 ± 0.05 mag, with peak values be-tween 0.2 < AKs< 0.4 mag. This is consistent with the estimated optical extinction (AV= 2.15 and 3.54 mag) toward the two cen-tral massive stars (Testor et al. 2006). Thus, the impact of vari-able extinction is minimal compared to the potential age spread.
−1 0 1 15 20 25
Log(M)
H
Mass−luminosity relation
Fig. 10.Mass-luminosity relation for the 1 Myr (black solid) and 3 Myr (blue dashed) isochrones.
The IMF estimated from Fig. 11 spans masses of ∼0.5−10 M , and shows the typical rise in number of stars with decreasing mass into the subsolar regime. A simple fit over this mass range gave a power-law slope of Γ = −1.05 ± 0.2, cf. the canonical value ofΓ = −1.35 (Salpeter 1955). We experimented with changing the bin sizes and mass limits of the fit, but the results were consistent with the quoted uncertainty of ± 0.2 dex. The IMF for the cluster in N159W appears to peak at a mass between 0.5 and 1 M , although we are limited by our uncer-tainties in the mass estimates in this range; incompleteness also limits any conclusions for lower masses (M < 0.5 M ) from our data. Nonetheless, we note that such a flattening of the IMF at ∼0.5 M is found in Galactic clusters (e.g.Kroupa 2001,2002;
Luhman 2007;Bastian et al. 2010;Dib 2014) and in other clus-ters in the Magellanic Clouds (e.g.Da Rio et al. 2009;Andersen et al. 2009;Liu et al. 2009b;Gouliermis et al. 2012).
Only deep HST observations can currently investigate the lower-mass IMF in clusters in the Clouds. The only example to date is the study of NGC 1818 (with an age of 20−45 Myr) by
Liu et al.(2009a), who investigated the IMF down to 0.15 M , concluding that it was best described by a broken power-law (Γ = 0.46 ± 0.10 for 0.15 < M < 0.8 M , and a Salpeter-like slope, Γ ∼ −1.35, at higher masses) and that the estimated turn-over mass was consistent with the 0.5 M from Kroupa
(2001) given the uncertainties.
The N159W data discussed here are representative of the limitations of AO-corrected observations from current 8−10 class telescopes. Robust investigation of the low-mass regime of the IMF in the Clouds requires imaging with both the high sensitivity and angular resolution provided by, e.g. the MICADO instrument (Davies et al. 2010) under construction for the 39 m European Extremely Large Telescope.
When integrating over all the bins of the IMF, down to a mass limit of 0.9 M , we estimated a total mass of 650 ± 60 M
−0.5 0.0 0.5 1.0 1.5 0.0 0.5 1.0 1.5 2.0
Log(Mass)
Log(N)
Fig. 11. Present-day mass function (MF) of the central cluster of N159W. The solid histogram is the MF computed after correction from field stars using the control field; the dotted histogram shows the MF corrected using the CMD analysis (see text for details). Uncertainties in the mass estimates are shown as horizontal lines above the MF, with the vertical lines in each bin indicating the Poisson uncertainties. Fit to the MFs is shown in red, and is consistent withΓ = −1.05 ± 0.2. The 90% completeness limit is shown by the dashed vertical line.
for the central cluster. If the cluster IMF indeed follows a canon-ical power-law (Kroupa 2001,2002;Kroupa et al. 2013), we can infer that around half of its mass is in the subsolar regime, giving a total mass estimate of ∼1300 M .
The mass of the most massive star in a cluster is generally found to be linked to the total cluster mass (see, e.g.Weidner et al. 2010,2013;Popescu & Hanson 2014), although there are candidates of relatively isolated massive stars which challenge this as a universal relationship (e.g.Bressert et al. 2012). With the earliest-type star in the cluster classified as O5-6, and as-suming it is a dwarf given the young age, at LMC metallicity this is expected to have an initial mass in the range of 37−44 M (Weidner & Vink 2010). Although at the lower end, this is within the expected range of the maximum mass from the simulations ofPopescu & Hanson(2014), i.e. the maximum stellar mass in the N159W cluster appears consistent with the cluster-mass re-lation.
5. Star-formation scenario of the complex
Before investigating star-formation scenarios for the complex, we investigated the dynamics of the compact clumps and central cluster. ATCA observations fromSeale et al. (2012) of HCO+ (J = 1 → 0) and HCN (J = 1 → 0) revealed five significant clumps of gas in the GeMS field: nos. 1, 7, 10, 12 and 15 in their Fig. 3 (with mass estimates in the range of 800−33 000 M ), cor-responding, respectively, to the C3, C5, C1, C2, and C4 compact clumps identified here. The radial velocities for these clumps are in the range of 230−240 km s−1 (Fig. 6 fromSeale et al.), in good agreement with the velocity of ionised gas observed in
the direction of the N159W cluster (Paron et al. 2016), and con-firming that they are dynamically associated.
Seale et al.(2012) hypothesised that the massive clumps are sites of cluster formation, and identified YSOs which appear associated. Our high angular-resolution images reveal that the clumps actually comprise several YSOs, and that young cluster formation is indeed underway at these locations. In contrast, we note that no HCO+ or HCN dense gas was observed bySeale et al. (2012) in the direction of central cluster, indicating that star formation there is at a more advanced stage. Indeed, from the locations of the PMS stars in Fig.8, we argued in Sect.4.1
that the central cluster formed 1−3 Myr ago.
Thus, a possible scenario is that the central O-type stars ionised the region around them which, when expanding, swept-up the ambient gas and dust into a shell (accounting for the low level of 8 µm emission within the bubble). The distribution of the candidate YSOs in close vicinity of the bubble suggests they may have been triggered by its expansion, similar to star forma-tion seen at the edges of several geometrically-simple Galactic bubbles (see, e.g.Deharveng et al. 2010;Ohlendorf et al. 2013;
Samal et al. 2014;Dewangan et al. 2015;Liu et al. 2015). If this is really sequential star-formation in N159W, we would expect the YSOs to be younger than the stars in the main cluster.
Unfortunately, from the current data we have no way to estimate the ages of the embedded YSOs. Nonetheless, we searched for signatures of the early phases of high-mass star formation such as masers (e.g. emission from water masers has a characteristic lifetime of 2.5−4.5 × 10⁴yr;Van Der Walt
2005), UCHII regions (which typically only last for ∼3 × 10⁵yr;
Mottram et al. 2011) and molecular outflows (generally associ-ated with type 0/I YSOs). The presence of outflows in C2 and C5 (Fukui et al. 2015) and UCHII regions in C3 and C5 (Hunt & Whiteoak 1994), suggests star formation that is not older than a few × 105yr.
If true, this favours an age difference between the cen-tral cluster and the YSOs in the peripheral clumps, pointing to sequential star formation. This appears particularly plausible for C1, which has an associated limb-brightened rim in the Ks-band image (highlighted by the yellow arc in Fig. 7), with its apex pointing toward the massive stars at the centre of the cluster. The morphology of this structure resembles those from numeri-cal simulations (Miao et al. 2009;Bisbas et al. 2011) and obser-vations of bright-rimmed clouds (e.g.Sugitani et al. 2002;Ikeda et al. 2008;Panwar et al. 2014). The latter are thought to arise from the impact of UV photons from nearby massive stars on pre-existing dense molecular material (Lefloch & Lazareff 1994;
Miao et al. 2009), leading to the formation of a new generation of stars by radiatively-driven implosion. The morphology of C1 suggests it is strongly influenced by ionising photons from the central cluster, and the presence of candidate YSOs within the clump provides support of a triggered scenario in this instance.
However, it is difficult to conclude such triggering is the only formation process for the YSOs. Star-forming regions often contain smaller cores/clumps with high column-densities, as re-vealed by Herschel observations (Hill et al. 2011;Giannini et al. 2012;Hennemann et al. 2012;Schneider et al. 2012), possibly due to density fluctuations present in the original cloud. Provided the local conditions are close to gravitationally bound, star for-mation can occur in these cores/clumps on a local dynamical timescale. This can result in multiple stellar groups, possibly in different evolutionary stages, in the same complex, i.e. sponta-neous star-formation can also occur close to a HIIregion.
For example, the cluster of YSOs detected in C2 coin-cides with the N159W-S clump in the ALMA observations from
Fukui et al.(2015). As noted earlier, they argued that the clump was formed by the collision of two parsec-scale filaments. If this is the case, then expansion of the HII region is not the prime mechanism in forming the clump, although it may have brought the energy required to initiate star formation in a clump formed via the filament collision. To further complicate things, C2 also sits perfectly on the edge of the (1−2 Myr old) larger-scale bub-ble suggested byJones et al.(2005) andNakajima et al.(2005) to have triggered star formation in N159E and N159W, so its ori-gins are even more ambiguous. The C5 clump appears unrelated to the central cluster in N159W, and may have been triggered by the larger-scale bubble. As in the case of C2, this may have been a pre-existing molecular reservoir in which the pressure from expansion of the large-scale bubble initiated star formation, al-though the current data to not allow firm conclusions.
Lastly, given the age of the central cluster (1−3 Myr) and its location outside of the larger-scale bubble, its formation is probably not connected, providing support of the scenario fromChen et al.(2010) where star formation in N159W started spontaneously (or at least, was not triggered by the larger bubble).
6. Summary
We have presented deep, high angular-resolution, NIR images of the N159W region in the LMC. We have used these to ex-plore the stellar content of the central cluster, as well as the star-formation history of the region. Based on these observations, via construction of colour−colour and colour−magnitude dia-grams, we have identified 104 candidate YSOs in the observed 9000× 9000field (∼22 × 22 pc). These candidates are prominently distributed at the edges of the N159W HII bubble, and are concentrated into clumps and subclusters of stars, which are resolved for the first time by the high angular-resolution of our observations. These groups are associated with active star-formation processes, as highlighted by the presence of UCHII re-gions, outflows, and class 0/I YSOs – each of which are in-dicators of very recent star-formation events, possibly forming massive stars.
In contrast, the stars located inside the HIIbubble appear to be at a more evolved stage, with an average age of 2 ± 1 Myr. The central cluster has two massive O-type stars at its centre, which probably dominate the ionisation of the HII region. From the IMF of the cluster, we estimate its total mass to be ∼1300 M . This cluster may have instigated the star-formation events at its edges, but further observations will be needed to firmly confirm the presence of sequential star-formation in the N159W region.
Acknowledgements. Based on observations obtained at the Gemini Observatory, which is operated by the Association of Universities for Research in Astronomy, Inc., under a cooperative agreement with the NSF on behalf of the Gemini partnership: the National Science Foundation (United States), the National Research Council (Canada), CONICYT (Chile), the Australian Research Council (Australia), Ministério da Ciˆencia, Tecnologia e Inovaç˜ao (Brazil) and Ministerio de Ciencia, Tecnologiaa e Innovación Productiva (Argentine). B. Neichel and A. Bernard acknowledge the financial support from the French ANR program WASABI to carry out this work. H. Plana thanks the CNPq/CAPES for its financial support using the PROCAD project 552236/2011-0. M. R. Samal acknowledges the financial support provided by the French Space Agency (CNES) for his postdoctoral fellowship.
References
Andersen, M., Zinnecker, H., Moneti, A., et al. 2009,ApJ, 707, 1347
Bessell, M. S., & Brett, J. M. 1988,PASP, 100, 1134
Bisbas, T., Wünsch, R., Whitworth, A., Hubber, D., & Walch, S. 2011,ApJ, 736, 142
Bolatto, A. D., Jackson, J. M., Israel, F. P., Zhang, X., & Kim, S. 2000,ApJ, 545, 234
Bonnell, I. A., Bate, M. R., Clarke, C. J., & Pringle, J. E. 2001,MNRAS, 323, 785
Borissova, J., Bonatto, C., Kurtev, R., et al. 2011,A&A, 532, A131
Bressert, E., Bastian, N., Evans, C., et al. 2012,A&A, 542, A49
Carpenter, J. M. 2001,AJ, 121, 2851
Carrasco, E. R., Edwards, M. L., Mcgregor, P. J., et al. 2011, Proc. SPIE, 8447 Caswell, J. L., Haynes, R. F. 1981,MNRAS, 194, 33
Chavarría, L., Allen, L., Brunt, C., et al. 2014,MNRAS, 439, 3719
Chen, C. R., Indebetouw, R., Chu, Y.-H., et al. 2010,ApJ, 721, 1206
Churchwell, E. 2002, in Hot Star Workshop III: The Earliest Phases of Massive Star Birth, ed. P. Crowther,PASP Conf. Ser., 267, 3
Cioni, M.-R., Clementini, G., Girardi, L., et al. 2011,A&A, 527, A116
Clayton. 1985,ApJ, 288, 558
Cohen, R. S., Dame, T. M., Garay, G., et al. 1988,ApJ, 331, L95
Conti, P., & Fitzpatrick, E. L. 1991,ApJ, 373, 100
Da Rio, N., Gouliermis, D., & Henning, T. 2009,ApJ, 696, 528
Davies, R., Ageorges, N., Barl, L., et al. 2010, in Ground-based and Airborne Instrumentation for Astronomy III,Proc. SPIE, 7735, 77352A
De Grijs, R., Wicker, J., & Bono, G. 2014,ApJ, 147, 122
Deharveng, L. 1992,A&A, 265, 504
Deharveng, L., & Zavagno, A. 2011, in Computational Star Formation, eds. J. Alves, B. Elmegreen, J. Girart, & V. Trimble,IAU Symp., 270, 239
Deharveng, L., Schuller, F., Anderson, L. D., et al. 2010,A&A, 523, A6
Dewangan, L., Ojha, D., Grave, J., & Mallick, K. 2015,MNRAS, 446, 2640
Dib, S. 2014,MNRAS, 444, 1957
Dickey, J. M., Mebold, U., Marx, M., et al. 1994,A&A, 289, 357
Diolaiti, E., Bendinelli, O., Bonaccini, D., et al. 2000, StarFinder: A code for stellar field analysis, Astrophysics Source Code Library
Dufour, R., Shields, G., & Talbot Jr., R. 1982,ApJ, 252, 461
Farina, C., Bosch, G. L., Morrell, N. I., et al. 2009,AJ, 138, 510
Fukui, Y., Kawamura, A., Minamidani, T., et al. 2008,ApJS, 178, 56
Fukui, Y., Harada, R., Tokuda, K., et al. 2015,ApJ, 807, L4
Galametz, M., Hony, S., Galliano, F., et al. 2013,MNRAS, 431, 1596
Gatley. 1981,MNRAS, 197, 17
Giannini, T., Elia, D., Lorenzetti, D., et al. 2012,A&A, 539, A156
Gouliermis, D. A., Schmeja, S., Dolphin, A. E., et al. 2012,ApJ, 748, 64
Gutermuth, R., Megeath, S., Pipher, J., et al. 2005,ApJ, 632, 397
Henize, K. G. 1956,ApJS, 2, 315
Hennemann, M., Motte, F., Schneider, N., et al. 2012,A&A, 543, L3
Heydari-Malayeri, M., & Testor, G. 1982,A&A, 111, L11
Hill, T., Motte, F., Didelon, P., et al. 2011,A&A, 533, A94
Hunt, M., & Whiteoak, J. 1994,PASA, 11, 68
Ikeda, H., Sugitani, K., Watanabe, M., et al. 2008,AJ, 135, 2323
Indebetouw, R., Johnson, K. E., & Conti, P. 2004,AJ, 128, 2206
Johansson, L. E. B., Greve, A., Booth, R. S., et al. 1998,A&A, 331, 857
Jones, T. J., Woodward, C. E., Boyer, M. L., Gehrz, R. D., & Polomski, E. 2005,
ApJ, 620, 731
Kerton, C. R., Wolf-Chase, G., Arvidsson, K., Lintott, C. J., & Simpson, R. J. 2015,ApJ, 799, 153
Kroupa, P. 2001,MNRAS, 322, 231
Kroupa, P. 2002,Science, 295, 82
Kroupa, P., Weidner, C., Pflamm-Altenburg, J., et al. 2013, The Stellar and Sub-Stellar Initial Mass Function of Simple and Composite Populations, eds. T. Oswalt, & G. Gilmore, 115
Krumholz, M. 2015, in Very Massive Stars in the Local Universe, ed. J. Vink,
Astrophys. Space Sci. Libr., 412, 43
Kuˇcinskas, A., Dobrovolskas, V., Lazauskait˙e, R., Lindegren, L., & Tanabé, T. 2008,Balt. Astron., 17, 283
Lada, C. J., & Adams, F. 1992,ApJ, 393, 278
Lada, C. J., & Lada, E. A. 2003,ARA&A, 41, 57
Lawrence, A., Warren, S. J., Almaini, O., et al. 2007,MNRAS, 379, 1599
Lefloch, B., & Lazareff, B. 1994,A&A, 289, 559
Lequeux, J. 1989, in Recent Developments of Magellanic Cloud Research, eds. K. de Boer, F. Spite, & G. Stasi´nska, 119
Liu, Q., De Grijs, R., Deng, L. C., et al. 2009a,MNRAS, 396, 1665
Liu, Q., De Grijs, R., Deng, L. C., Hu, Y., & Beaulieu, S. F. 2009b,A&A, 476, 9
Liu, H.-L., Wu, Y., Li, J., et al. 2015,AJ, 798, 30
Luhman, K. 2007,ApJS, 173, 104
Marigo, P., Girardi, L., Bressan, A., et al. 2008,A&A, 482, 883
Martin-Hernandez, N. L., Schaerer, D., & Sauvage, M. 2005,A&A, 429, 449
McGregor, P., Hart, J., Stevanovic, D., et al. 2004, in Ground-based Instrumentation for Astronomy, eds. A. Moorwood, & M. Iye,Proc. SPIE, 5492, 1033
McKee, C., & Tan, J. 2003,ApJ, 585, 850
Meyer, M. R., Calvet, N., & Hillenbrand, L. A. 1997,AJ, 114, 288
Meynadier, F., Heydari-Malayeri, M., Deharveng, L., et al. 2004,A&A, 422, 129
Miao, J., White, G. J., Thompson, M. A., & Nelson, R. P. 2009,ApJ, 692, 382
Minniti, D., Lucas, P., Emerson, J., et al. 2010,New Astron., 15, 433
Mottram, J. C., Hoare, M. G., Davies, B., et al. 2011,ApJ, 730, L33
Munro, D. H. 1995,Comput. Phys., 9, 609
Nakajima, Y., Kato, D., Nagata, T., et al. 2005,AJ, 129, 776
Neichel, B., Vidal, F., Dam, M. A. V., et al. 2014,MNRAS, 1
Neichel, B., Samal, M. R., & Plana, H. 2015,A&A, 576, A110
Ohlendorf, H., Preibisch, T., Gaczkowski, B., et al. 2013,A&A, 552, A14
Ojha, D. K., Samal, M. R., Pandey, A. K., et al. 2011,ApJ, 738, 156
Ott, J., Wong, T., Pineda, J. L., et al. 2008,PASA, 25, 129
Panwar, N., Chen, W., Pandey, A., et al. 2014,MNRAS, 443, 1614
Paron, S., Ortega, M., Fariña, C., et al. 2016,MNRAS, 455, 518
Pavlyuchenkov, Y., Kirsanova, M., & Wiebe, D. 2013,Astron. Rep., 57, 573
Peeters, E., Spoon, H. W. W., & Tielens, A. G. G. M. 2004,ApJ, 613, 986
Piatti, A., Guandalini, R., Ivanov, V., et al. 2014,A&A, 570, A74
Pietrzy´nski, G., Graczyk, D., Gieren, W., et al. 2013,Nature, 495, 76
Popescu, B., & Hanson, M. 2014,ApJ, 780, 27
Rieke, G., & Lebofsky, M. 1985,ApJ, 288, 618
Rigaut, F., Neichel, B., Boccas, M., et al. 2014,MNRAS, 437, 2361
Romita, K., Lada, E., & Cioni, M.-R. 2016,ApJ, 821, 51
Salpeter, E. E. 1955,ApJ, 121, 161
Samal, M. R., Zavagno, A., Deharveng, L., et al. 2014,A&A, 566, A122
Saral, G., Hora, J., Willis, S., et al. 2015,ApJ, 813, 25
Schneider, N., Csengeri, T., Hennemann, M., et al. 2012,A&A, 540, L11
Seale, J., Looney, L., Wong, T., et al. 2012,ApJ, 751, 42
Siess, L., Dufour, E., & Forestini, M. 2000,A&A, 358, 593
Skrutskie, M. F., Cutri, R. M., Stiening, R., et al. 2006,AJ, 131, 1163
Smith, V. 1999, IAU Symp., 190
Sugitani, K., Tamura, M., Nakajima, Y., et al. 2002,ApJ, 565, L25
Tan, J. C., Beltran, M. T., Caselli, P., et al. 2014,Protostars and Planets VI, 149
Testor, G., Lemaire, J. L., Kristensen, L. E., Field, D., & Diana, S. 2006,A&A, 469, 459
Van Der Walt, J. 2005,MNRAS, 360, 153
Weidner, C., & Vink, J. 2010,A&A, 524, A98
Weidner, C., Bonnell, I., & Zinnecker, H. 2010,ApJ, 724, 1503
Weidner, C., Kroupa, P., & Pflamm-Altenburg, J. 2013,MNRAS, 434, 84