DISPARITIES IN NUCLEAR POWER PLANT PERFORMANCE IN THE UNITED STATES AND THE FEDERAL REPUBLIC OF GERMANY
K. F. fansen 0. K. Winje
DISPARITIES IN NUCLEAR POWER PLANT PERFORMANCE
IN THE UNITED STATES AND THE FEDERAL REPUBLIC OF GERMANY
K. F. Hansen
Energy Laboratory and Department of Nuclear Engineering Massachusetts Institute of Technology
D. K. Winje
Energy Laboratory
Massachusetts Institute of Technology and
- - -- -I-~~l',,
-Acknowledgements
This research was sponsored by the Electric Power Research Institute (EPRI) and the MIT Center for Energy Policy Research (CEPR). In addition to financial support, both organizations were helpful in the planning and initiation of the study.
The Institute of Nuclear Power Operations (INPO) was very helpful in obtaining data on the performance of US PWRs. Additional data on BWRs was kindly provided by the General Electric Company. We benefitted greatly from discussions with personnel at the following organizations: Stone and Webster Engineering Corporation, Northeast Utilities Company, Rochester Gas and Electric Corporation, Duquesne Light Company, Commonwealth Edison
Company, and the Westinghouse Electric Corporation. All were generous with their time and in sharing their insights into nuclear plant performance.
In the Federal Republic of Germany and in Switzerland we were assisted in obtaining information about reactor performance as well as informed views of the performance of German reactors. The utilities that assisted included: Bayernwerk AG, Nordwestdeutsche Kraftwerke AG,
Rheinisch-Westfal isches Elektrizitatswerk AG, Nordostschweizerische Kraftwerke. Furthermore we were helped by Gesellschaft fur
Reaktorsicherheit (GRS) and Verband der Grosskraftwerksbetreiber (VGB).
We are parti'cularly grateful for the assistance of Kraftwerk Union (KWU).
-- -"' ~ -- -l u l "l
ABSTRACT
This report presents data comparing the performance of light water reactors in the United States and the Federal Republic of Germany (FRG). The comparisons are made for the years 1980-1983 and include 21
Westinghouse Pressurized Water Reactors (PWRs), 22 General Electric Boiling Water Reactors (BWRs) in the US; and 6 Kraftwerk Union (KWU) PWRs and 4 KWU BWRs in the FRG.
Data on capacity losses are presented in a disaggregated form for scheduled outages, forced outages, and regulatory imposed outages.
Further, within the scheduled and forced outages, the data is subdivided into losses associated with the nuclear island, the balance of plant, or other causes.
The report also surveys a number of observations relating to the causes of discrepancies between the US and West Germany. These
observations were obtained from interviews with executives and engineers in both nations, including people from vendors, utilities, regulators, and architect/engineers. These discussions are distilled into observations
relating to national differences in the broad areas of economics and economic regulation, safety regulations, and technical and managerial differences.
Table of Contents
Page
Acknowledgements i
Abstract ii
1. Introduction 1
2. Background and Institutional Framework 8
2.1 Background and Institutional Framework in the
Federal Republic of Germany 8
2.2 Background and Institutional Framework in the
United States 13
3. Comparative Results 19
3.1 Regulatory Outages 23
3.2 Scheduled Outages - Nuclear Island 23
3.3 Forced Outages - Nuclear Island 2E
3.4 Forced Outages - Balance of Plant 25
3.5 Other Capacity Losses 28,
4. Observations, Conclusions, and Conjectures 29
4.1 Economics and Economic Regulations 29
4.2 Safety Regulation 31
4.3 Technological Differences 33
5. Further Work 36
References 40
Appendix A: Detailed Data Concerning PWR Performance in the US and the FRG on a Year-by-Year Basis Appendix B: BWR Performance Comparisons
__ _III,
1. Introduction
This report presents some results of a short study comparing the capacity factors of nuclear power plants in the United States and the Federal Republic of Germany. The study was designed and initially
limited to comparing the performance of certain Westinghouse Pressurized Water Reactors (PWRs) in the US with the performance of certain Kraftwerk
Union PWRs in West Germany. The scope was later expanded to include some comparisons between the US BWRs and KWU BWRs, which are reported in
Appendix B. The emphasis of the analysis remains focused upon PWR compari sons.
In the early days of nuclear power development it was believed that plants could achieve capacity factors of 80 percent or greater.
Experience in the US has not been as expected, and national average capacity factors have been slightly less than 60 percent. This result has meant that the economic benefits of nuclear power have not been as
great as expected in the United States.
In contrast to the US experience, capacity factors in the Federal Republic of Germany have been close to expectations for Pressurized Water Reactors (PWRs). The average capacity factor for PWRs in the FRG has been near 80 percent for several years. Yet the technology of the US and FRG plants is essentially the same. The obvious question that arises is why such a persistent difference exists. It is this question that this
2
The capacity factor of a nuclear plant may be a function of many factors including: reactor type (BWR or PWR), Nuclear Steam Supply System (NSSS) vendor, Turbine-Generator (TG) vendor, architect/engineer,
constructor, utility operator, age, size, location, and regulatory
climate. We have tried to eliminate some of the variability by restricting the study to a subset of all plants. The criteria used to limit plants were:
-- size greater than 400 MWe
-- in commercial operation by or before 1980
-- the NSSS and TG were provided by the same vendor.
In the FRG there are 5 PWRs and in Switzerland there is 1 PWR that are within the set of interest. These plants are all Kraftwerk Union (KWU) design. The turbine-generators are also of KWU design and manufacture. Table 1 lists the plants included in the study. The PWRs investigated in the US are of Westinghouse design and with Westinghouse
turbine-generators. The set of reactors is listed in Table 2. There are 21 plants included.
There are two commonly used measures of performance: the capacity factor and the availability factor. The capacity factor is the ratio of the net actual electric energy generated in a period to the net electric rating times the period hours. In the FRG the capacity factor is
calculated based on gross generation. The difference between gross and net generation is small, and the ratio of gross to net generation is nearly constant. The different definition only weakly affects the capacity factor
(less than 1 percent). Thus the capacity factor measures the fraction of energy the plant is capable of producing that is actually produced. The
Investigated KWU Reactor Set - PW~
Nuclear Power Plant Type Electric First Cumulated Cumulated Operator Owner Capacity Generation Capacity Availability
(MWe) Factor /41 Factor /5/ until l2/31/8 3
--- ---- --- ---- --- ---- ---- --- ---- ---- ---- --- ---- ---- --- ---- --- ---- ---
----Stade PIJR 662 1. 1972 82.8 % 84.8 % Kernkraftwerk Stade GmbH NUK 66 2/3 %, HEW 133 1/3 %) Biblis A PUR 1204 8. 1974 65.9 % 70.5 % RE
-Neckarwestheim PWR 855 7. 1976 72.5 % 77.4 % Gemeinschaftskraftwerk DB, EVS, Neckarwerke,
Tech-Neckar GmbH nische Werke Stuttgart, ZEAG Biblis B PMR 1300 4. 1976 60.8 % 70.4 5 RME
Unterweser PUR 1300 10. 1978 78.8 % 85.9 5 Kernkraftwerk PreuBen-Elektra (50 5),
Unterweser GmbH NMK (50 %)
Gosgen/Switzerland PWR 970 1979 74.1 % 80.2 % Kernkraftwerk Gbsgen - Aare-Tessin AG for electricity, Daniken AG Nordostschweizerische
Kraft-werke AG and 4 other
Legende References
KWU - Kraftwerk Union /4/ Nuclear Engineering International May 1984, pp 36 - 38
NMK - Nordwestdeutsche Kraftwerke /5/ KWU
HEW - Hamburgische Elektrizitits-Werke
RWE - Rheinisch-MestfAlische Elektrizitatswerke
DB - Deutsche Bundesbahn
Table 2. US Reactor Set
Westinghouse PWR and Westinghouse Turbine Over 3 years full-power operation
Over 400 MW capacity Beaver Valley 1 Farley 1 Ginna Connecticut Yankee Indian Point 2 Indian Point 3 Kewaunee North Anna 1 Point Beach 1 Point Beach 2 Prairie Island 1 Prairie Island 2 Robinson 2 Salem San Onofre Surry 1 Surry 2 Turkey Point 3 Turkey Point 4 Zion 1 Zion 2
(i)
(ii) (iii)5
availability factor is the ratio of the sum of the service hours of the plant plus reserve shutdown hours to the total period hours. Hence the availability factor measures the fraction of the time the plant is available to provide energy.
The causes of lost capacity or availability are many and it is impossible to detail all of them. The objective in this study was to
disaggregate the data in a way that would allow for meaningful
cross-national comparisons. We have been guided by the EPRI-sponsored studies on Nuclear Unit Operating Experience.1,2'3 In particular, we have tried to organize data into losses due to forced outages, scheduled outages, and regulatory imposed outages. Further, within the forced and scheduled outages we have divided the data into losses associated with the nuclear steam supply system, the balance of plant, or other causes. Within selected categories we have occasionally obtained more information. For example, we examined losses in the NSSS in terms of fuel problems, reactor coolant system problems, and steam generator problems. The most detailed information was obtained for PWRs when it was essential to examine
particularly important discrepancies between US and FRG performance.
The data are based upon different sources. Sometimes these sources use different criteria for assigning losses. Inevitably, there are
discrepancies in reported results that imply uncertainties in the results contained here and in other compilations. To the extent that it was possible we have tried to reduce the ambiguities, although not all discrepancies were eliminated.
6-An important aspect of understanding the results of the study concerns the institutional framework in-which nuclear power is produced in the two countries. As a simple example: in the US there is strong competition between nuclear steam supply vendors, architect-engineers, constructors, and turbine-generator suppliers; in the FRG nuclear projects are turnkey projects. The suppliers are KWU or BBR (Brown Boveri Reaktor GmbH). BBR is responsible for the Muilheim-Khrlich plant which is still under
construction. Such institutional factors are important both in
understanding the numerical comparative results, and the causes of these results. For this reason we present a brief discussion of the
institutional framework in the next section of the study.
Section 3 of this report presents a summary of the numerical results obtained for the years 1980-1983.
In Section 4 we review some observations, conclusions, and conjectures about performance differences. We began the study with the hypotheses that differences in performance can be related to regulatory differences, design and construction differences, and operations and maintenance differences.
In order to test these hypotheses we met with executives, engineers, operations staff, and regulators in both the US and the FRG. We asked questions related to the perceptions and understanding of the interviewees concerning the areas of regulation, construction, and operation of nuclear power plants. Ultimately we were able to condense the results of these discussions into observations relating national differences in the broad areas of economics and economic regulation, safety regulations, and technological differences.
7
The final section is a presentation of proposed follow-on work needed to better understand the causes of performance differences, and how to convert the understanding into recommendations.
Appendix A contains detailed data about PWR performance which supplements the material presented in Section 3. Appendix B presents a discussion and data relative to BWR performance in West Germany and the US.
8 2. Background and Institutional Framework
The economics, regulation, and infrastructure of the nuclear
industries in the United States and the Federal Republic of Germany are very different. In order to understand the reasons for certain differences in practice and performance, it is necessary to have some sense of the background and institutional differences between the two countries. In this section of the report we provide a very brief summary of these factors in both countries.
2.1 Background and Institutional Framework in the Federal Republic of Germany
The installed generating capacity in West Germany (including public utilities, industry, and the German Railway) in 1983 was 92,000 MWe, of which 11,700 MWe were nuclear. There are 16 nuclear power stations
operating which produce about 17 percent of the electric energy. Seven of the plants are PWRs, six are BWRs, while the remainder consist of small prototype heavy water, high temperature, and breeder reactors. Eleven more plants are under construction including a high temperature pebble-bed
reactor and a fast breeder prototype. By 1988 the installed nuclear capacity in Germany is expected to reach 20,000 MWe.
Nuclear plants rank third in total capacity for electric generation. Lignite plants provide about 25 percent and coal plants, including combined
plants, 35 percent of the capacity. Both nuclear and lignite plants provide the base-load generation.
9
Of the 92,000 MWe capacity, 76,000 MWe are owned by public utilities,
while the remainder of the capacity is owned by private industry or the German Railway. The public utilities are owned by investors, with the majority of the stock often owned by public authorities such as the State
governments or local governments. Table 3 is a listing of the largest 20 utilities, their ownership, and their involvement in nuclear power.
Only large utilities in Germany own, or share ownership of, nuclear power plants. Those who own or share ownership of at least three plants include:
Rheinsch.-Westf. Elektrizitatswerke AG (RWE) Nordwestdeutsche Kraftwerke AG (NWK)
Bayernwerk AG
Energieversorgung Schwaben AG (EVS)
Hamburgische Elektrizitatswerke AG (HEW) Badenwerk AG.
In general, utilities share ownership of nuclear plants. Only three utilities own nuclear stations outright. Further, there is no utility which has only one nuclear plant. Since most nuclear stations are owned commonly, the German utilities work closely together in the planning and
construction process, as well as in the operation of nuclear plants. Furthermore, the utilities have created and fund an organization
(Technische Vereinigung der Grosskraftwerksbetreiber [VGB]) which manages information exchange between utilities.
10
Table 3 20 Largest Electric Utilities in the Federal Republic of Germany
---No. Utility Owner sales of Nuclear power plants
electricity operating planned or under
in TWh construction
(1982) (1984)
---1 Rheinisch-Westfilische ElektrizitAtswerke AG (RWE) g* 119 3 4
2 Vereinigte ElektrizitAtswerke Westfalen AG (VEW) g* 25,8 - 1
3 Nordwestdeutsche Kraftwerke AG (NWK) g 23,1 4 1
4 Bayernwerk AG o 22,8 3 3
5 Preu3ische Elektrizititswerke AG p 21,5 2 1
6 Veba Kraftwerke Ruhr AG p 17,7 -
-7 Energieversorgung Schwaben AG (EVS) o 13,6 3 2
8 Hamburgische Elektrizittswerke AG (HEW) g* 12,8 3 1
9 STEAG AG p 12,5 -
-10 Badenwerk AG g* 12,3 4 1
11 Berliner Kraft und Licht AG g* 7,6 -
-12 OBAG AG g 7,1 - -13 Schleswag AG 9 6,8 - -14 Isar-Amperwerke AG p 6,7 1 1 15 Lech-Elektrizititswerke AG g 6,5 - -16 EAM AG 9 6,1 -17 Pfalzwerke AG g 6,1 -18 HASTRA AG g 6,0 -19 VSE AG g 5,6 - -20 Neckarwerke AG g 5,6 1 1
Owners: g* majority of stocks owned by government g majority of stocks owned by private investors o stocks owned solely by public authorities
11
The entire Federal Republic is connected together by a high-voltage transmission grid. The German grid is, in turn, connected to the European grid.
Beside general regulations, the German electric utility industry is economically regulated by the States and their price commissions. These commissions are installed by and report to the State Minister of Economics
and are principally concerned with regulating rates to households, small users, and agriculture. Utilities can negotiate separate contracts with large users which are not part of a public process, and for which details are not revealed. Rates must be approved by price commissions and are based upon the actual cost of electricity production, as well as an agreed-upon fair rate of return to the utility. In general, the price commissions are not involved in capital investment decisions of utilities.
Thus, if a utility builds a plant and can demonstrate the costs of electricity from the plant, the price commission will accept the utility
cost figure without second-guessing as to whether the choice of technology was appropriate.
The financing of new plants in West Germany is significantly different from the procedure used in the US. Since the price commissions do not consider the investment costs of new plants, but only the total cost of delivered electricity, the utilities are quite free to choose whatever technology they believe appropriate to produce the cheapest electricity. Further, utilities in West Germany are allowed to earn profits and
accumulate revenues. Frequently, accumulated revenues are used to provide equity for new construction, reducing the debt burden. Also, investments
in construction work in progress (CWIP) are allowed in the rate base. - -- ' I-I I lli lMMYYIIIY II IllY I MMMIIYY IM ll IItI 1 YIII
l
it12
Interest rates and the tax burden are lower than in the US, and
construction times have often been shorter. Thus there is no rate shock accompanying a new plant coming on line. In the FRG utilities make capital investment decisions and technology choices with relatively little impact from their economic regulators.
Safety and environmental regulation is shared by the Federal government (Bund) and the States (Lander). The Federal government has supremacy and delegates rights and responsibilities to the States. In practice, the Federal government establishes general administrative regulations and allows the separate States to create competent licensing and control authorities.
The legal regulations are complemented by technical rules and
guidelines that originate from the Federal Minister of the Interior. The Ministry is assisted in its work by a Reactor Safety Committee
(Reaktorsicherheitskommission, RSK). The Nuclear Technology Committee (Kerntechnischer Ausschuss, KTA) develops technical guidelines. KTA consists of members of all parties involved in the licensing process and thus also includes vendors and operators of nuclear power plants. However,
the actual granting of a license for construction and operation of a nuclear facility is done by the States. The technical review is done by the State Technical Inspection Agency (Technische Uberwachungsvereine, TUV). The TUVs possess a technical staff and the attendant knowledge to review and assess license applications, design, construction work, and operation.
13
The overall licensing and regulation of the nuclear industry in the FRG is similar to that in the US. However, the relationships between the various regulatory agencies, the utilities, and KWU is characterized by a high degree of professionalism. It is not antagonistic, nor is it fraught with political interference.
There exists public opposition to nuclear power in West Germany, lately by Social Democrats and particularly in the so-called "Green
Party". The legal framework for regulation allows for, but has not led to, the degree of intervention that characterizes US regulation.
The managerial and construction policies for nuclear projects are relatively straightforward in West Germany. Primary responsibility rests with KWU or BBR, which act as turnkey contractors. Figure 1 sketches the participants and there relations during construction. The process is characterized by cooperative and professional relationships between participants. Generally the state of design and planning is highly developed before construction begins.
2.2 Background and Institutional Framework in the United States
The electric industry in the United States is highly fragmented. There are about 3,200 utility organizations providing electricity to the public. Most of these are small municipally-owned, or cooperatively-owned, distribution companies. The bulk of the generation is provided by 244 investor-owned, or private, utilities and six large Federal power
Figure 1.
Interaction in the German Nuclear Industry during construction of Nuclear Power Plants
15
generating capacity. The total US capacity is about 615,000 MWe. The stock in the private utilities is freely traded on various stock
exchanges. The State governments do not share in the ownership of the private utilities, as is the case in West Germany.
Economic regulation of utilities, both public and private, is performed by regulatory agencies within the states. These agencies are usually called "Public Utility Commissions" or PUCs, and regulate electric energy, gas, telephones, and other services to the public for which direct competition is uneconomic. Some economic regulation is performed by the Federal Energy Regulatory Commission (FERC), usually for utilities engaged
in interstate commerce.
The character and practices of PUCs vary greatly across the US. In 11 states the members of the commissions are elected by popular vote. In the remaining states commissioners are appointed by the Governor of the state.
Until the early 70's electric energy rates were rarely a controversial issue. The United States had large hydro and fossil resources with which to meet demand at a relatively low cost. Further, continually improving technology kept the real cost of electric energy declining for decades. The diminishing cost of electricity stimulated a sizable demand growth
rate, averaging over 7 percent per year for 30 years. Utility managers were in the fortunate position of a reasonably predictable demand for their
product; an improving technology which kept costs competitive with alternatives; a relatively short time constant to add new capacity; a stable and noncontroversial regulatory environment; and little public concern with utility decisionmaking.
16
All of these conditions changed dramatically in the last decade.
Demand growth rates have behaved very erratically in the last decade; primary fuel costs have increased enormously, particularly fossil fuel costs; lead times to license and build new plants, either coal or nuclear, have grown from 2-5 years to 6-12 years; the regulatory environment has
become highly controversial and unstable; and public interest in utility matters has increased a great deal.
Public utility commissions are under careful scrutiny with regard to their decisions. Such matters as incorporating costs of construction work in progress (CWIP) engenders bitter debates and struggles. Most PUCs in the US will not allow CWIP in the utility rate base - in spite of the
long-run advantage to rate payers. The US system of regulatory law is less restrictive than that of West Germany with regard to allowing interested parties to appeal regulatory decisions. In the US virtually every decision
a regulator makes can be appealed through law courts - leading to more and more delay in decision making. The legal means to delay decisions has been
particularly harmful to the US nuclear industry.
When nuclear plants were first being ordered in the US - the early to mid 60's - there was little trouble with obtaining licenses for
construction and operation. Lead times of 3-4 years were adequate from the decision to buy a plant to on-line service. CWIP was not a big issue to the utilities because the construction time was predictable and short.
Experience with the early plants confirmed the economic advantages of nuclear power over oil and coal - and orders increased rapidly in the late 60's and early 70's. However, public concerns over alleged safety issues
S 17
began to arise at the same time, and intervenors slowly learned how to impact the regulatory process. The safety regulations also became more demanding. The combination of AEC/NRC regulatory actions, and those of intervenors, began to stretch construction times. In addition, evolving regulatory changes frequently led to redesign and rework of plants under construction.
At the time of the Arab oil embargo nuclear plant construction times had grown to 8-10 years. The impact of the resulting price increases was to lower the rate of growth of energy consumption in the US rapidly, and to reduce the electric demand growth rate. Compounding this abrupt change was a rapid increase in interest rates, with a large impact on
capital-intensive nuclear plant costs. The final perturbing event was the accident at Three Mile Island which further stimulated intervention, NRC regulatory changes, and even greater delays in plant construction. The combination of all these events has left the US in a situation where there is great uncertainty in the regulatory process, and hence an unpredictable cost to nuclear plants. The process for decision making is very
open-ended, and NRC decisions are subject to attack by intervenor groups, and by members of Congress opposed to nuclear power. The results of all of these factors have produced a sense of frustration amongst professionals in the field and an antagonistic environment between the utilities and their
A/E and construction partners with the NRC staff.
There has not been a new nuclear plant ordered in the US in eight years. Further, over 100 projects have been cancelled due to a perceived
lack of demand, or excess costs. The cost advantage nuclear power once enjoyed over coal as the lowest-cost, large-size electric supply option is
_~~_I
--18
gone. Today new coal and nuclear electric costs are estimated to be close to the same in most parts of the US. Given the uncertainties with respect to nuclear regulation and costs it is difficult to see another domestic order until stability returns to the process.
The organizational and managerial arrangements used to build plants in the United States has changed over the years. The original nuclear power plants were turnkey projects. As projects moved from demonstration to commercialization, and as the orders for NSSS grew, the practice changed. The most common form of construction used in the US was for the purchasing utility to hire one of the major architect/engineer firms to take over the design and construction management, with the NSSS vendor responsible only
for the nuclear island. A few utilities were capable of serving as their own A/E and constructors. In other cases the utility managed the overall construction, with the NSSS vendor and A/E sharing portions of the plant design. There has not been a turnkey nuclear project in the US since the mid-60's.
The complex management structure for US nuclear plants leads to sizable construction problems. Integration of disparate interests between the NSSS vendor, A/E, constructor and regulator is a very difficult task. Each separate participant has his own task and objective, which are not necessarily consistent with the overall objective of an efficiently operating plant. For example, the objectives of an A/E without
construction supervision are different than they would be otherwise. The problem is even more complex when regulatory changes require redesign and rework. Maintenance of quality control under such circumstances is costly and difficult.
I-1rn00
3. Comparative Results
This section of the report presents the basic capacity factor data for the US and FRG Pressurized Water Reactors. Differences in capacity factors between US and German PWR's are relatively large, on the order of 20
percent. Figure 2 is a plot of the average capacity factor and availabil-ity factor for the 6 KWU reactors and the 21 Westinghouse reactors for the years 1980-1983. The averages are not weighted by unit size. The data is
given in Table 4.
In the FRG capacity factor losses due to outages or failures in
different system categories are not published. Therefore the CF losses are calculated on the basis of information from the annual operating reports.
Here, only load reduction outages which lasted longer than one day are published. Capacity losses which could not be attributed to the different system categories were summarized in "Unassigned Losses".
The specific nature of the differences are presented in Table 5 which presents data of US and FRG capacity losses in terms of forced and
scheduled outages, as well as regulatory imposed outages. The data for each year is given in Appendix A, Tables A.1 through A.4. It should be noted that refueling outage losses are represented under the "scheduled-other" category. The detailed annual data for the Gosgen plant was not available and is not represented in these tables.
The largest differences in performance stem from regulatory outages, scheduled outages involving the nuclear island, forced outages involving the nuclear island, forced outages in the balance of the plant, and other
Capacity/Availabil ity Factor (%) FRG Availability Factors FRG Capacity Factors - - . - - - --- US Availability Factors US Capacity Factors2 1980 Figure 2. 1981 1982 1983 Year
Capacity and Availability Factors for
US PWRs versus KWU PWRs, 1980-1983.
KWU PWRs in FRG plus G8sgen plant
Westinghouse PWRs in the US cf. Table 1 cf. Table 2 100 75 50 25
-
-I I
I
.*,.0.Table 4. Capacity Factors and Availability Factors: US versus FRG PWR results. US FRG Year 1980 1981 1982 1983 Cap. Avail. 56.2 58.6 58.9 59.4 66.2 68.3 67.3 7 Cap. Avail. 67.3 79.7 85.5 78.7 72.77 82.51 88.21 81.2
*The difference,, A, is the US-FRG losses.
11.1
21.1
26.6 19.3
Table 5. US versus FRG PWR capacity losses, Average Values, 1980-1983. US FRG Forced Outages BOP Other 5.15 5.89 2.30 13.34 Scheduled Outages BOP Other 6.79 1.16 12.73 20.68 Regulatory Outages 7.70 Unassigned Losses Total s 41.72
*The difference, a, is the US-FRG losses.
N.B. These results differ from those in Table 4 because that table includes the Gisgen plant while the above data does not.
2.77 3.05 1.34 7.16 2.38 2.84 0.96 6.18 0.80 0.12 14.35 15.25 5.99 1.04 -1.62 5.43 <0.1 7.70 1.44 22.86 -1.44 18.84
- -- - -- ---- - -oIl,
23
forced outages. We discuss each of these items separately, and all the remaining items collectively.
3.1 Regulatory Outages
This category includes safety related outages and accounts for about 40 percent of the total average difference. The US regulatory outages are primarily due to TMI-related backfits. There are negligible safety-related
regulatory losses in the FRG.
3.2 Scheduled Outages - Nuclear Island
Table 6 presents a summary of data comparing averages over the 4 years
1980-1983. Tables A.5 and A.6 display the data for each year separately
for the US and FRG, respectively.
It is clear that the major issue is the steam generator, which accounts for about 80 percent of the US losses. Fuel losses are small. The differences between nations amounts to less than 1/2 percent capacity loss on the average. However, there have been very few fuel failures in the FRG - and no reported losses in capacity due to fuel element
replacement or repair. The loss shown in the table is due to coastdown of the plant. For criticality reasons the plant does not operate at full power, and this loss was attributed to fuel. US losses in the reactor coolant system (RCS) are primarily due to main coolant pump problems, including pump seals. The German data is not disaggregated between the RCS
Table 6. Average capacity losses from scheduled outages involving the nuclear island, 1980-1983.
Fuel RCS Steam Generator Other US 0.80 0.60 5.27 0.12 FRG 0.44 0.22 0.14 A 0.36 5.65 -0.02 6.79 0.80 Total 5.99
E-olill jill w
3.3 Forced Outages - Nuclear Island
Table 7 is a comparison of losses due to forced outages in the nuclear island, averaged over the interval 1980-1983. The US and German data is presented in Tables A.7 and A.8, respectively. It is evident that in the
US problems in the reactor coolant systems lead to forced outage losses
that are, in general, equal to or greater than steam generator losses. The bulk of the steam generator losses can be shifted into scheduled downtime. The German data must be further analyzed to determine a similar division. Fuel losses are rarely the cause of a forced outage while a host of other problems produce losses of about 1 percent per year. These include the reactor trip system, chemical and volume control systems, water cleanup systems, etc.
3.4 Forced Outages - Balance of Plant
Table 8 presents data on the average capacity loss in US and German plants due to forced outages in the balance of plant. Tables A.9 and A.1O present the detailed data. In the FRG almost all losses are due to T/G
problems, which are about 70 percent of those in the US. The remainder of the BOP in Germany rarely forces an outage; conversely, losses due to problems with condensors, condensate and feedwater systems, and instruments and controls represent about half of US losses - and two-thirds of the difference between the two countries.
Table 7. Average capacity losses from forced outages involving the nuclear island, 1980-1983.
US FRG A Fuel 0.07 0.0 0.07 RCS 2.47 2.37 1.72 Steam Generator 1.62 Other 0.99 0.01 0.98 Total 5.15 2.38 2.77
27
Table 8. Average capacity losses from forced outages in the Balance of Plant, 1980-1983.
US FRG A Turbine 1.54 Generator 1.84 0 CW/SW 0.19 0.0 0.19 Other 2.31 0.43 1.88 Total 5.88 2.84 3.04
*Combined Turbine + Generator losses.
28 3.5 Other Capacity Losses
The largest remaining difference is due to forced outages in the other category. These events include economic losses due to low demand and
thermal efficiency losses. The other scheduled losses are due to refueling and, in the FRG, additional scheduled losses due to requirements imposed on
29
4. Observations, Conclusions, and Conjectures
The purpose of this section is to summarize information we obtained, particularly in interviews in the US and West Germany. We present a discussion of this information in terms of economics and economic regulation, safety regulation, and technological differences.
4.1 Economics and Economic Regulations
There are large differences in the economics of nuclear power between West Germany and the United States. There are also large differences in the economic regulation of utilities. In the Federal Republic fuel costs for coal are relatively high. Lignite costs are low, but the cost of transporting lignite is high. Thus lignite plants are only near mines. The cost of capital in Germany is low compared to the US. Current costs
are about 8 percent annually in the FRG as compared to about 15 percent in the US. The combination of the low cost of capital and the high cost of fossil alternatives permits German utilities to make large capital
investments in nuclear plants while remaining competitive. Regulatory differences also favor the German utilities over US utilities. In Germany the regulatory process is relatively stable, which allows for a relatively short and more predictable construction time. However, in the history of nuclear power in the FRG, three different periods can be observed.
Regulation was relatively stable until the mid-70s. Between 1975 and 1980 several plants suffered construction delays due to changing regulation. Since the year 1978, the Nuclear Technology Committee (KTA) and the Reactor Safety Committee (RSK) have established technical guidelines and the
30
in the rate base which lower interest costs to the utility. Finally, income from other plants can be accumulated to provide capital for a new project, thereby lowering debt, and interest costs.
The results of the combination of favorable economic factors and economic regulation is that German utilities can afford to invest heavily
in quality components and workmanship in nuclear plants, as well as in maintenance friendly designs. The advantages of nuclear costs over coal are such that capital invested to increase productivity, i.e. capacity
factor, is economically justifiable.
A prime example of the benefits of greater capital investment is in the working space within the containment building. All of the German utilities emphasized the need for adequate lay-down space, and adequate room to allow for a large work force on-site during refueling. Conversely, US utilities bemoaned the lack of enough space for several service
functions - most particularly steam generators and pipe restraints. The numerical data suggests that refueling takes the same amount of time in the two nations - yet the total duration of scheduled outage in the FRG was about 60 percent that of US scheduled outage duration. We conjecture that US outages could be shortened with easier access to equipment in need of service.
The situation in the United States is strikingly different. Nuclear power plants have a narrow cost advantage over coal plants, and can remain economic only if nuclear plant capital costs are kept low. However the high cost of money in the US and the unstable regulatory climate are antithetic to low capital costs.
The impact of US economic regulation is also antithetic to
high-reliability power plants. First, the regulation tends to emphasize low capital cost - hence lower initial investment in maintenance friendly designs. Further, the economic regulation sometimes emphasizes low cost maintenance programs. Finally, the economic regulation provides little
incentive for improving performance. Several US utilities mentioned that any improvements in capacity are passed directly to the rate payer - and not to the stockholders. Conversely, PUCs tend to penalize stockholders for poor system performance, so as not to increase rates to consumers.
A final matter that is different between the two nations has to do with the cost of alternate sources of energy. In Germany nuclear power is very much less than fossil alternatives. Hence the motive for extracting every kWh out of a nuclear plant is great. Conversely, in the US there are many utilities with excess capacity at present. For these utilities there
is no market for some of their capacity. For other utilities the cost differences between nuclear and alternatives are small. Thus, the overall motive for achieving a high capacity factor is diluted.
4.2 Safety Regulation
The safety regulations in the two countries are not very different, as represented in the laws. However, the way in which the law is applied in the two countries is very different. Thus, in the US many regulatory changes are imposed which mandate backfits to existing plants and which have led to large capacity losses. The TMI-related backfits led to outage losses of about 5 percent/year for three years for the US PWR's. The data in Table 5 shows that for the years 1980-1983 nearly 8 percent of PWR
32
capacity was lost due to regulatory imposed outages. There is evidence that suggests the actual losses were even greater. This is due to the fact that regulatory imposed changes were conducted during a scheduled outage, and may be recorded as something other than regulatory. (In fact, one of the suggestions we have for future work is to look more closely at the US and FRG data base to obtain more accurate estimates of regulatory actions on plant performance.)
In Germany the impact of backfitting (due to the TMI accident and changing guidelines concerning earthquakes or airplane accidents, for example) was lower than in the US. Furthermore backfitting was often done during scheduled outages for refueling and maintenance and thus is hidden and not reported separately.
Another difference between the two nations has to do with design changes during construction. Many US observers remarked on the frequency of regulatory changes imposed after a construction permit was granted and construction started. Such changes are very disruptive to construction, causing delay and rework that is expensive, prolonged, and quite possibly antithetic to high quality workmanship. Such regulatory changes occur in Germany also, but not to the extent they do in the US. Paradoxically, the larger spaces typical of German plants make accommodation to change easier than it is in the US.
A final impact of safety regulation that is different between Germany and the US is that of technological advance. Improvements in knowledge, understanding, and technology are readily incorporated into reactors in the
FRG. Conversely, the US industry is prone to avoid certain changes for improved design if these changes might reopen the regulatory process.
4.3 Technological Differences
In principle the German plant designs stem from US designs, and
differences should be small. However, differing economic environments and differing regulatory environments have led to important differences between the two countries. We list a number of these below.
One of the most frequently cited differences has to do with the
uniqueness of US plants, as compared to German plants. In the FRG the NSSS vendor, A/E, and constructor are the same, while in the US there are many competing firms for each area. US utilities with more than one plant frequently change vendors with each succeeding plant, creating major differences even within the same utilities. Examples of these design differences are found in both the PWRs and BWRs. The German PWRs are all 4-loop plants, except for one 3-loop plant. In the US PWR data set there are six 2-loop plants, nine 3-loop plants, and six 4-loop plants.
Similarly, for the BWRs there are 2 BWR-2 units, 7 BWR-3 units, and 13 BWR-4 units.
Another important technical difference is in the timing of design and construction. The German practice is to complete the general design of both the NSSS and BOP before construction begins. Some utilities, however, would prefer totally completed design before the beginning of construction to accelerate the construction process. The practice in the US is to carry on design while construction is underway. There are arguments for and
34
against each mode of approach. Another of our proposed follow-on studies deals with investigating the reality and impact of these different
approaches on actual performance.
There exists a perception amongst German nuclear engineers that the QA/QC programs in the FRG are much more stringent than those in the US. Further, it is believed that the German reactor performance is directly
related to the strict quality control used in construction and operation. We were unable to pursue a direct comparison of QA/QC programs in the time available, but suggest this topic for further study in Section 5 of the report.
We have mentioned earlier the fact that plants in the FRG are designed to have greater space available for service and maintenance functions. There is a related perception that utilities in West Germany do much more thorough and intensive planning for outages than US utilities. Our own interviews tend to confirm this perception.
The degree of technical cooperation between German nuclear engineers from utilities, KWU, and regulators appears to be greater than in the US. This cooperation is reflected, for example, in the speedy response to an event causing a forced outage, where KWU technical staff and the utility staff work together. Another example of across-the-board cooperation is in the area of availabilty improvement - where the regulators are open to concerns with the impact of safety regulation upon plant availability. As
a final example, KWU is working with utilities to develop maintenance records on major components and their behavior. (This practice is also beginning to occur in the US between utilities and vendors.)
35
The German utilities with nuclear plants all have very large technical staffs, both at the plants and in headquarters. There is a deep
understanding of nuclear design, construction, and operation throughout the utilities. This expertise is shared with KWU in the improvement of
technology. For instance, fuel element design evolved from collaborative KWU/utility programs. Further, the Convoy system is the result of
large-scale utility/KWU cooperation.
The last case of technological differences concerns the initial
start-up and operation of the plants. There are a variety of procedures in the US. Some utilities take full responsibility for start-up and testing. Others phase in their control during start-up. Others take over after full-power operation for several days has been achieved. In Germany KWU is
responsible for start-up, and operates plants at full power for several months before turnover to the utility. Further, KWU liability extends for
two years after start-up.
5. Further Work
This project has had two objectives: the first to quantify
performance differences between US and West German reactors, and the second to see if the differences can be related to regulatory, construction, and operational policy differences. The results of Section 3 provide a quantification which addresses the first objective of the project. The discussion in Section 4 examines the potential causes of these
differences. The results in Section 4 are anecdotal and consist primarily of observation, opinions, and perceptions of knowledgeable people.
Nevertheless, the results suggest that there are cross-national differences that are relevant to the observed performance differences. We now turn to what further work is necessary to confirm the role of policy differences in explaining the observed performance differences.
The first matter deserving more careful study is that of the real impact of regulation on US and German reactor performance. Our data shows that this is the single largest difference between US and German reactor capacity factors. The existing data is probably a lower bound on the actual impact of regulation. As we mentioned earlier, there is a
reasonable expectation that some of the scheduled outage time in the US and the FRG is used to perform regulatory required modifications which extend the outage duration, and are not recorded as regulatory imposed outages. We believe a careful study of the outage records for US and FRG PWRs should be undertaken to more accurately identify the true impact of regulations on performance. With more complete data the next step is to identify the leading regulatory requirements that produce the capacity loss. We then propose to examine why these matters do not produce similar losses in the
37
FRG. Presumably there are several potential explanations including such ideas as the problem being anticipated and designs already reflecting adequate safety; the German regulators viewing the problem as less
important than US regulators; or other reasons. In any event the goal is to identify differences in regulatory policy that impact achieved
perfomance.
The second most important cause of differences is the high forced outage rate in the US. There needs to be a closer examination of the detailed causes of forced outages. Such an examination must be followed with an analysis of whether or not quality assurance/quality control
program improvements could have reduced or avoided the outage.
Furthermore, the ability to affect repairs promptly relates to issues of service and maintenance records, inventory policies, and to the available space in the system to perform service functions.
Another interesting problem has to do with the relationship between the capital cost of a plant and the productivity of the plant. We argued earlier that German plants are more voluminous than US plants. It is believed that a higher initial investment makes service and maintenance easier. Such a conjecture is subject to further analysis. For example, a comparison in volumes and layout is straightforward. How the space is used
during an annual refueling is also easily examined. Detailed comparisons on time required to perform selected functions can be compared, and related
to space available. It should be possible to obtain a first-order estimate of the outage time lost due to inadequate initial investment in space
and/or auxiliary facilities. The economic impact of the capacity lost can be related back to added capital cost to reduce the outage time. The
38
result should be an estimate of whether or not it makes sense for US
utilities to make additional investments to improve plant capacity factors.
A fourth topic, closely allied to the above, has to do with a further
examination of the relationship between preparation for an outage, and the performance achieved in completing the outage. The first part of the work involves examining the planning and the details of outage preparation at several plants in the US and the FRG. This would be followed by examining the actual outage and how well work was performed. Similar tasks would then be reviewed to see how productive the work force was, and to what extent initial preparations improved the productivity. Particular emphasis would be given to reviewing how the organization responded to expected and
unexpected events - for example, finding an unsuspected failed component. The result of the analysis should be a greater understanding of what tasks can be made shorter by advanced preparation, and by how much.
A fifth area proposed for further study is the design and construction
process. Engineers that we interviewed felt that US nuclear construction usually began before design was finished, and that design changes, from whatever cause, led to construction delays and compromises with quality
that later impacted plant performance. Conversely, it was argued that design was completed in German plants prior to construction, so that conflicts between costs, quality, operations, and serviceability were
analyzed and settled before construction began. It is not clear at present whether these perceptions of the process are correct - hence the first task is to examine in some detail the history of construction of plants in both countries. This should be followed with a detailed analysis of actual
39
whether or not capacity losses can be related back to the design/
construction phase of the plants and, if so, how they relate. This is clearly a difficult task, and the cause-effect relationship is indirect at
best. Nevertheless, we believe the problem is important and merits an attempt at understanding.
As a final topic for further study we believe it would be useful to begin the preparation of an international data base on reactor
perfomance. The US data base is relatively well developed and could serve as a model for collecting data from other nations. We found in this study that the US data was more complete than the FRG data.
REFERENCES
1. Koppe, R. H. and E. A. J. Olson. "Nuclear and Large Fossil Unit
Operating Experience," EPRI report NP-1191, September 1979.
2. Olson, E. A. J. "Nuclear Unit Operating Experience--1978 and 1979 Update," EPRI report NP-2092, October 1981.
3. Koppe, R. H., E. A. J. Olson, and D. W. LeShay. "Nuclear Unit
Operating Experience: 1980 Through 1982 Update," EPRI report NP-3480, April 1984.
4. Howles, L. R. "Nuclear Station Achievement 1983," Nuclear Engineering International, May 1984, pp. 36-38.
5. KWU, performance data, unpublished.
6. Committee for the Interchange of Performance Experience
(ABE-Ausschuss). "Betriebsergebnisse der deutschen Kernkraftwerke
1980." Atomwirtschaft August/September 1981, pp. 509-519.
7. ABE-Ausschuss. "Betriebsergebnisse der deutschen KernKraftwerke 1981." Atomwirtschaft August/September 1982, pp. 468-479.
8. ABE-Ausschuss. "Betriebsergebnisse der deutschen Kernkraftwerke 1982." Atomwirtschaft July/August 1983, pp. 408-419.
9. ABE-Ausschuss. "Betriebserfahrungen mit Kernkraftanlagen in der
Bundesrepublik Deutschland: 1983 report of ABE-Ausschuss." VGB Kraftwerkstechnik (64), May 1984, pp. 382-418.
APPENDIX A
Detailed Data Concerning PWR Performance in the US and the FRG
on a Year-by-Year Basis
Table A.1. US versus FRG PWR capacity losses -US FRG Forced Outages BOP Other 3.58 4.64 2.23 10.45 6.98 0.93 1.92 9.83 -3.40 3.71 0.31 Scheduled Outages BOP Other 7.23 2.51' 12.83 22.57 1.13 0.30 19.99 21.42 6.10 2.21 -7.16 1.15 Regulatory Outages 10.74 Unassigned Losses Total s 43.76
*The difference, a, is the US-FRG losses.
A-2 0.62 0.0 10.74 -2.81 2.81 34.06 9.70 1980.
-- ---- ~-~~ I I , ,~11
Table A.2. US versus FRG PWR capacity losses - 1981.
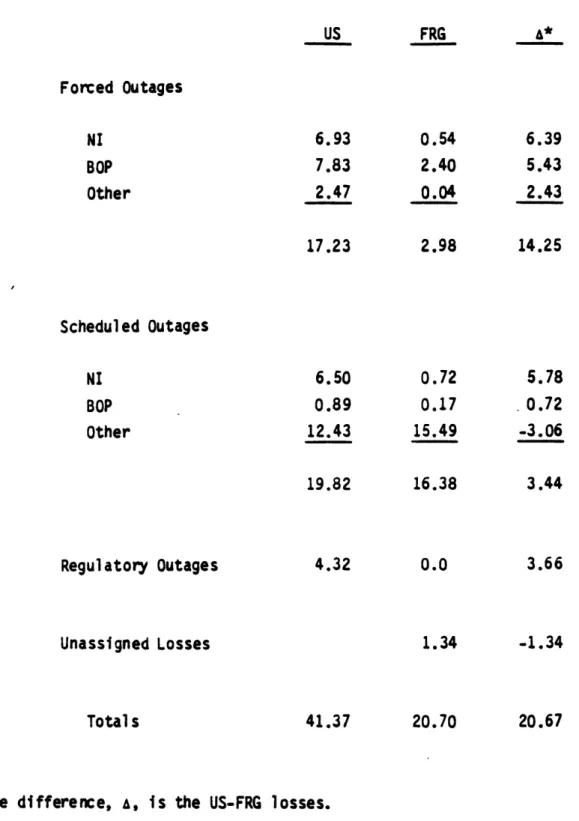
US Forced Outages NI BOP Other Scheduled Outages NI BOP Other Regulatory Outages 6.93 7.83 2.47 17.23 6.50 0.89 12.43 19.82 4.32 Unassigned Losses Total s 41.37 FRG 0.54 2.40 0.04 2.98 0.72 0.17 15.49 16.38 0.0 1.34 20.70
*The difference, A, is the US-FRG losses.
A-3 6.39 5.43 2.43 14.25 5.78 0.72 -3.06 3.44 3.66 -1.34 20.67
Table A.3. US versus FRG PWR capacity losses - 1982. US Forced Outages NI BOP Other Scheduled Outages NI BOP Other Regulatory Outages 7.57 5.59 2.07 15.23 6.60 0.33 12.43 19.36 6.48 Unassigned Losses Total s 41.07
*The difference, a, is the US-FRG losses.
A-4 FRG 0.25 0.25 1.15 1.65 7.32 5.34 0.92 13.58 0.24 0.02 11.18 11.44 6.36 0.31 1.25 7.92 6.48 -0.91 27.07 0.0 0.91 14.00
Table A.4. US versus FRG PWR capacity losses - 1983. US Forced Outages NI BOP Other Scheduled Outages NI BOP Other Regulatory Outages 2.53 5.49 2.41 10.43 6.80 0.92 13.23 20.95 9.24 Unassigned Losses Total s 40.62
*The difference, &, is the US-FRG losses.
A-5 FRG 1.75 7.75 0.72 10.22 0.78 -2.26 1.69 0.27 1.04 0.0 10.73 11.77 0.0 5.76 0.92 2.50 9.18 9.24 0.71 22.70 -0.71 17.92 wi lw - u m Il
Table A.5. Capacity losses from scheduled outages involving the nuclear island for US PWRs, 1980-1983.
1980 1981 1982 1983 Fuel 0.93 0.73 0.34 1.21 RCS 0.41 0.42 0.14 1.41 Steam Generator 5.86 5.30 5.92 4.01 Other 0.03 0.06 0.20 0.17 Total 7.23 6.50 6.60 6.80 A-6
Capacity losses from scheduled outages involving the nuclear island for German PWRs, 1980-1983.
1980 1981 1982 Fuel 0.31 0.22 0.24 RCS RCS 0.36 0.50 0.0 Steam Generator Other 0.46 0.0 0.0 Total 1.13 0.72 0.24 A-7 1983 1.0 0.02 0.02 1.04 __ _ ~ _I 1 ', A lN IUI Table A.6.
Table A.7. Capacity losses from forced outages involving the nuclear island for US PWRs, 1980-1983.
Fuel RCS Steam Generator Other Total 1980 0.04 1.59 1.13 0.81 3.58 1981 0.06 3.57 1.60 1.70 6.93 1982 0.07 4.00 2.66 0.85 7.57 1983 0.10 0.73 1.09 0.61 2.53 A-8
Table A.8. Capacity losses from forced outages involving the nuclear island for German PWRs, 1980-1983.
1980 Fuel RCS Steam Generator Other Total 0.0 6.96 0.02 6.98 1981 0.0 0.54 0.0 0.54 1982 0.0 0.24 0.01 0.25 1983 0.0 1.75 0.0 1.75 A-9
Table A.9. Capacity losses from forced outages involving the Balance of Plant for US PWRs, 1980-1983.
1980 1981 1982 1983 Turbine 1.45 2.35 1.63 0.74 Generator 0.18 2.50 1.12 3.54 CW/SW 0.41 0.06 0.03 0.26 Other 2.59 2.92 2.80 0.94 Total 4.64 7.83 5.59 5.49 A-10
Table A.10. Capacity losses from forced outages involving the balance of plant for German PWRs, 1980-1983.
1980 1981 1982 1983 Turbine 0.05 1.97 0.0 7.62 Generator CW/SW 0.0 0.0 0.0 0.0 Other 0.88 0.43 0.25 0.13 Total 0.93 2.40 0.25 7.75 A-11
APPENDIX B
BWR Performance Comparisons
This appendix provides data comparing the performance of US and West German BWRs. The set of US reactors used is given in Table B.1 and the German reactors are given in Table B.2. The information is in the appendix because the data was assembled well after the start of the project and there has been no time for discussion with BWR owners, particularly in the US.
Performance comparisons are very hard to make in the BWR case because of the small German data base. In addition there is a very large variance in performance for the FRG reactors, which makes statistical comparisons difficult. The performance is dominated by a few events, most particularly the primary piping replacement. Each reactor lost nearly a reactor-year of operation.
There was also a power reduction of 20 percent at one plant for one year due to new guidelines for the ECCS, and auxiliary systems. This
single reduction translates into a 5 percent/year loss for the set of German BWRs.
In the data presented in Tables B.3 through B.8 we have attempted to separate out the impact of the pipe replacement backfitting. The German backfitting accounts for an average loss of 28 percent capacity for the
four years 1980-1983. The remaining losses are disaggregated in the same manner as the PWR losses. The category of unassigned losses represents losses for which we cannot extract causes from the available data base.
It is difficult to draw firm conclusions from the comparative data. If one ignores the backfitting, then it could be argued that German performance is significantly better than in the US. However, the
backfitting losses shift the balance entirely. This can be countered with the observation that some US BWRs are also undergoing primary piping
replacement and these will drastically affect performance.
There appear to be two consistent trends between US and German LWR
performance: the forced outage rate in the FRG appears to be lower than in the US, and scheduled outages appear to take less time. This is clearly true in the PWR data and seems to be true in the BWRs if one ignores backfitting. However, we believe much more analysis is necessary before firm conclusions can be reached.
Table B.1. US BWR Reactor Plants for which Data Is Provided Millstone Pt. 1 Pilgrim 1 Vermont Yankee Nine Mile Pt. 1 Fitzpatrick 1 Oyster Creek 1 Peach Bottom 2 Peach Bottom 2 Monticello Dresden 2 Dresden 3 Quad Cities 1 Quad Cities 2 Duane Arnold Cooper 1 Browns Ferry 1 Browns Ferry 2 Browns Ferry 3 Brunswick 1 Brunswick 2 Hatch 1 Hatch 2 B-3
Investigated KWU Reactor Set - BWA
---Nuclear Power Plant Type Electric First Cumulated Cumulated Operator Owner Capacity Generation Capacity Availability
(MWe) Factor /4/ Factor
---Wirgassen BWR 670 12. 1971 36.6 % - PreuBische Elektrizi-tits AG (PreuBenelektra)
Brunsbuttel BWR 806 7. 1976 34.8 % - Kernkraftwerk Bruns- HEW (66 2/3 %),
buttel GmbH NWK (33 1/3 %) I Isar BWR 907 12. 1977 53.4 % - Kernkraftwerk Isar GmbH Bayernwerk AG (50 %),
4: Isar-Amperwerke AG (50 %)
Philippsburg 8WR 900 5. 1979 42.8 % - Kernkraftwerk Philipps- Badenwerk AG (50 %),
burg GmbH EVS (50 %)
---Legende Reference .
KWU = Kraftwerk Union /4/ Nuclear Engineering International May 1984, pFl 36 - 38
NWK = Nordwestdeutsche Kraftwerke HEW = Hamburgische Elektrizitats-Werke
RWE = Rheinisch-Westfalische Elektrizitatswerke
DB = Deutsche Bundesbahn
Table B.3. Annual Capacity Factor of US versus FRG BWRs Year 1980 1981 1982 1983 US 60.3 59.1 59.3 54.8 58.4 FRG 39.2 50.0 39.6 56.5 46.3
*The difference, a, is the US-FRG capacity losses.
B-5 A* -21.1 - 9.1 -19.7 1.7 -12.1
Table B.4. US versus FRG BWR losses, Average Values, 1980-1983. Forced Outages NI BOP Other Scheduled Outages NI BOP Other Regulatory Outages Unassigned Losses Backfitting Total US 7.9 5.1 1.3 14.3 2.7 1.1 21.3 25.1 FRG 1.95 1.74 4.31 8.00 2.52 3.71 8.10 11.33 5.20 2.0 1.37 27.79 53.69 41.4 8-6
Table B.5. US versus FRG BWR losses - 1980. Forced Outages NI BOP Other Scheduled Outages NI BOP Other Regulatory Outages Unassigned Losses Backfitting Total US 8.8 4.6 1.3 14.7 2.3 1.1 20.6 24.0 FRG 1.76 2.70 16.18 20.64 4.31 2.42 7.60 14.33 6.50 1.0 3.97 15.36 39.7 60.80 B-7
Table 8.6. US versus FRG BWR losses - 1981. US FRG Forced Outages NI BOP Other 7.3 6.5 1.5 15.3 2.8 0.3 0.3 3.4 Scheduled Outages NI BOP Other Regulatory Outages Unassigned Losses Backfittl ng Total 1.6 1.1 19.5 23.5 2.0 4.1 1.0 8.8 13.9 10.1 -2.7 25.3 50.0 40.9 B-8
Table 8.7. US versus FRG BWR losses - 1982. US FRG Forced Outages NI BOP Other 9.8 5.1 2.3 17.2 2.3 1.2 0.7 4.2 Scheduled Outages NI BOP Other Regulatory Outages Unassigned Losses Backfitti ng Total 2.9 0.9 15.6 19.4 0.7 0.1 11.7 12.5 4.3 4.1 -1.9 37.5 40.7 60.4 B-9