THE EFFECT OF IMPROVED AIRCRAFT EFFICIENCY ON HELICOPTER SALES USING SYSTEM DYNAMICS
by
STEVEN DAVID WEINER
M.S. Mechanical Engineering, University of Bridgeport (1983)
B.S. Aeronautical Engineering, Rensselaer Polytechnic Institute (1978)
SUBMITTED TO THE SYSTEM DESIGN AND MANAGEMENT PROGRAM IN PARTIAL FULFILLMENT OF THE REQUIREMENTS
FOR THE DEGREE OF
MASTER OF SCIENCE IN ENGINEERING AND MANAGEMENT at the
MASSACHUSETTS INSTITUTE OF TECHNOLOGY February 2000
0 Massachusetts Institute of Technology, 2000 All rights reserved
Signature of Author
Certified by
System Design and Management December 6, 1999
Dr. James H. Hines Professor of System Dynamics Thesis Supervisor
Accepted by
Dr. Thomas A. Kochan LFM/SDM Co-director George M. Bunker Professor of Management
Accepted bv
Dr. Paul A. Lagace LFM/SDM Co-director Professor of Aeronautics & Astronautics and Engineering Systems
MASS CHUSE TTS INSTITUTE OF TECHNOLOGY
The Effect of Improved Aircraft Efficiency On Helicopter Sales Using System Dynamics Modeling
by
Steven David Weiner
Submitted to the System Design and Management Program On December 6,1999 In Partial Fulfillment of the Requirements for the Degree of Master of Science in
Engineering and Management.
ABSTRACT
As the helicopter industry has tried to reinvent itself after the Cold War, it has become apparent that the traditional competitive discriminators used for successful military products do not apply directly to the emerging markets. Improvements in aircraft efficiency, typically represented by payload-range capability, can still provide a competitive advantage, but these improvements can also be tempered by commercial government regulations intended to improve attributes other than aerodynamic performance capability. These regulations have the potential to severely impact the sales of current and future commercial helicopters and other rotorcraft.
This study uses System Dynamics modeling to investigate the effect of improved aircraft
efficiency on sales. Interviews provided clarification regarding the client's fears, and also provided the variables to be investigated, along with reference modes and momentum policies. This information generated three hypotheses as to the possible system behavior. A Vensim System Dynamics model was created to explore these hypotheses.
The model uses separate modules for R&D development and efficiency improvements, workforce makeup, workforce location, regulation imposition, competitive advantage, technological risk and information quality. Three specific types of potential government regulations are modeled to investigate the effect of these policy changes on the basic sales model, and to determine if technology improvements can provide a means of modulating the sales impact. The three regulation areas explored are exhaust gas emissions reductions, external noise reductions, and fuel economy improvements.
The model implementation used lookup tables wherever possible to enable adjustments for platform type and size, workforce makeup, regulation severity, and in general to provide flexibility to accommodate changing technological, market and client company conditions.
An 8 year time period was investigated using the Systems Dynamics model. Parameter variations were compared to determine those with the greatest effectiveness on unit sales. Several
projections of behavioral response were then produced for differences in structure due to regulation imposition. Aircraft efficiency improvements alone were not sufficient to prevent sales degradation within the time period of interest. However, using the sales sensitivities to other
parameters, a structure change recommendation for the client company was determined that was effective in maintaining sales. The recommended structure changes included development of technology improvements to aircraft efficiency, workforce process changes and increased
lobbying activities. These changes could be easily implemented by the client company in the near term.
Thesis Advisor: Dr. James H. Hines Professor of System Dynamics
TABLE OF CONTENTS
Page Abstract 2 List of Figures 5 List of Tables 8 Acknowledgments 9 1.0 Summary 10 2.0 Background 10 2.1 Infrastructure 11 2.2 Noise Concerns 11 2.3 Safety Concerns 12 2.4 Costs 13 2.5 Surplus Rotorcraft 14 2.6 Commuter Aircraft 142.7 Insurance and Liability 15
2.8 Research Trends 15 2.9 Regulations 17 3.0 Model Description 21 4.0 Sensitivity Studies 36 5.0 Sensitivities to Regulations 46 5.1 Acoustic Regulations 48
5.2 Exhaust Gas Emission Control Regulations 51
5.3 Fuel Economy Regulations 54
5.4 Impact of Combined Regulations 57
6.0 Additional Insights and Recommendations 58
7.0 Conclusions 62
8.0 References 63
LIST OF FIGURES
Page
1. Rotorcraft Sales Projections 11
2. Rotorcraft Price vs. CPI Trends 14
3. Efficiency Comparison: Commuter Aircraft vs. Rotorcraft 15
4. Sample Payload Range Curve 16
5. Historical Payload Range Trend 16
6. Aircraft Weight - Cost Correlation 17
7. Problem Statement 22
8. Sales Model Variable List 23
9. Reference Modes for Sales Model 23
10. Momentum Policies for Sales Model 25
11. Hypothesis 1 Causal Loop 26
12. Hypothesis 2 Causal Loop 27
13. Hypothesis 3 Causal Loop 28
14. Technology Improvement Section 29
15. Regulation Section 30
16. Attractiveness/Market Share Section 30
17. Revenue Generation/Unit Sales Section 31
18. Hypothesis 1 Schematic 31
19. Technical Risk Section 32
20. Hypothesis 1 + Hypothesis 2 Schematic 32
21. Workforce Aging Chain Section 33
22. Competitive Information Generation Section 34
23. Competitive Advantage Calculation 34
24. Complete Sales/Efficiency Model Schematic 35
25. Sensitivity of Actual Payload Range to Changes in 36 The Technology Impact on Payload Range
LIST OF FIGURES, continued
Page 26. Sensitivity of Actual Weight to Changes in The Technology Impact on Weight 36 27. Sensitivity of Actual Cost to Changes in The Technology Impact on Cost 36 28. Sensitivity of Sales to Changes in Actual Payload Range 37
29. Sensitivity of Sales to Changes in Actual Weight 37
30. Sensitivity of Sales to Changes in Actual Weight 37
31. Sensitivity of Productivity to Changes in Workforce 38 32. Sensitivity of Payload Range to Changes in Workforce 38
33. Sensitivity of Sales to Changes in Workforce 38
34. Impacts of Rate Variations of Workforce Aging on Sales 39 35. Impacts of Rate Variations of Retirement Rate on Sales 39 36. Impact of Payload Range Risk Adjustment Factor Variations on Sales 40 37. Sensitivity of Sales to Changes in Time Window Duration 40 38. Sensitivity of Sales to Changes in Co-location Factor 41 39. Sensitivity of Sales to Changes in Co-location Factor, Information 41
Generation Factor, and General Information Collected
40. Sensitivity of Sales to Variations in Time for Information Quality and 42 Time for Obsolescence
41. Sensitivity of Sales to Correct Information Function Variations 42 42. Impact of Variations of Fraction of Revenues on Sales 43 43. Sensitivity of Sales to Changes in Technology Improvements Well 43 44. Sensitivity of Sales to Technology Improvements Available 43 45. Sensitivity of Implemented Regulations to Variations in Money Available 44
for Technology Improvements
46. Sensitivity of Payload Range to Changes in Implemented Regulations 45 47. Sensitivity of Weight to Changes in Implemented Regulations 45 48. Sensitivity of Cost to Changes in Implemented Regulations 45 49. Impact of Changes in Regulation Research Results on Sales 46
LIST OF FIGURES, continued
Page
50. Public Impact Parameters' Influence on Sales 46
51. Sensitivity of Sales to Lobbying Impact on New Regulations 47 52. Sensitivity of Sales to Changes in Lobbying Parameters 48
53. Sensitivity of Sales to Public Impact Parameters 48
54. Acoustic Regulations Impact on Sales 50
55. Exhaust Emissions Regulations Impact on Sales 53
56. Fuel Economy Regulations Impact on Sales 56
57. Regulation Combination Sensitivities 57
LIST OF TABLES
Page 1. Potential Rotorcraft Acoustic Regulation Options and Engineering Solutions 18 2. Potential Rotorcraft Exhaust Gas Emissions Regulation Options 19
and Engineering Solutions
3. Potential Rotorcraft Fuel Economy Regulation Options and 20 Engineering Solutions
ACKNOWLEDGMENTS
The author would like to acknowledge several individuals who made significant contributions to this project. Professor Jim Hines provided valuable insight and support during this project and during two previous courses in Systems Dynamics. His knowledge, experience and teaching style guided the author in this investigation, and provided a new viewpoint when looking at social structures.
Ventanna Systems and the Vensim simulation program provided the means for the creation of the model. This tool is user friendly, and more importantly, intuitive. It provides a welcome
improvement from previous dynamic modeling programs such as Dynamo.
George Sipprell, the Weapon System Integration Manager at Sikorsky Aircraft, is the author's immediate supervisor, and eliminated all anxiety with respect to job performance for the duration of the author's education experience. This support allowed completion of this report, and he has suggested venues for disseminating the results within the client company.
Dr. Ken Rosen, VP of Engineering at Sikorsky Aircraft approved the author's attendance in the System Design and Management Program, and provided suggestions during the original formulation of the thesis topic investigated here.
The SDM program at MIT provided the means for the author's graduate studies in both engineering and management. The SDM directors and staff have created and maintained an interdisciplinary program with obvious skill, always striving to incorporate students' concerns in a timely manner.
Phil LeMasurier of Sikorsky Aircraft provided invaluable assistance regarding the nuances of helicopter external acoustics. Phil is the top helicopter acoustician in the country, and was able to interpret seemingly conflicting requirements in a way that enabled the author to incorporate them in this report.
The author would especially like to acknowledge the contributions of Ben, Lindsay, and Vicki Weiner. Their understanding, patience, and welcome interruptions during the preparation of this report kept the author relatively sane. Their contribution to this preparation of this thesis cannot be underestimated.
1.0 Summary
Vensim software has been used to create a System Dynamics model to provide insight into the sales behavior of the rotorcraft industry. The structure modeled includes representations of the R&D process in the client company, workforce and hiring details, regulation imposition by external agencies, information maturation and dissemination, technical risk, and the portion of revenues used for technology development. The client company's fear of significantly reduced sales with the present system's structure is supported by the baseline model behavior.
Sensitivity studies utilizing the modeled variables provide recommended structure changes that produce significantly improved sales trends over the time frame in question (1999-2008). These changes can readily implemented at reasonable cost, and without undue disruption to the company's current structure and culture.
2.0 Background
Igor Sikorsky has been quoted as saying "The idea of a vehicle that could lift itself vertically from the ground and hover motionless in the air was probably born at the same time that man first dreamed of flying." (Reference 1). Projections of the future from the 1940's and 1950's show helicopters in every garage, with people commuting in their personal flying machines. Although the helicopter has in fact become a practical transportation device, the easily attainable, personal aircraft vision of times past has not come to fruition, and neither have the expected sales. In fact, the limited global market for helicopters and rotorcraft, in combination with extreme competition in the current global economy, has resulted in significant consolidation within the rotorcraft industry. The remaining firms will face continued competition for market share for the foreseeable future. In order to survive, the remaining companies must pursue every competitive advantage for the products and services they intend to provide. Please note that "rotorcraft" will be used to describe vertical takeoff and landing (VTOL) aircraft in this study. All current commercial VTOL aircraft use rotors as their primary lift and propulsion device, and this is assumed to continue to be the case in the time frame investigated here.
Projections for twin turbine engine commercial rotorcraft sales show the sales trend of the 1994-2008 time frame peaking within the next 5 years at approximately 350 sales in 2004 and then slowing to a 300 aircraft per year rate by the end of the time investigated (Figure 1, Reference 2). The 300 aircraft per year level has a total value of between $1.8 and $2.0 billion US dollars.
Further expansion has been hampered by several factors. These include the infrastructure needed to support rotorcraft, competition from existing transportation networks, noise concerns, safety concerns, dilution of the market by surplus military rotorcraft, total costs, and the advent of
commuter aircraft with performance capabilities overlapping the upper end of the rotorcraft envelope, among others. These factors are described in detail in the following paragraphs.
Twin Turbine Engine Helicopter Sales
(nCe 400 350 300 250 200 150 100 50 0 0) 0) Year Industry Figure 1 2.1 Infrastructure
A major operational advantage of rotorcraft is that, unlike fixed wing aircraft, they do not need large investments in real estate in order to start revenue producing operations. Within limitations, almost any open area with an unobstructed space larger than the vehicle's total rotor diameter will do. There are some operational restrictions regarding entry and exit to the landing space, but compared with an airport intended to handle conventional aircraft, they are relatively minor. The landing space, if used as a regular landing zone for scheduled operations, must include some safety equipment, but in general almost any unobstructed area will do. The reason there isn't a heliport on your street corner lies with noise, safety and cost concerns. In a 1994 survey conducted by Rotor & Wing magazine (Reference 3), noise and safety were ranked as the two biggest problems with respect to rotorcraft public image by the respondents, with 50% and 29% of the responses noting these two attributes, respectively.
2.2 Noise Concerns
Rotorcraft are noisy. The current generation of medium weight (6000-11000 lbs takeoff weight) helicopters produce external sound pressure levels on the order of 85-100 dB (decibels). This sound level is not something people usually want in their own backyards. For comparison, an
average living room is 65 dB, a metal wheeled subway car can be 100 dB or louder, and jet airliners at takeoff can approach 130 dB (Reference 4). Sustained exposure to these levels are not only an annoyance, but can cause permanent hearing damage. As a result, a series of noise regulations have been implemented by most countries operating rotorcraft. These regulations usually place a dB limitation for operation of rotorcraft in specific flight regimes. The regulations specify both the levels and the measurement procedures (microphone locations, approach speeds, weather conditions) and in general have limited the number and proximity of rotorcraft operations in several geographical areas. The United States regulations are described in References 5 through 15. In general, the U. S. regulations mirror levels set by the ICAO (International Civil Aviation Organization) and vary according to aircraft takeoff gross weight. The ICAO was established by the United Nations to ensure quality and consistency among international air transport providers. The standards set by the ICAO are voluntary, but both the ICAO emissions standards and acoustic levels have been used as benchmarks by the FAA (Federal Aviation Administration) in setting US regulations. For an aircraft in the 11000 lb class, the ICAO standards specify that approach levels (as in approach as part of the landing flight path of the aircraft) are to be no higher than 98.3 EPNL dB. EPNL is the Effective Perceived Noise Level. Takeoff operations are limited to 97.3 dB, with flyover limited to 96.3 dB. Rotorcraft in the 6000 lb. class must meet flyover levels of 89 dB.
Other countries have more stringent requirements. Switzerland set limits that are -3 dB less than the ICAO standards for each weight class. There are at least two rotorcraft flying today that can meet this reduced level (Reference 16). However, Hong Kong limits levels to 65 dB for any profile, with measurements taken outside structures in residential areas, and inside structures for commercial areas! It is possible to meet this requirement (the client discussed here has at least one product capable of meeting the Hong Kong levels) but it requires extremely controlled flight paths in combination with rotorcraft changes. Extension of the Hong Kong requirement to other geographical areas will require additional aircraft modifications. A detailed discussion of the acoustic requirements and the means by which they can be met by rotorcraft is provided in a Section 5.1 of this investigation.
2.3 Safety Concerns
The general public's fear of flying in rotorcraft has been well documented, most recently in Reference 3. This fear has been compounded by specific incidents such as the Sikorsky S-61 crash on top of the Pan Am building in NY, media footage of helicopter losses in various wars and the lack of information in general regarding the operation of rotorcraft. Since heliports can, in theory, be located in close proximity to inhabited areas, the safety concerns have a direct influence on public decisions regarding heliport placement. Insurance requirements have also
had an influence on the building and location of new heliports. With the exception of the Japanese heliport building spree of the late 1980's, new heliport construction remains at a very low rate in most parts of the world. New construction can take the better part of a decade, due to zoning regulations, public hearings, environmental impact studies and the like. The cost of the construction process can be quite large. An example can be found in our nation's capitol. Washington D.C. does not have a public heliport (other than the White House lawn). A study in April of this year (Reference 17) concluded that a small public heliport to serve the Washington D. C. area would require an investment of between $4 and $5 million to complete. Somewhat larger "vertiports" (Reference 18) capable of handling the evolving generation of tilt rotor aircraft have been estimated to cost $30 million. Construction costs of this magnitude, in combination with the operational costs and the previously described safety and noise concerns ensure that the construction rate will not substantially increase in the near future.
2.4 Costs
The general architecture of rotorcraft results in a larger number of continuously moving
components than in fixed wing aircraft. These components are also exposed to higher levels of vibration than that of fixed wing aircraft. This in turn results in higher failure rates and
maintenance costs. The current direct operating cost of operating a modern, medium size civil helicopter is $800-$1100/hour. This compares with approximately $400/hour for a comparable fixed wing aircraft. A rotorcraft operator must have considerably higher assets and/or charge higher prices to customers. Both requirements reduce the potential rotorcraft sales population, especially if there are sufficient conventional airports in the geographical region the buyer wishes to operate in. In addition, rotorcraft prices in general have increased at a rate significantly greater than inflation as seen in Figure 2 (Reference 19). Where at one time these aircraft were looked upon as relatively affordable alternatives to small business jets for short radius operation, current pricing forces potential buyers to scrutinize the 6-10 passenger class of vehicles more closely.
Rotorcraft Price vs Inflation 120-10099 Yea 80 60 --r s Aircraft Price S40-4) 20 1990 1991 1992 1993 1994 Year Figure 2 2.5 Surplus Rotorcraft
In recent years the US government has decided to release Viet Nam era surplus helicopters to the public. In some instances the vehicles were donated to local police and fire departments (Reference 20), and in some cases auctions have been the venue for distribution. The total number of aircraft dispersed in the 1992 to 1996 time frame has exceeded 1700. This compares to an annual sales rate of 300 per year for commercial and utility rotorcraft during that time. The impact on helicopter sales in this time period was considerable, and significantly changed the business climate for producers. Although it can be argued that some of the new operators of these surplus aircraft could not have afforded to buy new vehicles, a large percentage of the new users (some estimates run a high as 50%) were lost new sales. There is no reason to expect a similar release of this quantity of aircraft in the near future, but as the Army's current fleet of UH-60's ages, it is possible that a release of medium rotorcraft could significantly affect the industry again in 15 to 20 years. The impact on the small total market of such a large influx of aircraft could be devastating, particularly if new aircraft sales are poor at that future date.
2.6 Commuter Aircraft
The advent of a new class of turboprop commuter aircraft brought about by the institution of hub and spoke route systems by the airlines in the 1980's has influenced rotorcraft sales and development in several ways. First, the turboprop commuter aircraft themselves have
performance capabilities which overlap some existing and potential rotorcraft (Figure 3). For a 450 mile round trip as shown, the turboprop (and the tiltrotor) designs show a significant cost advantage for any speed greater than approximately 170 knots. Although this class of fixed wing aircraft does not have vertical takeoff and landing capabilities, they can use the speed advantage and the existing infrastructure of airports and ground transportation to approximate the door to
door times, at least on longer routes, that have been the hallmark of the rotorcraft "advantage" for many years. The inherent mechanical simplicity of these commuter aircraft when compared to rotorcraft also makes it possible to provide a higher capacity aircraft for fewer maintenance and total dollars. Efficiency Comparison 250 X w 200 --V 150 -- Helicopter E Tiltrotor d 100--- Turboprop u) 50--0 0 0 50 100 150 200 250 300 350 Speed, knots Figure 3 2.7 Insurance and Liability
The requirement to insure rotorcraft results in a further disadvantage relative to other means of transportation. Basic premiums are higher per seat than fixed wing aircraft due to higher actuarial
losses. As with all aircraft, in the event of a loss, litigation is just as likely against the manufacturer as the operator. The result has been a underlying reluctance on the part of some manufacturers to fully support the commercial market with new products. This failure has forced continuation of older designs which do not have the additional capabilities that a new design could incorporate.
Despite this less-than-rosy list of potential issues, the world's leading rotorcraft manufacturers have released approximately 15 new commercial designs in the last 10 years. And commercial sales have been projected to increase for the industry as a whole (Figure 1), at least over the next 5 years.
2.8 Research Trends
As the helicopter has been developed, research areas have focused on several shortcomings inherent in the dominant configuration, such as anti-torque system design, hover capability and control system development, among others. For this study of aircraft efficiency, three main
parameters are of interest. The first is aircraft payload-range. This parameter is a measure of the load (payload) the aircraft can carry over a certain distance or range. Figure 4 shows an example
of a payload range curve for a generic medium weight aircraft. Payload-range capability increases require rotor lift to drag ratio improvements, parasite drag reduction, empty weight reduction, and/or engine efficiency improvements. Each of these areas have been subjects of intense research and development efforts over the years. As a result, the payload-range
parameter has followed the trend shown in Figure 5. Cost is another area where large amounts of R&D effort have been expended to reduce the life cycle costs of aircraft in general, and rotorcraft in particular. These include the basic cost of the vehicle, maintenance costs and O&S (Operation and Support) costs. The final parameter that is of interest is weight. As mentioned above, weight is a key factor in improving aircraft efficiency, and it is also directly related to cost (Figure 6).
Sample Payload Range Chart
. -J 0 2500 2000 1500 1000 500 0 50 100 150 200
Range, Nautical Miles
250 300
Figure 4
Payload Range Historical Trend
1960 1970 1980 Year
1990 2000
--- Payload Range (Index)
2010 Figure 5 0 350 4) (U 4) x 4) C 1.6 1.4- 1.2-1 0.8- 0.6- 0.4-0.2 01 1950
- - ~
Cost As a Function Of Gross Weight For Multi-engine Helicopters 10000000
-____ ____ ____ __+ Cost
1000000 I I V I
0 2000 4000 6000 8000 10000 12000 14000 Gross Weight, Ibs
Figure 6
2.9 Regulations
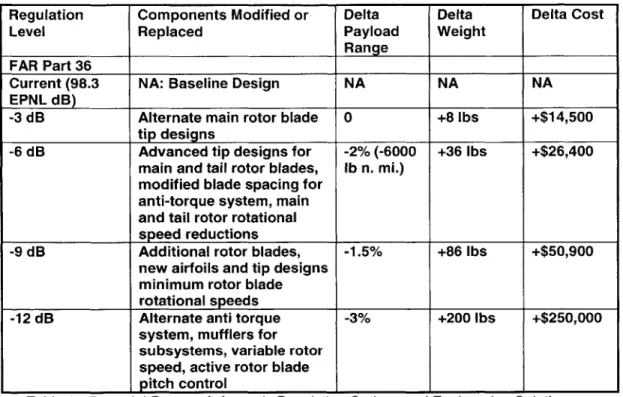
Historically, commercial aircraft regulations have been focused on safety or noise concerns. The first government safety regulations were implemented by the FAA to set standards for commercial aircraft. The first noise regulations dealt with flight corridors to minimize the acoustic footprint of departing and arriving airliners, and were implemented in the 1970's by the FAA. Specific regulations dealing with aircraft and airport acoustic emissions were first implemented by FAR (Federal Aviation Regulation) Parts 36, 91, and 150, and have been updated several times. Rotorcraft noise regulations started in the same time frame. There are several means of reducing the acoustic signature of rotorcraft, depending on the frequency of the signature, its radius of influence, and whether the rotorcraft in question is a completely new or a derivative design. Table 1 provides possible means of reducing acoustic signature, along with impacts to other attributes connected with this study for various projected levels of acoustic regulations.
Regulation Components Modified or Delta Delta Delta Cost
Level Replaced Payload Weight
Range FAR Part 36
Current (98.3 NA: Baseline Design NA NA NA
EPNL dB)
-3 dB Alternate main rotor blade 0 +8 lbs +$14,500
tip designs
-6 dB Advanced tip designs for -2% (-6000 +36 lbs +$26,400 main and tail rotor blades, lb n. mi.)
modified blade spacing for anti-torque system, main and tail rotor rotational
speed reductions
-9 dB Additional rotor blades, -1.5% +86 lbs +$50,900
new airfoils and tip designs minimum rotor blade rotational speeds
-12 dB Alternate anti torque -3% +200 lbs +$250,000
system, mufflers for subsystems, variable rotor speed, active rotor blade pitch control
Table 1 - Potential Rotorcraft Acoustic Regulation Options and Engineering Solutions Aircraft engine exhaust emissions have recently begun to be regulated, as well. Both gas turbine and piston engines have been the subject of the new legislation. For this study, we will look at gas turbine engines only, since these are the engines of choice for all but the smallest rotorcraft.
FAR Part 34 (Reference 21) for turbine engine powered aircraft stipulates limits for nitrous oxides (NOx), carbon monoxide (CO), and hydrocarbons (HC) as well as smoke levels (SN). New designs from the engine manufacturers have incorporated these limits into the initial design parameters since the implementation of the regulations. To date, these modifications have had a negligible effect on engine performance (horsepower, fuel economy, and longevity). However, there is significant pressure to reduce exhaust gas emissions further, and these reductions will
require changes that are projected to impact other attributes.
Automobile emissions regulations have attempted to reduce automobile exhaust emissions since 1967. The current regulated levels for NOx, CO, and HC are 1.4, 3.9, and 2%, respectively, of the uncontrolled value present in 1967 (Reference 22). Table 2 provides potential changes required to gas turbine engines and their impacts to the other attributes of interest, for varying levels of
exhaust emission controls. The maximum reduction level has been chosen to approximate the current value for automobiles, where between 95 and 100% reductions have been achieved.
The ultimate emission control solution, use of an alternate fuel, is also included in Table 2. Several hydrogen-fueled aircraft studies have been completed in recent years (Reference 23)
that indicate the viability of an alternate fuel source such as hydrogen, given some significant infrastructure changes to allow production, transportation, and distribution. A detailed study of alternate fuels is beyond the scope of this thesis. However, the structure of the model lends itself to input of corrected primary parameters that reflect the alternate fuel impacts, which can then be
used to investigate any changes in the behavior of the Unit Sales variable.
Regulation Exhaust Aircraft or Engine Delta Delta Delta
Level Component Values Components Payload Wt Cost
Modified or Range
Replaced
None: No current NA: Baseline NA NA NA
Current requirement Design
Requirement For Turbine Engines <1000 kW (1341 SHP) Power Level
Level for SN = 187(rO)-0.168 Fuel additives, 0 0 +$3,000 Current HC = 19.6 small cycle temp
Turbofans gms/kilonewton rO changes, fuel (airliners) CO = 118 control
gms/kilonewton rO technology NOx= (40+2(rPR))
gms/kilonewton rO
Level for SN = 187(rO)-0.168 Large operating +20% 0 +$12,500 Turbofans HC = 19.6 cycle changes (+60000 lb
after gms/kilonewton rO (temperature, rpm, n.mi.) December CO = 118 mixture), ceramic
31, 1999 gms/kilonewton rO fiber
NOx=(32+1.6(rPR)) reinforcement, gms/kilonewton rO DLE
Equivalent 1-2% of Alternative fuels -20% 1500 $400,000
to uncontrolled levels and/or power (-60,000 lbs
Automobile sources lb n.mi.)
Emissions Level
Table 2 - Potential Rotorcraft Exhaust Gas Emissions Regulation Options and Engineering Solutions
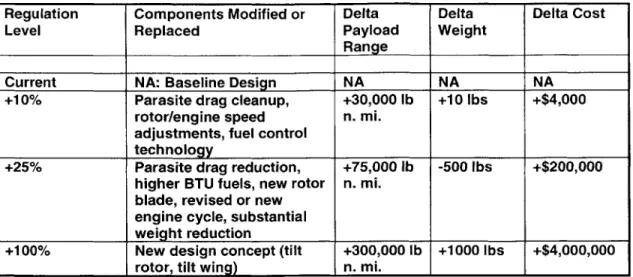
Fuel economy regulations have not been imposed on the aircraft industry at the time of this study. The current availability of fuel, reflected in the lowest adjusted price in decades, does not point to new regulations being imposed any time soon. But as those of us who witnessed the fuel crises of the 1970's know, this can change overnight. For this reason, Table 3 provides the impact to the primary parameters of various solutions to potential fuel economy regulations.
Regulation Components Modified or Delta Delta Delta Cost
Level Replaced Payload Weight
Range
Current NA: Baseline Design NA NA NA
+10% Parasite drag cleanup, +30,000 lb +10 lbs +$4,000 rotor/engine speed n. mi.
adjustments, fuel control technology
+25% Parasite drag reduction, +75,000 lb -500 lbs +$200,000 higher BTU fuels, new rotor n. mi.
blade, revised or new engine cycle, substantial weight reduction
+100% New design concept (tilt +300,000 lb +1000 lbs +$4,000,000 rotor, tilt wing) n. mi.
Table 3 - Potential Rotorcraft Fuel Economy Regulation Options and Engineering Solutions
The maximum improvements listed mirror those of the CAFE (Corporate Average Fuel Economy) standards used in the automobile industry. These regulations have already doubled the
automobile fleet fuel economy from unregulated levels (Reference 24). The aircraft solutions presented in Table 3 include both propulsion system improvements and general aircraft efficiency improvements. The same improvements that help payload range by definition improve fuel economy.
The three regulations investigated here, noise, exhaust emissions, and fuel economy, have been imposed on automobiles over the past three decades. Basic safety and exhaust emissions regulations first were imposed in 1968. Fuel economy regulations were not imposed until 1975. Unfortunately, the technical differences between automobiles and helicopters prevent using the sales trends seen in the automobile industry as benchmarks for behavior in the rotorcraft industry. The differences between gas turbine and piston engines result in somewhat different solutions to exhaust emissions and fuel economy. External noise reductions in automobiles are almost solely achieved by the use of parasitic devices, such as mufflers. Although rotorcraft could, and in some cases do use a type of muffler or other exhaust pipe device to meet acoustic requirements for
engine noise emissions, the noise emanating from the rotor systems must be treated in
completely different ways. The rotor changes may involve variations in the blade pitch, rotational rpm, blade thickness, and relative position of the rotor and fuselage, among others. These alternatives are completely unnecessary for automobiles, since the primary propulsive interaction with the environment is through the tires, not a rotor. Tire tread patterns do affect the external acoustic signature of vehicles, as anyone who has passed a truck or car with snow tires on the highway knows, and recently have been required to meet specific external noise standards. Of course, a rotorcraft does not have this tire problem.
While exhaust emissions are usually treated by combinations of operating cycle temperature for both types of engines, the differences between the thermodynamic cycles of the car's piston engine and the rotorcraft's turbine engines prevent relatively simple but heavy solutions, such as the catalytic converter, to be easily accommodated to for use on aircraft. To date, aircraft
emissions have been improved by judicious adjustment of turbine temperatures, airflow and strict control of the combustion process by digital fuel control systems.
Fuel economy is one area where rotorcraft improvements do have some similarity to automobile industry experience. Improvements in engine efficiency, reductions in drive system frictional losses, electrical losses, and parasite drag can and have been used in both instances to improve fuel economy. Rotor performance improvements, however, are not on the automobile parts list. In general, automotive experience is not applicable to the problem investigated here, although the model described in the following sections could be adapted to specific automotive parameters without much difficulty.
3.0 Model Description
Model development was initiated with a series of meetings with the original client, the Director of Technical Engineering at a major helicopter company. Discussions with the principal client generated the initial problem statement, variable list, and reference modes shown in Figures 7, 8 and 9, respectively. The problem statement (Figure 7) was deceptively straightforward. As the client company moved into the commercial marketplace, the hope was that increased aircraft efficiency (as compared to the competition) would provide a competitive advantage that would
result in increased sales volume. The client feared that sales could decline from a combination of lack of competitive product, an inability to deal with government imposed regulations as well as with the competition, and a research investment plan not focused on the correct target
technologies, or of adequate size. This fear was present even in light of the sales trends forecast for the industry (previously described in Figure 1).
Problem Statement
-We would like to determine the impact on sales of improved payload/range capability.
eWe want to find out which regulations have the largest impact on sales, and which would lend themselves to research
investment to change their impact on sales and gain competitive advantage? Sales Hope Fear 1999 2004 2010 Figure 7
This basic problem statement was used to create the variable list in Figure 8. The variable list can be categorized into three broad categories: financial/business, technical, and social (corporate structure). Variables focusing on the financial and business issues of this problem included sales,
revenues, time to market, opportunity cost, market share, cash flow, business plan fit, investment, annual savings, strategic initiative fit, payback period, and ROl. Variables with a technical focus
included payload range, weight, level of technical risk, competitive advantage, technology mix, reliability and safety. The social structure-related variables included the size and makeup of the workforce, degree of co-location of the project staff, the age variation and learning capabilities of that staff, cultural differences, and the means of interfacing with non-co-located groups.
Rotorcraft Efficiency Variables *Sales -Workforce -Time to market -Revenues -Opportunity Cost -Cash Flow *Technology Mix
-Business Plan Fit
eInvestment
-Annual Savings
-Market share
-Competition
-Strategic Initiative Fit
-Competitive Advantage
oPayload/Range -Reliability
-Risk -Payback Period -Safety
Figure 8
After further discussion with the client, these variables were pared down to six reference modes which are sketched in Figure 9. The Sales reference mode is the basic problem statement - the hope (1) is that sales will increase with time, while the fear (2) is that the company will be out of business within a relatively short time span. For this model, the time horizon chosen was 10 years. This value was based on the experience of the client and the author as to how long the company might be able to sustain continuously decreasing sales.
Rotorcraft Efficiency - Reference Modes
Sales 2 1999 2004 2010 1999 Risk ( 1999 2004 2010 1999 Time to Market 21 2004 2010 ompetitive Advantage 12 2004 2010 Figure 9 Weight 1999 2004 2010 Payload/Range 1 2 1999 2004 2010 -ROI -Political -Cultural -Interfaces *Weight
The Payload/Range reference mode assumes that the existing research activities in materials, propulsion systems, aerodynamics, and fuel development will yield increased payload-range capability as a matter of course. The desire is to have this increase in efficiency outstrip the competition and provide a discriminator for additional sales.
The Weight reference mode is particularly important, since for rotorcraft (and aircraft in general) weight is an indicator of potential performance, and can be directly correlated to cost. As aircraft are designed to include added features desired by the customer, or are affected by regulations and requirements not originally part of their specification, weight grows. Reducing the rate of increase of weight can provide a cost and performance (efficiency) advantage.
As Time to Market decreases, it is hoped that competitive advantage and sales will increase. So this reference mode could provide a measure of any sensitivity to a time window which must be met to maintain a competitive advantage. The Competitive Advantage reference mode has the inverse trend to the Time to Market mode; as time passes, we would like our competitive advantage to increase; the fear is that it will erode, taking Sales along the same path.
The last reference mode, Technical Risk, shows the desire to have technical risk decrease as sales grow. Reduced risk means fewer failed research projects, consistent competitive advantage increases due to successful projects, and lower costs in the long run.
Following the System Dynamics standard method as described in Reference 25, momentum policies were then listed to support (or degrade) these reference modes. The momentum policies are provided in Figure 10, and are the immediate responses to the reference modes if the client did not have a System Dynamics model to provide different insights into the problem.
Rotorcraft Efficiency: Momentum Policies
- Advance technology development to improve efficiency
(payload/range).
- Improve time to market while maintaining the quality
and level of technology development.
- Maintain an informed technology development team
large enough to satisfy demand.
* Anticipate and participate in changes in regulations to
reduce any negative impact on efficiency.
Figure 10
The first policy was aimed at improving efficiency (payload-range) to try to follow the upper line in the reference mode chart. This policy, along with the second policy, are the basic premise of the problem statement. The second momentum policy would reduce time to market without affecting the quality or level of technology development, which in turn would provide benefits in competitive advantage and sales. The technology development team can perform to expectations only if it receives timely, correct information, and if it is large enough to produce useful new technologies. This is the third policy. The last momentum policy is meant to weaken the negative loop affecting efficiency. This loop is presumed to result from unanticipated and/or inordinately stringent regulations.
The System Dynamics model used in this study is based upon three hypotheses. The first hypothesis, shown in causal loop form in Figure 11, is a more detailed restatement of the original problem statement. Starting from "Sales" in the lower left, as Sales increase, Economies of Scale improve Profits and increase the Money Available for Technology Improvement. This money can be used in two ways, according to this hypothesis. First, it can be used to fund Technology Improvements, which would increase Payload/range capability, reduce Weight, and reduce Cost. These changes would improve our Competitive Advantage, resulting in increased Sales. This is a positive, or reinforcing loop.
Hypothesis 1
Improving efficiency will improve our competitive advantage
and increase sales. Regulations which reduce efficiency will degrade our competitive advantage and reduce sales.
Regulation Impositio Money Available for Technology Improvement +
+ Technology Improvements
Profit
Economies of Scale
++ - -+ +
Payload/range Weight Cost
Sales +
- Competitive Advant
Figure 11
The other path in this hypothesis assumes that if Money Available for Technology Improvement increases, regulatory agencies would take this as a signal that companies could afford to research and develop technologies to meet more stringent regulations. The agencies would increase Regulation Imposition, which would cause negative changes in the three performance measurement attributes: Payload/range, Weight, and Cost. (Payload/range would decrease, Weight would increase, and Cost would increase). These changes would reduce Competitive Advantage, decreasing Sales, reducing Profit, and reducing the Money Available for Technology Improvement. This would signal the regulatory agencies to stop new Regulation Imposition. This loop is a negative or balancing loop.
The second hypothesis, shown in Figure 12, assumes the same basic positive loop as the first hypothesis. As more Technology Improvements are available, Payload/range increases and the improved Competitive Advantage increases Sales. This generates additional Profit, providing more Money Available for Technology Improvements, increasing the number of Technology Improvements which in turn increases Payload/Range. The negative or restoring loop for this hypothesis starts with the increase in Competitive Advantage as Payload/Range increases. This increase in Competitive Advantage reduces Market Pressure to Improve Technology, since the
product already has a competitive advantage and increased market share. However, this reduced Market Pressure to Improve Technology also decreases the Level of Technology Risk for the technology improvements to be implemented. This in turn reduces Payload/Range. Available Time to Market influences the Level of Technology Risk, as well. Shorter Available Time to
Market also reduces the Technology Risk level that can be implemented, so improvements in Payload/Range will be reduced relative to longer Available Times to Market.
Hypothesis 2
Low risk technologies for immediate application to product may not provide the level of improvement the market demands and competitors may provide. So sales can suffer even as you're shortening time to market.
Money Available for Technology Improveme
Techno
Profit
Economies of Scale
logyImprovements
Level of Technology Risk
Payload/Range
Sales
+ Competiti
ve Advantage
C)
Available Time to Mark(
Market Pressure to Improve Tech
Figure 12
The third hypothesis, shown in Figure 13, again assumes the same basic positive loop for Technology Improvements increasing Competitive Advantage, Profits, and Money for Technology Improvements. In this hypothesis, the increase in Money Available for Technology Improvement increases the number of people who can work on technology improvements. An increase in the Number of People reduces the time needed to complete the project, reducing Time to Market and improving Competitive Advantage. At the same time, an increase in the Number of People will reduce the general Experience Level of the workers, reducing their average productivity and increasing the Time to Complete the Project. This acts as a restoring loop. The last part of this hypothesis assumes that as the Number of People on a project increases, the Degree of
Co-location increases, as well. This increases the amount of Information Available, which improves our Competitive Advantage.
Hypothesis 3
A technology development team has to be the right size and have sufficient funding to be able to produce technology advancements demanded by the customer or the competition. The team must have enough correct information regarding regulations and the competition's research direction in order to succeed.
Number of People Money Available for Technology Improvement
xperience Leve
Technology Improvements
Profit
4)
1
411
Time to Complete Project +Economies of Scale Degree of Co-location
+ Payload/Range
Time to Market
+ Information Available
Sales +
Sale Competitive Advantag +
Figure 13
The causal loops representing these three hypotheses were then modeled in Vensim (Reference 27) using a combination of the molecules of structure (Reference 26), modified molecules of structure from the same reference, structure from the product development model (Reference 28), new structure, and existing or projected information regarding the interaction of key
variables. For the first hypothesis, four structural components were used to model the first loops. The product development model (Reference 28) was modified to model the Technology
Improvement portion of the loop. This section (Figure 14) also included generation of the
Technology Impacts on Weight, Cost and Payload/range, and included replenishment of potential technology improvements through new creation of projects in the Technology Base.
compet I ve
time window
SelectPDY & C <Ain agletg Roductvil y>
T h IDg nds I
pD'd
needs R
IDPeopl~e Selectpeople
Remainine tech.
improv. potential Technology Technology
"The Well" Identified needs Improvement Improvements
t-s
I~n
nesSelectink Projects in R&D Completing R&D Available Obs scencetiind projects
Refilling the POWI
well Creation creation Tech PLR Improvement Factor
Techng log ay Technology Impact on Payloadrange
. Tech o T o Payloadrange R ik Adjustmnt F <competitive roM fr sTA g Tech Weight Improvement Factor
time window>
<Weighit Ri ,k AdJusmnt F
J~-Im Technology Bas( Technology Impact on Weight
Project Cost Facto se Na o Tech Cost Improvement Factor
Projects in Technology Ba Technology Impact on Cost <Noney Available 'or Technology liprov mcncs> <Cost Rik Adjustment Facoc>
Figure 14
The Regulation Impacts on Payload/Range, Weight, and Cost were modeled by a significantly modified product development model as shown in Figure 15. The combination of Technology and Regulation Impacts on the three primary attributes (Payload/range, Weight, and Cost) were combined to produce the "Actual" attributes as input to the model section shown in Figure 16. This section uses Product Attractiveness and Market Share molecules (Reference 26) appropriately modified to include lookup functions for the Effects of Weight, Cost, and
Reg. Impact on PayloadRange Moncy Available for Technology mp: vements>
Reg. Impact on Weight Payloadrange factor
Lobbying Impact on IDing Weight Factor
<Technology lnprovements Available> Re Impact on Cost Technology Improvem t Facto Lobbying Impact on Approval
Lobbying Impact on Selecting CostFco maif Regs ID'd for Regs in Implemented
egua ion 1Dm Igon Regs Im lementatio Selecti Reg Congress Re ulations
-Approva Regul ion
Impact of Public on IDing Completion Repe Impact of Public on Selecting
Adding New Impact of Public on Approval Potential Reg
Regulation Research Results Impact of Public on Repe
t-5 impact of Public on New Kegs Lobbying Impact on New Regs
Figure 15
Lobbying Impact onRepeal
<Technology hnpact on Payloadrange>
<Reg. Impact on PayloadRanse> <EffectOwPayload/
Attrativeness f> Actual PayloadRange <Effe <Competitive Advantage> Attra
Effect Of PL/R On Maximum Attractiveness Attractiveness Actual C EffectOfCost -Product On Attractiveness Attractiveness
Market Share for Product <EffectO
OnAttracti EffectOfWeightgOhn r Total Attractiveness Attractiveness
rket Share for Competitor's Produc Actual We Attractiveness of Competitor's Product
ctOfCostOn ctiveness f>
<Reg. Impact on Cost>
<Technology Impact on Cost> Weight
veness
<Reo. Impact on Weight>
ight
<Technology Impact on Weight>
Figure 16
<
The last section of the loop, which included Sales, Revenues and Money Available for Technology Improvements, was modeled as a new structure based on conversations with Professor Jim Hines. This structure is shown in Figure 17. A schematic of the combined structure for the first hypothesis' loop is shown in Figure 18.
Fraction of Revenues to Technology Improvement Average Price
Industry Unit Sales Our Revenues
Our Unit Sales
Money Available for Technology Improvements <Market Share for Product>
Time window Figure 17
Hypothesis 1 Model Schematic
Sales, Revenues, and Money Technology Improvement
Available for Technology (Fgr 4
Improvements (Figure 17)(Fgr14
Product Attractiveness and Market Share (Figure 16) Figure 18
Regulation Impacts on Payload Range, Weight, and Cost (Figure 15)
Figure 19 provides the section of the model that describes the second hypothesis. This section uses the Protected Sea Anchor Pricing molecule (Reference 26) modified to model the level of Technological Risk as Market Pressure to Improve Technology and Available Time to Market
changes. Figure 20 incorporates the second hypothesis structure with that of the first hypothesis schematic (Figure 18).
Effect of Market Share on Tech Risk f
PressureTo
~
Adjust <Market Share for Product> Technical RiskAdjusted
Technical Risk Payloadrange Risk Adjustment Factor
Target Tech
Minimum Risk
Technical Weight Risk Adjustment Factor
Risk Technical
Risk Technical
Risk Cost Risk Adjustment Factor
<competitive time window> Initial Technical Risk Figure 19
Model Schematic
Hypothesis 1+ Hypothesis 2
Technical Risk (Figure 19) Sales, Revenues, and Money
Available for Technology Improvements (Figure 17)
Technology
Improvement
(Figure 14)
Regulation Impacts on Product Attractiveness
Payload Range, Weight, and Market Share
and Cost (Figure 15) (Figure 16)
The structure for the third hypothesis is shown in Figure 21, 22 and 23. It consists of three molecules from Reference 26, appropriately modified. The first molecule (Figure 21) is the Aging Chain with Productivity. This structure models the behavior as the number of people grows and the experience level mix changes, affecting average productivity and project completion rates.
Another aging chain, without productivity effects, is used to represent the Information Available as a result of co-location as the Workforce grows (Figure 22). As the information ages, the
probability of the information being correct grows. This Correct Information is used as an input to a modified Protected Sea Anchor Pricing molecule shown in Figure 23.
Workforce
imeFor
RookieTo Roio
Mature Experienced ire
ToGain
Wisdom
Rookies Eperience GrayHairs &
Hiring Maturing Gining Retiring
PRodokivity a production Prod ctiityExperiencedr Productivity GrayHair Productivity Average Productivity Figure 21
<Workforce>
Co-location Extent
Time for Info Quality to Improve Time to Obsolescent Info
Information Generation Factor
Incorrect Correct
Obtainin Info fo Quality Impro solete Information
General Information Collection
Figure 22
<Correct Information> Competitive Advantage Info f
PressureToAdjust Competitive Advantage etitive ntage Competitiv Advantage Changeln2 Competitiv
Advatage InitialCompetitive Advanta;
Time to change competitive
advantage
Sales, Revenu Available for Improvement
Regulation i Payload Ran and Cost (Fi
Model Schematic: All Hypotheses
Technical Ris
es, and Money (Figure 19) Technology
s(Figure 17) Workforce
Chain (Figu
Technology
Improvementsl Informatior (Figure 14) Aging Chai
Competitive
To Informatio mpacts on Product Attractiveness ge, Weight, - +and Market Share gure 15) (Figure 16) Aging re 21) Quality n (Fig. 22 Advantage Du n (Figure 23) Figure 24
The completed model is presented in schematic form in Figure 24. Early in the process, client preferences indicated that flexibility was a key attribute to incorporate in the model if it was to be useful over the time period of interest. The trends of technology improvement, hiring, regulation generation, dollars spent on technology improvements, etc. were parameters that were subject to individual interpretation as well as modification with time. Because of the desire for flexibility, several of these items are modeled as constants or lookup tables, so as to easily incorporate changes due to structure variations in the future. The flexibility request was also accompanied by questions regarding correlation of specific parameters, and the model's capability to predict future sales values, rather than just trends of behavior.
The general suggestion that the model was to be capable of real number predictions was to be a recurring problem throughout this study. The client's point of view was that models not capable of specific value correlation and predictions were to be looked at with skepticism. The author, who has modeling experience not related to System Dynamics, also confronted some instances where the prior experience left questions regarding the results of the Systems Dynamics modeling. However, the insights provided by the model turned out to be relatively independent of the specific values used for the trends mentioned above (especially within the ranges described). This result indicated the basic robustness of the model's structure and resulting behavior, and was a key factor in gaining further acceptance of the methodology by both the client and the author.
4.0 Sensitivity Studies
A series of sensitivity studies were performed as a first step to understanding the interactions of the completed model. The initial series of sensitivity studies were performed by varying the components of the model structure in Figure 14. In this case, the Technology Impact on
Payload/range, Weight and Cost were varied to determine the effect on the primary variable, Unit Sales, and to discover any other insights which might be forthcoming due to the dynamics of the model. The Technology Impacts were doubled and halved relative to their baseline values. The
results of these changes is shown in the causal traces presented in Figures 25, 26, and, 27, below. As each Technology Impact parameter is varied (lower or third row of charts), the variable does show improvements commensurate with the multiplying factor used. For each case, theOl is the baseline, the second trace is for the Technology Impact value doubled (the02, 04, and 06 respectively for PayloadRange, Weight, and Cost), and the third set of lines represents halving the baseline technology improvements (the03, 05, and 07).
the03 the02 theOl the05 the07 'tfeU4 theOl the06 theOI Actual PayloadRange 400,000 250,000 100,000
"Reg. Impact on PayloadRange"
0 -0.1 M -0.2 M Actual Weight 20,000 14,000 8,000
"Reg. Impact on Weight"
2,000 1,000
0
Technology Impact on PayloadrangTechnology Impact on Weight
100,000 0 30,000 -1,000 -40,000 -2,000 0 50 100 0 50 100 Time (Month) Actual Cost 6M 5 M 4M
"Reg. Impact on Cost" 2 M
I M 0
Technology Impact on Cost 0 -0.4 M -0.8 M Time (Month) 0 50 100 Time (Month) Initial Payloadrange the03: 300,000 the02: 300,000 the0l: 300,000 Figure 25 Initial Weight the05: 10,000 the0l: 10,000 Figure 26
The second row of charts shows the Regulation Impact on PayloadRange, Weight, and Cost. The variation in Technology Improvements show little or no influence on this parameter, but the total magnitude of the Regulation Impact does affect results in the Actual PayloadRange, Weight, or Cost of the top row of plots. In general, the variation in Actual PayloadRange, Weight, and Cost vary within +/-20 to 25% of the baseline value, despite Technology Impacts varying from -50% to
the04: 10,000 Initial Cost the07: 4 M theOl: 4 M the06: 4 M Figure 27
+200%. The impact of the variations in the Actual parameters on Sales is presented in Figures 28, 29, and 30 below. Sales varies up to +6% from the baseline for the Payload Range case (Figure 28), which is significant. Note that the impact of Technology Improvements on Weight and Cost produce a similar impact on Sales. Because of the close relationship between weight and cost for aircraft, this is not surprising. The combination of Cost and Weight produces variations very similar to that of PayloadRange alone. The final result at the end of the time period in question, a 20% reduction in aircraft sold per month, requires further analysis to determine alternatives to the structure that caused this behavior.
the03 the05 the02 the04 theOl -theO I -the07 -the06 theOI Our Unit Sales
20 |
17.5
15 _ _
12.5 10
Market Share for Product
0.6
-0.5 0.4 0.3 0.2 0 50 100 Time (Month) Industry Unit Salesthe03: 40
theO1: 40
the02: 40
Figure 28
Our Unit Sales
20
17.5
15
12.5
10
Market Share for Product
0.6 0.5 0.4 0.3 0.2 0 50 100 Time (Month) Industry Unit Sales
the05: 40
theO1: 40
the04: 40
Our Unit Sales
20 17.5
15
12.5
10
Market Share for Product
0.6 0.5 0.4 0.3 0.2 0 50 100 Time (Month) Industry Unit Sales
the07: 40
theO1: 40
Figure 29
the06: 40
Figure 30
Since technology improvements act as part of the positive loop diluting the impact of regulations, it is worthwhile investigating the parameters that cause the three Technology Impacts' behaviors. Looking back at Figure 14, we can see that each Technology Impact parameter has three inputs: the Technology Improvement Factor, the parameter Risk Adjustment Factor, and Technology Improvements Available. We will discuss the Risk Adjustment Factors in a section below. The Technology Improvement Factors were conservatively chosen based on current experience with Technology Improvement projects in the client company. For PayloadRange, an improvement of 3000 lb-nmi was assumed per project. This represents a 1% improvement per project. A 1-3% improvement in rotor L/De would be considered significant using a single technology idea and the current state of the art. Similarly, an improvement of 25 lbs for a single project, on average, is a


![[PDF] Formation sur l’Utilisation du logiciel Audacity | Cours informatique](data:image/gif;base64,R0lGODlhAQABAIAAAP///wAAACH5BAEAAAAALAAAAAABAAEAAAICRAEAOw==)