Temporal Dynamics of Iris Yellow Spot Virus and Its Vector,
Thrips tabaci (Thysanoptera: Thripidae), in Seeded and
Transplanted Onion Fields
CYNTHIA L. HSU,1,2CHRISTINE A. HOEPTING,3MARC FUCHS,4ANTHONY M. SHELTON,1 ANDBRIAN A. NAULT1
Environ. Entomol. 39(2): 266Ð277 (2010); DOI: 10.1603/EN09165
ABSTRACT Onion thrips, Thrips tabaci (Lindeman) (Thysanoptera: Thripidae), can reduce onion bulb yield and transmit iris yellow spot virus (IYSV) (Bunyaviridae: Tospovirus), which can cause additional yield losses. In New York, onions are planted using seeds and imported transplants. IYSV is not seed transmitted, but infected transplants have been found in other U.S. states. Transplants are also larger than seeded onions early in the season, and thrips, some of which may be viruliferous, may preferentially colonize larger plants. Limited information is available on the temporal dynamics of IYSV and its vector in onion Þelds. In 2007 and 2008, T. tabaci and IYSV levels were monitored in six seeded and six transplanted Þelds. We found signiÞcantly more thrips in transplanted Þelds early in the season, but by the end of the season seeded Þelds had higher levels of IYSV. The percentage of sample sites with IYSV-infected plants remained low (⬍12%) until August, when infection levels increased dramatically in some Þelds. The densities of adult and larval thrips in August and September were better predictors of Þnal IYSV levels than early season thrips densities. For 2007 and 2008, the time onions were harvested may have been more important in determining IYSV levels than whether the onions were seeded or transplanted. Viruliferous thrips emigrating from harvested onion Þelds into nonharvested ones may be increasing the primary spread of IYSV in late-harvested onions. Managing
T. tabacipopulations before harvest, and manipulating the spatial arrangement of Þelds based on harvest date could mitigate the spread of IYSV.
KEY WORDS Thrips tabaci, Tospovirus, epidemiology, management, Allium cepa
Onion thrips, Thrips tabaci (Lindeman) (Thysan-optera: Thripidae), is a major pest of dry bulb onion,
Allium cepa(L.), in New York. Larvae and adults feed directly on leaves damaging plant tissue and reducing photosynthesis, resulting in smaller bulbs and lower marketable yields. In New York, severe thrips damage can reduce bulb yield by 33% or more (Nault and Shelton 2008).
T. tabacihas become an even greater concern to onion growers across the U.S. because of their ability to transmit an invasive tospovirus, iris yellow spot virus (IYSV) (Bunyaviridae: Tospovirus). Thrips are the only vectors of tospoviruses, and T. tabaci is the only known vector of IYSV (Corteˆs et al. 1998, Nagata et al. 1999a, Pozzer et al. 1999, Kritzman et al. 2001). IYSV is not transmitted through onion seeds (Kritzman et al.
2001, Robe`ne-Soustrade et al. 2006). Thrips that de-velop on plants infected with a tospovirus can acquire the virus in their early larval stages (Jones 2005, Whit-Þeld et al. 2005), and acquisition rates decrease as larvae mature (Nagata et al. 1999b, van de Wetering et al. 1999, Chatzivassiliou et al. 2002). Once acquired, tospoviruses propagate in their vector and are persis-tently transmitted, and viruliferous thrips are capable of spreading the virus for the rest of their lives (Ullman 2002, Jones 2005, WhitÞeld et al. 2005). Aviruliferous thrips cannot acquire a tospovirus as adults (Jones 2005, WhitÞeld et al. 2005).
IYSV was Þrst detected in the U.S. in Idaho in 1989 (Hall et al. 1993). Since 2000, IYSV has been conÞrmed in most onion production areas in the United States (Hall et al. 1993, Schwartz et al. 2002, Abad et al. 2003, Moyer et al. 2003, Creamer et al. 2004, du Toit et al. 2004a, Mullis et al. 2004, Crowe and Pappu 2005, Miller et al. 2006, Pappu and Matheron 2008) and provinces in Canada (Hoepting et al. 2008). In New York, IYSV was Þrst detected in 2006 (Hoepting et al. 2007). A survey of onion Þelds in western New York in late 2006 found IYSV-infected plants in 37 of 41 Þelds (Fuchs et al. 2007). In 2007, a more extensive survey found IYSV-infected plants in every major onion growing region in 1Department of Entomology, Cornell University, New York State
Agricultural Experiment Station, 630 W. North Street, Geneva, NY 14456.
2Corresponding author, e-mail: [email protected].
3Cornell Cooperative Extension, Cornell Regional Vegetable
Pro-gram, 12690 Rte. 31, Albion, NY 14411.
4Department of Plant Pathology and Plant-Microbe Biology,
Cor-nell University, New York State Agricultural Experiment Station, 630 W. North Street, Geneva, NY 14456.
New York (Nault et al. 2008a). IYSV can cause sig-niÞcant yield losses and grade reductions in onion bulb and seed crops (Pozzer et al. 1999; Gent et al. 2004a, 2004b; du Toit et al. 2004b; Gent et al. 2006; Poole et al. 2007; Shock et al. 2008). The potential impact of IYSV on New YorkÕs onion industry is un-clear and may depend on how early and quickly the virus spreads within a Þeld.
Dry bulb onions in New York are planted in April and May and bulbs are harvested in the late summer and fall; no onions are grown over the winter in New York. Approximately 85% of the onion crop is grown from seed and 15% is grown from transplanted onions, most of which are imported from Arizona. In Colo-rado, between 0.4 Ð5% of onion transplant seedling lots imported from Arizona and California had symptoms of IYSV, and 18 Ð91% of the seedling lots sampled were infested with T. tabaci (Gent et al. 2006). At the start of our study, the role of transplants as a potential source of IYSV in New York was not known. Imported transplant onions could be infected with IYSV when they arrive or they could harbor viruliferous thrips. Thus, IYSV might be detected in transplanted Þelds earlier in the season than in Þelds grown from seed. In addition, onion plants started from transplants are usually farther ahead in development than plants started from seed. Transplanted onions are generally larger in size than seeded onions, and this size differ-ence is most evident early in the season. The larger plants in transplanted onion Þelds may be preferen-tially colonized by early season T. tabaci. There are a number of early season plants in New YorkÕs onion system that could serve as inoculum sources for IYSV. In 2007 and 2008, IYSV-infected volunteer onion plants were found in the spring in onion Þelds and onion cull piles in New York (Nault et al. 2008b). Many weeds in New York and in other states have also been conÞrmed as host plants for IYSV (Gent et al. 2006; Fuchs et al. 2007; Nischwitz et al. 2007; Sampangi et al. 2007; Nault et al. 2008b; Schwartz et al. 2008b; Evans et al. 2009a, 2009b). Schwartz et al. (2008b) demonstrated that T. tabaci that developed on IYSV-infected weeds and became viruliferous could trans-mit IYSV to uninfected onion seedlings. Preferential colonization of the larger plants in transplanted Þelds by early season thrips, some of which may be virulif-erous, might also increase the risk of transplanted onions becoming infected sooner than seeded onions. Although IYSV might be detected sooner in trans-planted onion Þelds, transtrans-planted onion Þelds may be at lower risk of yield losses from IYSV. While seeded and transplanted onions are planted simultaneously in New York, most transplanted Þelds are harvested be-fore seeded ones, and transplanted Þelds may be har-vested before the virus spreads through the Þeld and/or before symptoms affect bulb development. Schwartz et al. (2004) suggested that the incubation period from infection by IYSV to symptom expression might be 30 d or longer. Seeded Þelds may be at a greater risk of yield loss because plants started from seeds are in the Þelds longer allowing more time for symptoms to develop. In addition, seeded Þelds might
be at higher risk for higher infection levels at the end of the season if viruliferous adult T. tabaci emigrating from senescing plants in harvested Þelds colonize and spread the virus in Þelds that are still green and grow-ing.
The purpose of this project was to compare thrips populations and IYSV infection levels in seeded and transplanted onion Þelds in New York. SpeciÞc ob-jectives were to: (1) identify differences in coloniza-tion by comparing T. tabaci densities in seeded and transplanted onions early in the season; (2) document the spread of IYSV by monitoring IYSV levels over time in seeded and transplanted onion Þelds; (3) test whether IYSV levels at the end of the season were higher in seeded or transplanted Þelds; and, (4) de-termine whether T. tabaci densities could be used to predict IYSV levels at the end of the season.
Methods and Materials
Onion Fields and Sampling Strategy. Commercial onion Þelds located in western New York were used. Seeded and transplanted onion Þelds of the same va-riety were blocked in pairs that were managed by the same grower to minimize variation because of pest management practices, except one pair in 2008, which was managed by two separate growers. Pairs of Þelds were within close proximity to each other. Six pairs of Þelds were sampled in each year. Fields ranged be-tween 60 Ð 80 m wide and each Þeld was separated into six transects. Distances between transects varied de-pending on the width of the Þeld. Within each transect, 8 Ð10 sample locations were used, spaced ⬇23Ð34 m apart depending on the length of the Þeld. This divided each Þeld into a grid with 50 Ð 60 sections per Þeld. Sample grid sections were held constant within each Þeld for each sample date, while the exact sample location varied within the grid between sample dates.
In 2007, a pair of seeded and transplanted Þelds representing each of six varieties (days to maturity) was used: ÔHighlanderÕ (88), ÔShermanÕ (95), ÔMile-stoneÕ (106), ÔSantanaÕ (115), ÔRed BullÕ (118), and ÔSedonaÕ (118). The Highlander, Sherman, Santana, and Sedona Þelds were located in the Elba Muck in Orleans County, and the Milestone and Red Bull Þelds were located in the Linwood Muck in Genesee County. Thrips counts were made every 2 wk from 11 June through 4 September (seven sample dates). Plant samples for IYSV analyses were taken every 2 wk from 9 July through 4 September (Þve sample dates).
In 2008, all 12 Þelds were located in the Elba Muck. There were two pairs of Milestone and Red Bull Þelds, and one pair each of Sedona and ÔRed ZeppelinÕ (115 d to maturity) Þelds. Thrips counts were taken every 2 wk from 9 June to 20 August 2008, and then weekly from 20 August to 5 September 2008 (eight sample dates). Plant samples for IYSV analyses were taken every 2 wk from 9 June through 4 August, and then weekly from 4 August to 5 September (nine sample dates).
All Þelds were sampled twice for T. tabaci before insecticide spray programs were initiated. Foliar ap-plications of registered insecticides (Reiners and Pet-zoldt 2009) were then used multiple times during the season to manage thrips populations. Despite the use of insecticides in the Þelds sampled, thrips were prev-alent all season long in both years.
Plant and Thrips Samples. At each sample site, one plant was pulled and all larval and adult thrips on the plant were counted and recorded separately. In New York, T. tabaci is by far the dominant species on on-ions, precluding the need to differentiate among other species during sampling (Gangloff 1999). To test for IYSV, an additional four plants were pulled within a 4 m radius of the Þrst plant and the Þve plants were combined. Plants were selected arbitrarily, not based on the presence or absence of symptoms. Depending on the number of sample sites in the Þeld, 250 Ð300 plants per Þeld were removed from the Þeld on each sample date for analysis. All plants were maintained in a cold storage facility (7.2⬚C) until analysis. In the last 2 wk of the season, we did not count thrips on plants after the bulbs were undercut and lifted because this practice dislodges thrips from the plants. However, we were able to collect plant material for IYSV analyses in some of those Þelds.
Testing for IYSV. A double antibody sandwich en-zyme-linked immunosorbent assay (DAS-ELISA) was used to determine whether a plant was infected with IYSV. A standard protocol, commercially available an-tibodies, and positive and negative controls for IYSV in onions were used based on the manufacturerÕs rec-ommendations (Agdia Inc., Elkhard, IN). All samples and controls were tested in duplicate wells and the mean of the two readings was used for analysis.
Plants from each site were analyzed as a 5-plant composite sample. In 2007, a thin lateral slice of leaf tissue from the middle section of each plant leaf was used. In 2008, based on preliminary studies showing that newer leaves were more likely to react positively for IYSV using DAS-ELISA than older leaves (C.L.H., unpublished data), the outermost four leaves of each plant were removed and a thin lateral slice of leaf tissue from the middle section of only the central leaves (⫽youngest leaves) was used. This sampling method is conservative because IYSV does not appear to be detectable in all leaves of Allium spp. using DAS-ELISA (Gent et al. 2006, Smith et al. 2006). The spatial heterogeneity of IYSV in onion plants means there is a potential for false negative results resulting in an underestimate of virus incidence.
Plant tissue samples were 1 g and were ground 1:10 (wt:vol) in general extraction buffer (Agdia Inc.). Reactions were stopped after 20 min using 3.0 N so-dium hydroxide (NaOH). Optical density (OD) read-ings were taken at 405 nm using an MRX Microplate Absorbance Reader and Revelation software (DYNEX Technologies, Chantilly, VA).
Sample data were separated into two populations to determine whether a sample was considered positive for IYSV. First, the mean OD reading for the negative controls for each plate was subtracted from the mean
OD readings for each sample on the plate to control for any variation between plates. The resulting data were transformed using ln ([sample * 1000]⫹ 100). The distribution of transformed samples was sepa-rated into negative and positive populations using “normalmixEM” (R Project 2008), an expectation-maximization (EM) algorithm for mixtures of univar-iate normal distributions that separates data into two populations (McLachlan and Peel 2000). The popu-lation with the lower mean OD reading was consid-ered the negative population. A threshold, t, was cal-culated using the estimated mean of the negative population (0⫽ 4.721) plus four times the estimated standard deviation of the negative population (SD⫽ 0.207). If a Gaussian distribution is an appropriate assumption, this threshold, t⫽ 5.549, would capture 99.99% of the negative data, minimizing the probabil-ity that a negative sample would be incorrectly clas-siÞed as positive for the virus. Samples with a ln-transformed value greater than t ⫽ 5.549 were classiÞed as positive for IYSV. The estimated mean for the negative population calculated using “normal-mixEM” was robust to changes in the mean and/or standard deviation of the positive population. Data are presented in terms of the percentage of sites with plants that reacted positively for IYSV within each Þeld over time.
Statistical Analyses. All statistical analyses were done using PROC MIXED (SAS Institute 2002) unless noted otherwise. Variety was used as the random fac-tor and was not included in the model statements. The denominator degrees of freedom were calculated us-ing Kenward-Roger methods (Kenward and Roger 1997). The proportion of sites with IYSV-infected plants in each Þeld was transformed using a logit trans-formation, ln ([proportion positive⫹ c]/[1 - propor-tion positive⫹ c]), where c ⫽ 0.001, and thrips counts were transformed using ln (thrips count ⫹ 0.001) before regression analyses. NonsigniÞcant interaction terms were dropped during model development. Non-signiÞcant main effect terms were included if includ-ing those terms resulted in a Þnal model with a lower residual variance compared with models that excluded those terms.
The following designations of thrips densities were used in the analyses: cumulative number of thrips larvae and adults counted over the season, larval den-sities early in the season, adult denden-sities early in the season, larval densities late in the season, and adult densities late in the season. To standardize cumulative thrips densities for comparisons, total larval and adult thrips counts per Þeld were divided by the number of sites and the number of thrips sample dates for each Þeld. Early thrips densities were calculated as the total number of thrips larvae or adults counted per Þeld on the Þrst two sample dates, before any pesticide appli-cations were made in any of the Þelds. Field totals were standardized by dividing by the number of sites per Þeld and the number of thrips sample dates. Late thrips densities were calculated as the total number of larval or adult thrips counted per Þeld between 6 August and 4 September 2007, and between 4 August
and 5 September 2008, and Þeld totals were standard-ized by dividing by the number of sites and the num-ber of thrips sample dates for each Þeld. In regressions using late densities of larvae and adults, the High-lander variety was harvested before 6 August 2007, so no late thrips data were collected. Consequently, the Highlander pair of Þelds was excluded from some analyses and N was adjusted accordingly.
There was a potential for the four thrips categories, larval and adult densities early and late in the season, to be correlated. An analysis was done using PROC REG (SAS Institute 2002) to test for collinearity be-tween these four categories with Þnal levels of IYSV as the response variable. Results showed that none of the four categories had a variance inßation factor⬎10 or a condition index ⬎10. We concluded that col-linearity would not be a signiÞcant problem for re-gressions that included all four thrips categories.
Thrips Densities in Seeded and Transplanted Fields. Larval and adult thrips densities over time in seeded and transplanted Þelds were compared graph-ically. Relative proportions of larvae and adults were calculated over time and compared between 2007 and 2008.
Differences in larval and adult thrips densities be-tween seeded and transplanted Þelds early in the sea-son and late in the seasea-son were analyzed using re-gression models that included year, Julian date of the last thrips sample before harvest, field type (seeded or transplanted) and the two-way interaction between
field typeand year as predictors.
For the 2008 data only, increases in thrips popula-tions over time were further analyzed using PROC REG (SAS Institute 2002), with Julian date of each thrips sample as the predictor and thrips densities on that date as the response. An exponential growth model was used and thrips counts were ln-trans-formed to create a linear model. The season was di-vided into two periods, June/July, consisting of the four sample dates between 9 June and 21 July, and August/September, consisting of the remaining sam-ple dates between 4 August and 5 September. Thrips were divided into two categories, larvae or adults. Mean slopes were calculated as estimates of growth rates, and 95% conÞdence intervals for slopes were calculated for each regression.
IYSV Levels Over Time. The proportion of sites testing positive for IYSV over time in each Þeld was compared graphically between Þeld types and years. The Þrst date IYSV was detected in each Þeld was recorded.
Effects of Thrips Densities and Field Type on IYSV Levels. To determine whether the proportion of sites with IYSV-infected plants was higher in seeded or transplanted Þelds, and whether thrips densities were a signiÞcant predictor for Þnal IYSV levels, only sam-ple dates for which both IYSV and thrips data were available were used. The regression model response,
IYSV level,was the proportion of sites that had plants that reacted positively for IYSV on the last sample date in which thrips data existed.
The Þrst analysis used cumulative larval thrips
den-sities, cumulative adult thrips denden-sities, year, Julian date
of the last thrips sample, and field type as main effects, and included all of the two-way interaction terms involving field type and year. Subsequent analyses used the four categories of thrips, early and late larval thrips
densities,and early and late adult thrips densities, in-stead of cumulative thrips densities, to identify which categories were signiÞcant in predicting Þnal IYSV
levels.These analyses used all four thrips categories,
year, Julian dateof the last thrips sample, and field type as the main effects, and included all of the two-way interaction terms involving field type, and the two-way interaction terms between year and the four thrips
categories.
Relative Importance of Thrips Categories in Pre-dicting IYSV. Model subsets were used to compare the relative importance of the four thrips categories, early and late larval and adult densities. The base model included Julian date of the last thrips sample before harvest and field type. Data from each year were an-alyzed separately. The unexplained residual variance resulting from this base model was then compared against a base model plus one of the four thrips cat-egories. Each thrips category was analyzed separately. The relative importance of each thrips category was ranked based on the amount of residual variance that category explained above the base model. To allow equitable comparisons between early and late thrips populations in 2007, the Highlander Þelds were ex-cluded from the data set used in both regressions.
Results
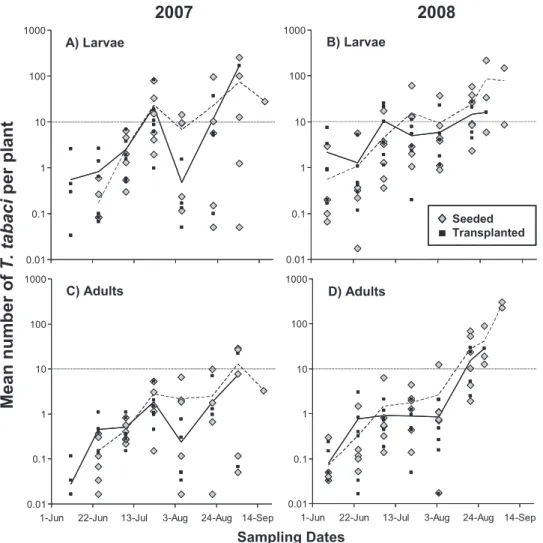
Thrips Densities Over Time. Thrips densities in-creased over the course of the season in both years even though Þelds were receiving insecticide sprays throughout the season (Fig. 1). Peaks in mean larval densities per plant occurred in mid July and late Au-gust. Mean larval and adult densities were higher in transplanted Þelds early in the season and higher in seeded Þelds later in the season. Larval densities in many of the Þelds exceeded 10 larvae per plant be-tween 20 August and 5 September in both years. Adult thrips densities remained low for most Þelds in 2007, but in 2008 adult densities in 11 out of 15 samples exceeded 10 adults per plant between 20 August and 5 September. There was more variation in both larval and adult densities between Þelds in August and Sep-tember 2007 compared with the levels of variation in thrips densities between Þelds in August and Septem-ber 2008.
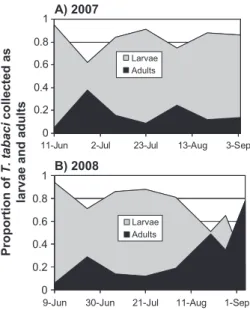
The proportion of larvae to adults over time showed two distinct peaks in relative densities of adults, one in mid to late June and a second peak in August (Fig. 2). The proportion of adults increased to⬎50% by the end of the season in 2008, but not in 2007.
Early Season Thrips Densities. Transplanted Þelds had more thrips early in the season compared with seeded Þelds (Fig. 1). The difference was signiÞcant for early larvae (Fig. 3) (field type: N⫽ 24; F ⫽ 5.62; df⫽ 1, 18.1; P ⫽ 0.029) and marginally signiÞcant for
early adults(Fig. 3) (field type: N⫽ 24; F ⫽ 4.28; df ⫽ 1, 15.8; P⫽ 0.055).
There were no signiÞcant interactions between
field typeand year, and year was not signiÞcant in either analysis so data from both years were analyzed together in both analyses. The model with the lowest residual variance for early larvae included year, Julian
date,and field type, though Julian date was not sig-niÞcant (Table 1). The model with the lowest residual variance for early adults included only field type (Ta-ble 1).
Late Season Thrips Densities. Fields harvested later in the season had higher mean densities of thrips than earlier harvested Þelds (Fig. 1). Year was signiÞcant in regressions using both late larvae and late adults as the response variables; there were signiÞcantly more late larvae in 2007 compared with 2008 (Fig. 4) (year: N⫽ 22; F⫽ 6.00; df ⫽ 1, 16.1; P ⫽ 0.026), and signiÞcantly more late adults in 2008 than in 2007 (Fig. 4) (year: N⫽ 22; F⫽ 30.42; df ⫽ 1, 14.6; P ⬍ 0.001). Consequently, each thrips category was analyzed separately by year.
There was no signiÞcant interaction between field type and year.
For late larval thrips there were signiÞcant positive relationships between thrips densities and Julian date of the last thrips sample, samples taken later in the season had signiÞcantly higher larval populations in both years (2007, Julian date: N⫽ 10; F ⫽ 24.37; df ⫽ 1, 4.04; P⫽ 0.008; 2008, Julian date: N ⫽ 12; F ⫽ 8.37; df⫽ 1, 10; P ⫽ 0.016). Field type was not signiÞcant in either year. The models with the lowest residual vari-ance for late larvae in both 2007 and 2008 included only Julian date (Table 1).
For late adult thrips densities in 2007, neither Julian
datenor field type was a signiÞcant predictor. In 2008,
Julian date was signiÞcant and, similar to 2008 late
larvae,the relationship between Julian date and late
adult thrips densities was positive (Table 1) (2008,
Julian date: N⫽ 12; F ⫽ 9.69; df ⫽ 1, 7.6; P ⫽ 0.015). Field typewas not signiÞcant in 2008, though the model with the lowest residual variance for late adults in 2008 included Julian date and field type (Table 1). 0.01 0.1 1 10 100 1000 0.01 0.1 1 10 100 1000 0.01 0.1 1 10 100 1000
1-Jun 22-Jun 13-Jul 3-Aug 24-Aug 14-Sep 0.01 0.1 1 10 100 1000
1-Jun 22-Jun 13-Jul 3-Aug 24-Aug 14-Sep
8
0
0
2
7
0
0
2
Mean number of
T. tabaci
pe
r plant
Sampling Dates A) Larvae B) Larvae C) Adults D) Adults Seeded TransplantedFig. 1. Density of T. tabaci larvae (A and B) and adults (C and D) in 12 onion Þelds in 2007 and 2008. Dashed line, mean
Thrips Population Growth Rates. The growth rates for adult thrips populations were higher than the growth rates for larvae in both time periods (Table 2). The highest mean rate of increase was for adults in the August/September period. The 95% conÞdence inter-val for the population growth rate for adults in the August/September period had minimal overlap with growth rates for larvae in June/July, larvae in August/ September and adults in June/July. All four regres-sions using June/July larvae and adults, and August/
September larvaeand adults were signiÞcant, though the exponential growth models provided a better Þt for adults than for larvae (Table 2).
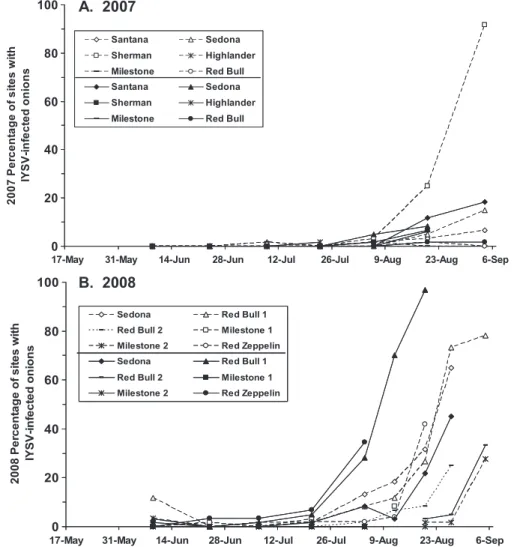
IYSV Levels Over Time. IYSV was detected Þrst in seeded Þelds in 2007 (9 July) using DAS-ELISA. In 2008, IYSV was detected in both Þeld types at the same time and a month earlier than in 2007 (9 June) (Fig. 5). There was no clear pattern suggesting that IYSV was more likely to be detected earlier or spread faster in one or the other Þeld type, even though
trans-planted Þelds had signiÞcantly more thrips early in the season.
IYSV levels were low for the beginning of both years before increasing substantially in some Þelds during August (Fig. 5). In 2007, only three Þelds had sites that tested positive for IYSV before 6 August, and⬍2% of the sites tested positive in each Þeld. On 6 August, IYSV was detected in Þve of the 12 Þelds. Only one Þeld had high levels of IYSV by the end of the season (91.7% of the sites in the seeded Sherman Þeld had IYSV-infected plants). In the seeded Highlander Þeld, we did not Þnd IYSV in any of the sites throughout the sampling period.
In 2008, we found IYSV in four Þelds on the very Þrst sample date, 9 June; two were seeded Þelds and two were transplanted Þelds. The percentage of sites with IYSV-infected plants remained low (⬍12%) in all 12 Þelds until the last sample date in July. After 21 July, IYSV levels increased until nine of the 12 Þelds had IYSV-infected plants in 20% or more of the sites sam-pled. The lowest consistent IYSV levels were in three of the Milestone Þelds, which had IYSV-infected plants in only 0 Ð 8.3% of the sites in each Þeld. The
0 0.2 0.4 0.6 0.8 1
11-Jun 2-Jul 23-Jul 13-Aug 3-Sep Larvae Adults 0 0.2 0.4 0.6 0.8 1
9-Jun 30-Jun 21-Jul 11-Aug 1-Sep Larvae Adults P ropor tion of T. tabaci collected as lar v ae and adults A) 2007 B) 2008 Larvae Adults Larvae Adults
Fig. 2. Relative proportions of larvae to adult T. tabaci in
onion Þelds over time in 2007 (A) and 2008 (B).
0 0.3 0.6 0.9 1.2 1.5 Larvae Adults Mean num ber of thr ips per s ite per s a mpl e date per fi el d Seeded Transplanted P = 0.055 P = 0.029
Fig. 3. Mean number of T. tabaci larvae and adults found
in seeded and transplanted onion Þelds early in the season (during the Þrst two sample dates in June).
0 5 10 15 20 25 30 35 40
Late Larvae Late Adults
M ean n u m b e r of t h ri ps per s it e pe r sam p le da te pe r fi el d 2007 2008 P = 0.026 P < 0.001
Fig. 4. Mean number of T. tabaci larvae and adults found
late in the season (during August and September) in 2007 and 2008.
Table 1. Final models and parameter estimates for six separate
mixed model regression analyses testing the significance of year, Julian date of the last sample before harvest and field type on densities of T. tabaci
Response
variable Intercept Year
Julian date
Field typea
Early larvaeb ⫺2223.03 1.1145 ⫺0.0648 ⫺1.8639
Early adultsb ⫺1.8338 N/A N/A ⫺0.9640
Late larvae 2007c ⫺32.0239 N/A 0.1366 N/A
Late larvae 2008c ⫺45.6012 N/A 0.2021 N/A
Late adults 2007c N/A N/A N/A N/A
Late adults 2008c ⫺44.0549 N/A 0.1947 0.9048 aThe default Þeld type was seeded. A negative value means thrips
densities were lower in seeded Þelds compared with transplanted Þelds, a positive value means thrips densities were higher in seeded Þelds.
bEarly larvae and adults are the total no. thrips counted per Þeld
on the Þrst two sample dates divided by the no. of sites per Þeld.
cLate larvae and adults are the total no. thrips counted per Þeld
between 4 Aug. and 5 Sept. 2008, divided by the no. of sites and the no. thrips sample dates for that Þeld.
highest levels of IYSV were found in a transplanted Red Bull Þeld; 96.7% of the sites had IYSV-infected plants on the last sampling date before harvest.
In general, IYSV-infected plants were asymptom-atic in June. The Þrst plants with IYSV-symptoms were found in early July in both 2007 and 2008 and were found in transplanted Þelds (C.A.H., unpublished data). Symptomatic plants were not very common in
either Þeld type until late July/early August (C.L.H., unpublished data).
Effects of Thrips Densities and Field Type on IYSV.
Cumulative adult thripswere a signiÞcant predictor of Þnal IYSV levels, the greater the density of adult thrips the higher the percentage of sites testing positive for IYSV on the last sample date (cumulative adults: N⫽ 24; F⫽ 27.13; df ⫽ 1, 18.9; P ⬍ 0.001). Cumulative larval
Table 2. Results from four separate linear regression analyses estimating the rate of increase (slope estimate) in T. tabaci larval and
adult populations over time in 2008
Timea Thrips Nb Slope estimate 95% conÞdence interval t P R 2 June/July Larvae 54 0.096 (0.049, 0.144) 4.06 0.002 0.241 Aug./Sept. Larvae 32 0.113 (0.026, 0.199) 2.66 0.012 0.191 June/July Adults 54 0.116 (0.070, 0.162) 5.07 ⬍0.001 0.331 Aug./Sept. Adults 32 0.187 (0.137, 0.238) 7.56 ⬍0.001 0.656
aThe growing season was split into two periods: June/July, consisting of thrips samples taken between 9 June and 21 July, and Aug./Sept.,
consisting of thrips samples taken between 4 Aug. and 5 Sept.
bN,total no. samples taken in the sample period (no. Þelds⫻ no. sample dates).
0 20 40 60 80 100
17-May 31-May 14-Jun 28-Jun 12-Jul 26-Jul 9-Aug 23-Aug 6-Sep
20 07 Per c ent a ge of s it e s wi th IYSV-in fe ct ed oni ons Santana Sedona Sherman Highlander Milestone Red Bull Santana Sedona Sherman Highlander Milestone Red Bull
0 20 40 60 80 100
17-May 31-May 14-Jun 28-Jun 12-Jul 26-Jul 9-Aug 23-Aug 6-Sep
2008 P e rc ent a ge of si te s w it h IY S V -in fe c te d o n io n s
Sedona Red Bull 1
Red Bull 2 Milestone 1 Milestone 2 Red Zeppelin
Sedona Red Bull 1
Red Bull 2 Milestone 1 Milestone 2 Red Zeppelin
A. 2007
B. 2008
Santana Sedona Sherman Highlander Milestone Red Bull Santana Sedona Sherman Highlander Milestone Red Bull
Fig. 5. Percentage of sites with IYSV-infected onions in 12 commercial Þelds in New York monitored in 2007 (A) and
densities,and year, Julian date, and field type were not signiÞcant predictors of Þnal IYSV levels. The model with the lowest residual variance included field type and
cumulative adults,though field type was not signiÞcant [IYSV level⫽ ⫺2.6422(intercept) ⫺ 1.0233(field type ⫽
seeded)⫹ 1.2627(cumulative adults)].
Results of analyses including the four separate cat-egories of thrips densities simultaneously were more complicated. There were signiÞcant interactions be-tween year and early larval densities, bebe-tween year and
late larval densities,and between year and adult
den-sities,so data from each year were analyzed separately. For 2007, there were no signiÞcant interaction terms. There was a signiÞcant positive relationship between late adult thrips densities and Þnal IYSV levels; higher late adult densities resulted in higher IYSV levels (late adults: N⫽ 10; F ⫽ 13.42; df ⫽ 1, 6.0; P ⫽ 0.011). All other terms, Julian date, field type, and early
larval, early adultand late larval densities, were not signiÞcant. The model with the lowest residual vari-ance included field type, early larval density, and late
adult density,though field type and early larval density were not signiÞcant [IYSV level ⫽
⫺2.6254(inter-cept)⫺ 2.2038(field type ⫽ seeded) ⫺ 0.4074(early
larvae)⫹ 0.8809(late adults)].
For 2008, there were signiÞcant interactions be-tween field type and early larval densities, and bebe-tween
field typeand late adult densities, and all main effects in the model were signiÞcant (Table 3). It was not possible to analyze the data separately by Þeld type when the model included all four thrips categories. Regression results shown are for the model that in-cluded both signiÞcant interactions.
For early larvae and late adult T. tabaci, there was a stronger positive relationship between thrips densities and Þnal IYSV levels in transplanted Þelds than in seeded
Þelds; the higher the density of early larvae or late adults, the higher the Þnal level of IYSV in transplanted Þelds. For seeded Þelds, the relationships were also positive but weaker with signiÞcantly shallower slopes.
Early adult thrips densityalso had a signiÞcant pos-itive relationship with Þnal IYSV level (P⬍ 0.001) and the relationship did not depend on Þeld type. For late
larval thrips densities,the relationship with Þnal IYSV
levelswas also signiÞcant but negative in both Þeld types, the lower the larval density the higher the Þnal level of IYSV (P⬍ 0.010).
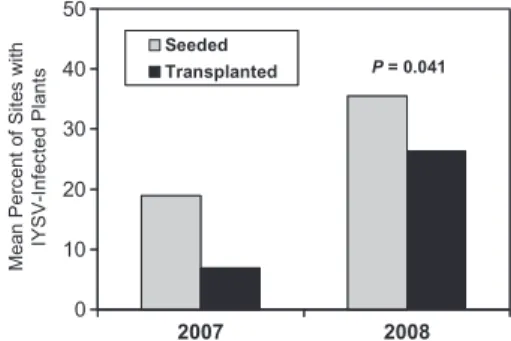
Overall there were signiÞcantly higher levels of IYSV in seeded Þelds than in transplanted Þelds (P⫽ 0.041) (Fig. 6). Julian date of the last sample was also signiÞcant (P⫽ 0.003), indicating that there were higher levels of IYSV in Þelds harvested later in the season.
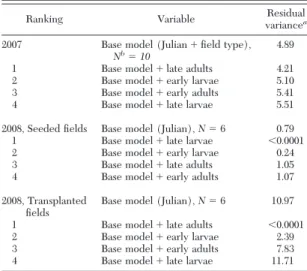
Relative Importance of Thrips Categories in Pre-dicting Final Levels of IYSV. In 2007, late adult thrips
densitieswere more important in predicting Þnal lev-els of IYSV than the other three thrips categories (Table 4). However, the differences in the amount of residual variance explained by each thrips category were not very large. This result was similar to the regression results when all four categories of thrips were simultaneously included in the model and only late adult thrips density was identiÞed as a signiÞcant predictor.
In 2008, the signiÞcant interactions between thrips
categoriesand field type were considered and the rel-ative signiÞcance of individual thrips categories was analyzed separately by Þeld type. For seeded Þelds in 2008, late larval thrips densities were the most impor-tant predictor of Þnal IYSV levels (Table 4). Unlike the 2007 analysis, there was a large difference between the residual variance explained by late larval densities compared with the residual variance explained by the other three thrips categories in predicting Þnal levels of IYSV. For transplanted Þelds, late adult thrips
den-sitieswere the most important predictor and the dif-ferences in residual variance explained by late adult
densitiesand the other three thrips categories were large (Table 4); late adult densities explained consid-erably more of the variation in the data than the next most important predictor. The second most important predictor of Þnal IYSV levels in both 2007 and 2008 was
early larval densities(Table 4).
Table 3. Results of a mixed model regression testing the
sig-nificance of Julian date of the last sample before harvest, field type, and early and late larval and adult densities of T. tabaci on final IYSV levels in 12 commercial onion fields
Independent variable Regression (N⫽ 12) Parameter estimate dfa F P Julian dateb 1, 1 47,721 0.0029 0.2519 Field typec 1, 1 247 0.0405 2.6260 Early larvaed 1, 1 842,464 0.0007 3.2590 Early adultsd 1, 1 7,654 0.0073 0.6216 Late larvaee 1, 1 4,291 0.0097 ⫺1.0305 Late adultse 1, 1 188 0.0463 1.2063 Early larvae⫻ Field type 1, 1 12,089 0.0058 ⫺2.8962 Late adults⫻ Field type 1, 1 573 0.0266 ⫺1.1412
a
Degrees of freedom are calculated using methods proposed by Kenward and Roger (1997).
b
Julian date is the last date a thrips sample was collected from a Þeld.
c
Field type is either a seeded or a transplanted Þeld. The default Þeld type was seeded. A negative value means IYSV levels were lower in seeded Þelds compared with transplanted Þelds, a positive value means IYSV levels were higher in seeded Þelds.
d
Early larvae and adults are the total no. thrips counted per Þeld on the Þrst two sample dates divided by the no. sites per Þeld.
e
Late larvae and adults are the total no. thrips counted per Þeld between 4 Aug. and 5 Sept. 2008, divided by the no. sites and the no. thrips sample dates for that Þeld.
0 10 20 30 40 50 2007 2008 IY S V -I nf ec te d P lant s Seeded Transplanted P = 0.041 M e an P erc ent of S it e s wi th Seeded Transplanted
Fig. 6. Mean percent of sites with IYSV-infected plants
in seeded and transplanted onion Þelds at the end of the season in 2007 and 2008.
Discussion
There were more T. tabaci larvae and adults in transplanted Þelds compared with seeded Þelds early in the season. Transplanted onions may have arrived already infested with T. tabaci from their point of origin, or they may have been preferentially colonized by native T. tabaci, or both. In New York, transplanted Þelds are usually the Þrst onion Þelds in the produc-tion system to be treated with insecticides for man-aging T. tabaci infestations (B.A.N., unpublished data), and this grower practice seems appropriate based on our data.
We hypothesized that transplanted Þelds might be at greater risk for higher levels of IYSV than seeded Þelds, but this was not the case. Both Þeld types showed evidence of infection at the same time and there was no consistent pattern suggesting that virus levels increased faster in one Þeld type compared with the other; IYSV remained at low levels in both Þeld types in June and July. Though transplanted Þelds had higher initial densities of thrips early in the season and symptomatic plants were found Þrst in transplant-ed Þelds, by the end of the season setransplant-edtransplant-ed Þelds had signiÞcantly higher levels of IYSV than transplanted Þelds. However, this situation could change if the proportion of transplants infected with IYSV imported into New York increases.
The relationship between thrips densities and IYSV levels was complicated. When both years were com-bined, and total thrips densities were considered, only cumulative adult thrips densities were a signiÞcant predictor of Þnal IYSV levels, cumulative larval
den-sities and Þeld type were not signiÞcant. Separating thrips into early and late larvae and adults and ana-lyzing each year separately revealed that late season larval and adult densities were more important in predicting Þnal IYSV levels than early season larval and adult densities. In 2007, late adult thrips densities were the most important thrips category predicting Þnal IYSV levels; the more adult thrips present late in the season the greater the percentage of sites with IYSV. In 2008, the relative importance of each thrips category depended on Þeld type. Late larval thrips density was the most important thrips category in seeded Þelds but, in this case, the relationship was negative; one of the seeded Þelds, the one with highest level of IYSV, had a relatively low level of thrips larvae late in the season and this one Þeld inßuenced the direction of the relationship. In transplanted Þelds, late adult thrips density was the most important pre-dictor and the relationship was positive, as in 2007. Early larval densities were consistently the second most important thrips category, but early adult den-sities did not explain much of the variation in the data. It was more difÞcult to assess the relative impor-tance of Þeld type, Julian date of the last sample, and thrips densities on Þnal IYSV levels because these variables were confounded. The mean Julian date of the last sample taken before harvest in transplanted Þelds was day 230.6, and for seeded Þelds it was more than 1 wk later at day 239.7. We found a signiÞcant relationship between Julian date of the last sample before harvest and late larval and late adult thrips densities; the longer plants were in the Þeld, the larger the late thrips populations. We also found a trend in Þnal IYSV levels and Þeld type; seeded Þelds had higher levels of IYSV than transplanted Þelds, and Þeld type was signiÞcant in 2008, but not in 2007. It is possible that harvest date and late season thrips den-sities may be more important in determining Þnal IYSV levels than Þeld type. Schwartz et al. (2004) observed that very early maturing onion cultivars tended to have a lower incidence of IYSV.
There were low levels of IYSV throughout June and July of both years (⬍12% of sites in each Þeld had IYSV-infected plants). This suggests that the initial primary spread of IYSV from inoculum sources into onion Þelds by T. tabaci occurred infrequently in 2007 and 2008. If there was secondary spread of the virus within Þelds during June and July, it was spatially localized and occurred at a smaller scale than the distances between our sample sites. Gent et al. (2004) found limited positive spatial autocorrelation in IYSV incidence in two Þelds sampled in Colorado ⬇7 d before harvest and concluded that secondary spread was limited. Schwartz et al. (2008a) also found low levels of spatial autocorrelation of IYSV incidence and concluded that there was limited secondary spread. Fichtner et al. (2004) suggested that the spatial de-pendency of IYSV occurred over very short distances. In Þeld variety trials in Washington, du Toit (2005) found a gradient in incidence and severity of IYSV that was attributed to immigration of viruliferous adults from adjacent vegetation, and suggested that there
Table 4. A ranking of the relative importance of four
catego-ries of T. tabaci in predicting final IYSV levels in commercial onion fields in western New York in 2007 and 2008
Ranking Variable Residual
variancea
2007 Base model (Julian⫹ Þeld type),
Nb⫽ 10
4.89
1 Base model⫹ late adults 4.21
2 Base model⫹ early larvae 5.10
3 Base model⫹ early adults 5.41
4 Base model⫹ late larvae 5.51
2008, Seeded Þelds Base model (Julian), N⫽ 6 0.79
1 Base model⫹ late larvae ⬍0.0001
2 Base model⫹ early larvae 0.24
3 Base model⫹ late adults 1.05
4 Base model⫹ early adults 1.07
2008, Transplanted Þelds
Base model (Julian), N⫽ 6 10.97
1 Base model⫹ late adults ⬍0.0001
2 Base model⫹ early larvae 2.39
3 Base model⫹ early adults 7.83
4 Base model⫹ late larvae 11.71
aThe residual variance is the amount of variation that is not
ex-plained by the regression model. The category with the lowest re-sidual variance is considered the most important category because it explains more of the variance in the data.
bThe Highlander variety was harvested before late thrips data were
collected so this pair of Þelds is excluded from the analyses reducing
was limited secondary movement of viruliferous thrips within onion Þelds. This corresponds with data col-lected on T. tabaci and tospoviruses in other crops. In Greece, T. tabaci in tobacco are the primary vector of tomato spotted wilt virus (TSWV) (Bunyaviridae: To-spovirus), and the dispersal behavior of viruliferous T.
tabaciresulted in a very limited and localized pattern of secondary spread (Chatzivassiliou 2008). TSWV in other crops, where multiple thrips species are vectors includ-ing T. tabaci, is also considered to have only limited secondary spread (Latham and Jones 1997, Coutts et al. 2004). Similar to TSWV, the spread of IYSV by T. tabaci in onion may be monocyclic, but increasing levels of IYSV late in the season have not been tested for spatial autocorrelation yet to conÞrm this hypothesis.
Though we did not collect T. tabaci dispersal data, the rate at which adult thrips populations increased between August and September was much greater than the population growth rate for adults between June and July, and there was very little overlap be-tween the 95% conÞdence intervals. This was not true for larvae, where the 95% population growth rate con-Þdence intervals for June/July and August/September had considerable overlap. These results suggest that adult immigration into Þelds late in the season may be increasing adult densities in unharvested Þelds above that expected by within Þeld reproduction rates alone. This is supported by data showing T. tabaci often have two peak ßights in New York, one in May and one in August. The Þrst peak in May is the result of T. tabaci migrating from neighboring Þelds of alfalfa/red clover and wheat into onion Þelds (Gangloff 1999). As onion Þelds are harvested in August, the second peak in adult ßight may be caused by an increase in adult dispersal from senescing onion Þelds into onion Þelds that are still growing.
August was also the time when the proportion of sites with IYSV-infected plants began to increase rap-idly. This was particularly true in 2008, when we de-tected dramatic increases in virus levels in a number of Þelds (e.g., in a seeded Red Bull Þeld the percentage of sites with IYSV-infected plants increased from 27 to 73% between 20 and 27 August 2008). In addition, overall levels of IYSV were much higher in 2008 com-pared with 2007. This might be related to the signif-icantly higher populations of late adult T. tabaci found in 2008, and the higher ratio of adults-to-larvae ob-served in 2008 compared with 2007. Once their native Þelds are harvested in late July/early August, virulif-erous adults may move to nearby unharvested Þelds, increasing the spread of IYSV.
Another potential explanation for the increase in IYSV levels in August may be a change in the efÞ-ciency of the T. tabaci population that transmits IYSV.
T. tabaciin onion Þelds have multiple reproductive modes in New York: thelytoky, the production of un-fertilized females by females; arrhenotoky, the pro-duction of males from unfertilized eggs and females from fertilized eggs; and deuterotoky, the production of males and females by unfertilized eggs (Nault et al. 2006). In general, NY populations of T. tabaci in June and July are primarily thelytokous, with very few
males produced. By August, the populations shift to primarily arrhenotokous and/or deuterotokous (Nault et al. 2006). Chatzivassiliou et al. (2002) showed that arrhenotokous populations of T. tabaci collected from leeks were able to transmit TSWV, while thrips from thelytokous populations collected from leek were nonvectors. Within arrhenotokous populations collected from tobacco, male T. tabaci had a higher successful transmission rate of TSWV than females (Chatzivassiliou et al. 2007). There are no data available on the relative transmission efÞcacy of the-lytokous and arrhenotokous populations of T. tabaci and IYSV in New York. Additional research is needed to understand the relative importance of reproductive mode and other factors that affect vector competence and transmission efÞcacy, such as virus isolates (Pali-wal 1974, Tedeschi et al. 2001), host plants (Chatzivas-siliou et al. 2002), genetic inheritance (Cabrera-La Rosa and Kennedy 2007), and physiological barriers (Nagata et al. 1999b).
Implications for Management. Transplanted onion Þelds had signiÞcantly higher levels of thrips early in the season, and there was a positive relationship be-tween early larval thrips densities in transplanted Þelds and Þnal levels of IYSV. This suggests that man-agement of thrips early in the season in transplanted Þelds may help prevent high levels of IYSV late in the season in those Þelds. However, late season occur-rences of IYSV in transplanted Þelds may not impact bulb grades or yields because few plants showed IYSV symptoms that could affect photosynthesis and bulb development before harvest, and most of the plants that reacted positively for IYSV using DAS-ELISA were asymptomatic (C.L.H., unpublished data). Re-ducing thrips populations late in the season in trans-planted Þelds may be the most important management strategy for IYSV because of the potential impact em-igrating viruliferous thrips can have on neighboring Þelds once the transplanted Þelds are harvested. Vir-uliferous thrips that disperse from harvested Þelds and colonize adjacent Þelds can rapidly increase the pri-mary spread of IYSV in those Þelds.
In general, onion growers in New York do not at-tempt to manage thrips in Þelds 1Ð2 wks before harvest because⬎30Ð50% of the leaves have collapsed, and adequate spray coverage for thrips control is not pos-sible. During this time, larvae can complete develop-ment on infected plants and may be dramatically in-creasing the population of viruliferous adults. If future studies show that IYSV negatively impacts onion yields in New York, growers may consider more ag-gressive thrips control measures in early harvested Þelds to prevent viruliferous adults from moving the virus to onions that are still developing.
In addition, the Elba muck and many of the onion producing areas in the Great Lakes region of the U.S. resemble spatial checkerboards of early- and late-har-vested onion Þelds. This spatial pattern enables adults emigrating from harvested Þelds to travel a short dis-tance to Þnd a Þeld that is still growing. Concentrating Þelds that will be harvested around the same time in the same geographic location may minimize
immigra-tion of IYSV-infected adults into Þelds that are not harvested, and slow the spread of IYSV to those Þelds. Results from small-plot studies of thrips that are vec-tors of TSWV (T. tabaci, western ßower thrips,
Fran-kliniella occidentalis [Pergande], and the tomato thrips, F. schultzei [Trybom]) suggested that 23 m was a ÔsafeÕ planting distance to successfully limit the dis-persal of viruliferous thrips from potential TSWV sources to the pepper crop (Latham and Jones 1997). These studies also found a more frequent spread of TSWV to sites downwind from the infection source. Manipulating the spatial arrangement of onion Þelds based on harvest date and the most prevalent wind direction may be another cultural control option on-ion growers can use to help mitigate the impact of this invasive pathogen.
Acknowledgments
We appreciate assistance from technicians and summer research assistants including E. Abbott, M. Agnello, J. Berg-man, C. Boutard-Hunt, B. English-Loeb, T. Evans, C. Fox, P. Fox, M. Hessney, C. McGreggor, H. Schoonover, E. Smith, K. Straight, and R. Taylor. We also thank R. L. Strawderman and F. Vermeylen for statistical assistance, and D. Shah for as-sistance in developing an IYSV sampling plan. This project was funded through several granting agencies including the New York Onion Research and Development Program, NY Farm Viability Institute, and USDA CSREES Hatch.
References Cited
Abad, J. A., J. Speck, S. K. Mohan, and J. W. Moyer. 2003. Diversity of the Iris yellow spot virus N gene in the USA. Phytopathology 93 (suppl.): S1.
Cabrera-La Rosa, J. C., and G. G. Kennedy. 2007. Thrips tabaci and tomato spotted wilt virus: inheritance of vector competence. Entomol. Exp. Appl. 124:161Ð166. Chatzivassiliou, E. K. 2008. Management and spread of
To-mato spotted wilt virusin tobacco crops with insecticides based on estimates of thrips infestation and virus inci-dence. Plant Dis. 92: 1012Ð1020.
Chatzivassiliou, E. K., D. Peters, and N. I. Katis. 2002. The efÞciency by which Thrips tabaci populations transmit
Tomato spotted wilt virusdepends on their host prefer-ence and reproductive strategy. Phytopathology 92: 603Ð 609.
Chatzivassiliou, E. K., D. Peters, and N. I. Katis. 2007. The role of weeds in the spread of Tomato spotted wilt virus by
Thrips tabaci (Thysanoptera: Thripidae) in tobacco crops. J. Phytopathol. 155: 699 Ð705.
Corteˆs, I., I. C. Livieratos, A. Derks, D. Peters, and R. Kormelink. 1998. Molecular and serological character-ization of Iris Yellow Spot Virus, a new and distinct to-spovirus species. Phytopathology 88: 1276 Ð1282. Coutts, B. A., M. L. Thomas-Carroll, and R.A.C. Jones. 2004.
Patterns of spread of Tomato spotted wilt virus in Þeld crops of lettuce and pepper: spatial dynamics and vali-dation of control measures. Ann. Appl. Biol. 145: 231Ð245. Creamer, R., S. Sanogo, A. Moya, J. Romero, R. Molina-Bravo, and C. Cramer. 2004. Iris yellow spot virus on onion in New Mexico. Plant Dis. 88: 1049.
Crowe, F. J., and H. R. Pappu. 2005. Outbreak of Iris yellow
spot virusin onion seed crops in central Oregon. Plant Dis. 89: 105.
du Toit, L. 2005. Susceptibility of storage onion cultivars to iris yellow spot in the Columbia Basin of Washington, 2004. Biol. Cult. Tests. 20: V006.
du Toit, L. J., H. R. Pappu, K. L. Druffel, and G. Q Pelter. 2004a. Iris yellow spot virus in onion bulb and seed crops in Washington. Plant Dis. 88: 222.
du Toit, L., G. Pelter, and H. Pappu. 2004b. IYSV challenges to the onion seed industry in Washington, pp. 213Ð217. In Program and Proceedings of the 2004 National Allium Research Conference, 8 Ð10 December 2004, Grand Junc-tion, CO. Mesa County Cooperative Extension, Grand Junction, CO.
Evans, C. K., S. Bag, E. Frank, J. R. Reeve, C. Ransom, D. Drost, and H. R. Pappu. 2009a. Natural infection of Iris
yellow spot virusin twoscale saltbush (Atriplex
micran-tha) growing in Utah. Plant Dis. 93: 430.
Evans, C. K., S. Bag, E. Frank, J. R. Reeve, C. Ransom, D. Drost, and H. R. Pappu. 2009b. Green foxtail (Setaria
viridis), a naturally infected grass host of Iris yellow spot
virusin Utah. Plant Dis. 93: 670.
Fichtner, S. M., D. H. Gent, H. F. Schwartz, W. S. Cranshaw, L. Mahaffey, and R. Khosla. 2004. Geospatial relation-ships of Iris yellow spot virus and thrips to onion produc-tion in Colorado, 2004, pp. 149 Ð151. In Program and Proceedings of the 2004 National Allium Research Con-ference, 8 Ð10 December 2004, Grand Junction, CO. Mesa County Cooperative Extension, Grand Junction, CO. Fuchs, M., C. Hoepting, C. MacNeil, and J. Gibbons. 2007.
Results of 2006 preliminary survey for IYSV in New York, pp. 125Ð127. In Proceedings of the 2007 Empire State Fruit and Vegetable Expo., 13Ð15 Feb. 2007, Syracuse, NY. Cornell Cooperative Extension, New York State Agricul-tural Experiment Station, Geneva, NY.
Gangloff, J. L. 1999. Population dynamics and insecticide resistance of onion thrips, Thrips tabaci Lindeman (Thys-anoptera: Thripidae) in Onions. Ph.D. dissertation, Cor-nell University, Ithaca, NY.
Gent, D. H., L. J. du Toit, S. F. Fichtner, S. K. Mohan, H. R. Pappu, and H. F. Schwartz. 2006. Iris yellow spot virus: An emerging threat to onion bulb and seed production. Plant Dis. 90: 1468 Ð1480.
Gent, D. H., H. F. Schwartz, and R. Khosla. 2004a. Distri-bution and incidence of Iris yellow spot virus in Colorado and its relation to onion plant population and yield. Plant Dis. 88: 446 Ð 452.
Gent, D. H., H. F. Schwartz, and R. Khosla. 2004b. Manag-ing Iris yellow spot virus of onion with cultural practices, host genotype, and novel chemical treatments. Phytopa-thology 94 (suppl.): S34.
Hall, J. M., K. Mohan, E. A. Knott, and J. W. Moyer. 1993. Tospoviruses associated with Scape Blight on onion
(Al-lium cepa) seed crops in Idaho. Plant Dis. 77: 952. Hoepting, C. A., H. F. Schwartz, and H. R. Pappu. 2007. First
report of Iris yellow spot virus on onion in New York. Plant Dis. 91: 327.
Hoepting, C. A., J. K. Allen, K. D. Vanderkooi, M. Y. Hovius, M. F. Fuchs, H. R. Pappu, and M. R. McDonald. 2008. First report of Iris yellow spot virus on onion in Canada. Plant Dis. 92: 318.
Jones, D. R. 2005. Plant viruses transmitted by thrips. Eur. J. Plant Pathol. 113: 119 Ð157.
Kenward, M. G., and Roger, J. H. 1997. Small sample infer-ence for Þxed effects from restricted maximum likeli-hood. Biometrics 53: 983Ð997.
Kritzman, A., M. Lampel, B. Raccah, and A. Gera. 2001. Distribution and transmission of Iris yellow spot virus. Plant Dis. 85: 838 Ð 842.
Latham, L. J., and R.A.C. Jones. 1997. Occurrence of tomato spotted wilt tospovirus in native ßora, weeds, and horti-cultural crops. Aust. J. Agr. Res. 48: 359 Ð369.
McLachlan, G. J., and D. Peel. 2000. Finite mixture models. Wiley, New York.
Miller, M. E., R. R. Saldana, M. C. Black, and H. R. Pappu. 2006. First report of Iris yellow spot virus on onion
(Al-lium cepa) in Texas. Plant Dis. 90: 1359.
Moyer, J. W., J. A. Abad, D. Ullman, and K. Mohan. 2003. INSV and IYSV; the other tospoviruses in the United States. Phytopathology 93 (suppl.): S115.
Mullis, S. W., D. B. Langston, Jr., R. D. Gitaitis, J. L. Sher-wood, A. C. Csinos, D. G. Riley, A. N. Sparks, R. L. Torrance, and M. J. Cook, IV. 2004. First report of vidalia onion (Allium cepa) naturally infected with Tomato
spot-ted wilt virusand Iris yellow spot virus (Family
Bunya-viridae,Genus Tospovirus) in Georgia. Plant Dis. 88: 1285. Nagata, T., A.C.L. Almeida, R. de O. Resende, and A. C. de
A´ vila. 1999a. The identiÞcation of the vector species of
Iris yellow spot tospovirus occurring on onion in Brazil. Plant Dis. 83: 399.
Nagata, T., A. K. Inoue-Nagata, H. M. Smid, R. Goldbach, and D. Peters. 1999b. Tissue tropism related to vector com-petence of Frankliniella occidentalis for tomato spotted wilt tospovirus. J. Gen. Virol. 80: 507Ð515.
Nault, B. A., and A. M. Shelton. 2008. Insecticide efÞcacy and timing of sprays for onion thrips control, pp. 52Ð56.
InProceedings of the 2008 Empire State Fruit and Veg-etable Expo., 12Ð14 February 2008. Syracuse, NY. Cornell Cooperative Extension, New York State Agricultural Ex-periment Station, Geneva, NY.
Nault, B. A., A. M. Shelton, J. L. Gangloff-Kaufmann, M. E. Clark, J. L. Werren, J. C. Cabrera-La Rosa, and G. G. Kennedy. 2006. Reproductive modes in onion thrips (Thysanoptera: Thripidae) populations from New York onion Þelds. Environ. Entomol. 35: 1264 Ð1271. Nault, B. A., M. Fuchs, C. Hsu, E. Smith, and A. Shelton.
2008a. Potential sources of IYSV, relationship between IYSV and onion thrips, and thrips control in New York, pp. 9 Ð12. In Proceedings of the 2008 Wisconsin Muck Crops Research Update, 4 March 2008, Portage, WI. Uni-versity of Wisconsin Extension, Madison, WI.
Nault, B. A., C. Hsu, E. Smith, A. Shelton, M. Fuchs, C. Hoepting, and A. DiTommaso. 2008b. Identifying sources of IYSV in New YorkÕs cropping system, pp. 67Ð72. In Program and Proceedings of the 2008 National Allium Research Conference, 10 Ð13 December 2008, Savannah, GA. University of Georgia, Athens, GA.
Nischwitz, C., R. D. Gitaitis, S. W. Mullis, A. S. Csinos, D. B. Langston, Jr., and A. N. Sparks. 2007. First report of Iris
yellow spot virusin spiny sowthistle (Sonchus asper) in the United States. Plant Dis. 91: 1518.
Paliwal, Y. C. 1974. Some properties and thrip transmission of tomato spotted wilt virus in Canada. Can J. Botany 52: 1177Ð1182.
Pappu, H., and M. Matheron. 2008. Characterization of Iris
yellow spot virusfrom onion in Arizona. Plant Health Prog. (doi: 10.1094/PHP-2008 Ð 0711-01-BR).
Poole, G. J., H. R. Pappu, R. M. Davis, and T. A. Turini. 2007. Increasing outbreaks and impact of Iris yellow spot virus in bulb and seed onion crops in the Imperial and Antelope Valleys of California. Plant Health Prog. (doi: 10.1094/ PHP-2007Ð 0508-01-BR).
Pozzer, L., I. C. Bezerra, R. Kormelink, M. Prins, D. Peters,
R. de O. Resende, and A. C. de A´ vila. 1999.
Character-ization of a tospovirus isolate of iris yellow spot virus associated with a disease in onion Þelds in Brazil. Plant Dis. 83: 345Ð350.
Reiners, S., and C. H. Petzoldt. 2009. Integrated crop and pest management guidelines for commercial vegetable production. Cornell Cooperative Extension, Geneva, NY. R-Project. 2008. R v. 2.8.1. (http://www.r-project.org/). Robe`ne-Soustrade, I., B. Hostachy, M. Roux-Cuvelier, J.
Mi-natchy, M. He´dont, R. Pallas, A. Couteau, N. Cassam, and G. Wuster. 2006. First report of Iris yellows spot virus in onion bulb- and seed-production Þelds in Re´union Island. Plant Pathol. 55: 288.
Sampangi, R. K., S. K. Mohan, and H. R. Pappu. 2007. Iden-tiÞcation of new alternative weed hosts for Iris yellow spot
virusin the PaciÞc Northwest. Plant Dis. 91: 1683. SAS Institute. 2002. v. 9.1. SAS Institute, Cary, NC. Schwartz, H. F., W. M. Brown, Jr., T. Blunt, and D. H. Gent.
2002. Iris yellow spot virus on onion in Colorado. Plant Dis. 86:560, 2002.
Schwartz, H. F., D. H. Gent, S. F. Fichtner, R. W. Hammon, and R. Khosla. 2004. Integrated management of iris yel-low spot virus in onion, pp. 207Ð212. In Program and Proceedings of the 2004 National Allium Research Con-ference, 8 Ð10 December 2004, Grand Junction, CO. Mesa County Cooperative Extension, Grand Junction, CO. Schwartz, H. F., S. F. Fichtner, D. H. Gent, R. Khosla, D. J.
Inman, W. S. Cranshaw, M. A Camper, and L. A. Ma-haffey. 2008a. Spatial and temporal distribution of thrips and IYSV of onion in Colorado, pp. 73Ð76. In Program and Proceedings of the 2008 National Allium Research Con-ference, 10 Ð13 December 2008, Savannah, GA. University of Georgia, Athens, GA.
Schwartz, H. F., K. Otto, S. Szostek, C. Boateng, W. S. Cran-shaw, M. A. Camper, and L. Mahaffey. 2008b. Thrips and IYSV sources in Colorado onion production systems, pp. 44 Ð 47. In Program and Proceedings of the 2008 National Allium Research Conference, 10 Ð13 December 2008, Sa-vannah, GA.
Shock, C. C., E. Feibert, L. Jensen, S. K. Mohan, and L. D. Saunders. 2008. Onion variety response to iris yellow spot virus. Horttechnology 18: 539 Ð544.
Smith, T. N., S. J. Wylie, B. A. Coutts, and R.A.C. Jones. 2006. Localized distribution of Iris yellow spot virus within leeks and its reliable large-scale detection. Plant Dis. 90: 729 Ð 733.
Tedeschi, R., M. Ciuffo, G. Mason, P. Roggero, and L. Tavella. 2001. Transmissibility of four tospoviruses by a thelytok-ous population of Thrips tabaci from Liguria, northwest-ern Italy. Phytoparasitica 29: 37Ð 45.
Ullman, D. E., R. Meideros, L. R. Campbell, A. E. Whitfield, J. L. Sherwood, and T. L. German. 2002. Thrips as vec-tors of tospoviruses. Adv. Bot. Res. 36: 113Ð140. van de Wetering, F., M. van der Hoek, R. Goldbach, C.
Mollema, and D. Peters. 1999. Variation in tospovirus transmission between populations of Frankliniella
occi-dentalis(Thysanoptera: Thripidae). B. Entomol. Res. 89: 579 Ð588.
Whitfield, A. E., D. E. Ullman, and T. L. German. 2005. Topsovirus-thrips interactions. Annu. Rev. Phytopathol. 43: 459 Ð 489.