Recombinagenic activity of four compounds in the standard and high bioactivation crosses of Drosophila melanogaster in the wing spot test
10
0
0
Texte intégral
(2) 386. 13 12 19 18 17 10 20 20 20 20 20 20 20 20 20 20 20 10 20 20 20 20 20 20. Potassium chromate (6 h) ST MH 0.0 5.0 10.0 20.0 50.0 100.0 BH 0.0 5.0 10.0 20.0 50.0 100.0 HB MH 0.0 5.0 10.0 20.0 50.0 100.0 BH 0.0 5.0 10.0 20.0 50.0 100.0. Conc. (mM) No. of flies. 20 20 20 20 3 20 20 20 20 4 20 20 20 20 2 20 20 20 20. Typeb. Potassium chromate (48 h) ST MH 0.0 0.5 1.0 2.0 5.0 BH 0.0 0.5 1.0 2.0 5.0 HB MH 0.0 0.5 1.0 2.0 5.0 BH 0.0 0.5 1.0 2.0. Crossa. 0.46 0.83 0.68 0.50 0.76 1.00 0.30 0.20 0.20 0.45 0.30 0.40 0.25 0.20 0.35 0.80 0.70 1.00 0.30 0.25 0.40 0.45 0.65 0.45. 0.30 1.00 3.10 9.40 22.67 0.40 0.05 1.10 1.05 3.50 0.45 0.20 1.40 1.90 26.00 0.25 0.40 0.40 0.70 (6) (10)e (13)e (9)e (13)e (10)e (6) (4)e (4)e (9)e (6)e (8)e (5) (4)e (7)e (16)⫹ (14)⫹ (10)⫹⫹ (6) (5)e (8)e (9)e (13)e (9)e. (6) (20)⫹⫹ (62)⫹⫹⫹ (188)⫹⫹⫹ (68)⫹⫹⫹ (8) (1)– – – (22)⫹⫹ (21)⫹ (14)⫹⫹⫹ (9) (4)– – (28)⫹⫹ (38)⫹⫹⫹ (52)⫹⫹⫹ (5) (8)e (8)e (14)⫹. Small single spots (1–2 cells) m ⫽ 2. 0.08 0.42 0.37 0.50 0.76 0.30 0.00 0.05 0.05 0.00 0.20 0.10 0.10 0.40 0.35 0.40 0.40 0.60 0.00 0.00 0.05 0.05 0.05 0.15. 0.10 0.20 1.45 3.95 17.33 0.00 0.00 0.10 0.10 0.25 0.05 0.30 0.70 1.70 12.50 0.00 0.00 0.00 0.25 (1) (5)e (7)e (9)⫹ (13)⫹⫹ (3)e (0) (1)e (1)e (0)e (4)e (2)e (2) (8)e (7)e (8)e (8)e (6)⫹ (0) (0)e (1)e (1)e (1)e (3)e. (2) (4)e (29)⫹⫹⫹ (79)⫹⫹⫹ (52)⫹⫹⫹ (0) (0)e (2)e (2)e (1)e (1) (6)e (14)⫹⫹⫹ (34)⫹⫹⫹ (25)⫹⫹⫹ (0) (0)e (0)e (5)⫹. Large single spots (⬎2 cells) m ⫽ 5. 0.00 0.75 1.21 0.56 0.71 0.80 0.00 0.00 0.00 0.00 0.00 0.00 0.05 0.35 0.70 0.75 0.25 0.70 0.00 0.00 0.00 0.00 0.00 0.00. 0.05 0.90 2.45 6.75 15.33 0.00 0.00 0.00 0.00 0.00 0.00 0.60 1.55 3.90 13.00 0.00 0.00 0.00 0.00 (0) (9)⫹⫹ (23)⫹⫹⫹ (10)⫹⫹ (12)⫹⫹ (8)⫹⫹ (0) (0)e (0)e (0)e (0)e (0)e (1) (7)⫹ (14)⫹⫹⫹ (15)⫹⫹⫹ (5)e (7)⫹⫹ (0) (0)e (0)e (0)e (0)e (0)e. (1) (18)⫹⫹⫹ (49)⫹⫹⫹ (135)⫹⫹⫹ (46)⫹⫹⫹ (0) (0)e (0)e (0)e (0)e (0) (12)⫹⫹⫹ (31)⫹⫹⫹ (78)⫹⫹⫹ (26)⫹⫹⫹ (0) (0)e (0)e (0)e. Twin spots m⫽5. Spots per fly (no. of spots) statistical diagnosisc. Table I. Summary of results obtained in the Drosophila wing spot test. 0.54 2.00 2.26 1.56 2.24 2.10 0.30 0.25 0.25 0.45 0.50 0.50 0.40 0.95 1.40 1.95 1.35 2.30 0.30 0.25 0.45 0.50 0.70 0.60. 0.45 2.10 7.00 20.10 55.33 0.40 0.05 1.20 1.15 3.75 0.50 1.10 3.65 7.50 51.50 0.25 0.40 0.40 0.95 (7) (24)⫹⫹⫹ (43)⫹⫹⫹ (28)⫹⫹ (38)⫹⫹⫹ (21)⫹⫹⫹ (6) (5)e (5)e (9)e (10)e (10)e (8) (19)⫹ (28)⫹⫹⫹ (39)⫹⫹⫹ (27)⫹⫹⫹ (23)⫹⫹⫹ (6) (5)e (9)e (10)e (14)e (12)e. (9) (42)⫹⫹⫹ (140)⫹⫹⫹ (402)⫹⫹⫹ (166)⫹⫹⫹ (8) (1)– – – (24)⫹⫹ (23)⫹⫹ (15)⫹⫹⫹ (10) (22)⫹ (73)⫹⫹⫹ (150)⫹⫹⫹ (103)⫹⫹⫹ (5) (8)e (8)e (19)⫹⫹. Total spots m⫽2. 0.54 2.00 2.16 1.39 2.00 2.10 0.30 0.25 0.25 0.45 0.50 0.50 0.35 0.90 1.35 1.85 1.30 2.00 0.30 0.25 0.45 0.50 0.70 0.60. (7) (24) (41) (25) (34) (21) (6) (5) (5) (9) (10) (10) (7) (18) (27) (37) (26) (20) (6) (5) (9) (10) (14) (12). 0.45 (9) 2.10 (42) 6.80 (136) 19.50 (390) 53.67 (161) 0.40 (8) 0.05 (1) 1.20 (24) 1.15 (23) 3 .75 (15) 0.50 (10) 1.05 (21) 3.45 (69) 7.05 (141) 51.00 (102) 0.25 (5) 0.40 (8) 0.40 (8) 0.95 (19). mwh clones. 1.71 2.96 3.37 3.44 3.82 2.71 1.33 2.60 1.80 1.56 2.20 1.70 1.43 3.89 3.52 3.32 3.08 3.15 1.00 1.00 1.67 1.70 1.43 2.00. 2.33 2.48 2.71 2.59 2.65 1.13 1.00 1.42 1.52 1.47 1.90 3.71 2.90 3.28 2.44 1.00 1.13 1.13 1.95. Mean mwh clone size class. nc. nc. nc. nc. 0.9 4.3 13.9 40.0 110.0 0.8 0.1 2.5 2.4 7.7 1.0 2.2 7.1 14.4 104.5 0.5 0.8 0.8 1.9. Observed. 0.3 0.3 1.4. 1.1 6.0 13.4 103.5. –0.7 1.6 1.5 6.9. 3.4 13.0 39.0 109.1. Control corrected. Clone formation per 105 cells per cell divisiond. M.A.Spano´ et al..
(3) 00 00 04 11 13 40 50 30 34 30 40 30 30 50 57 20. p–Dimethylaminoazobenzene ST MH 0.0 0.5 1.0 5.0 10.0 HB MH 0.0 1.0 2.0 5.0 10.0 BH 0.0 1.0 2.0 5.0 10.0 20.0. Conc. (mM) No. of flies. 30 20 30 30 20 10 3 30 20 29 30 30 10 20 30 20 30 30 21 10 30 20 30 30 30 10 20. Typeb. Cyclophosphamide ST MH 0.0 0.1 0.5 1.0 2.0 3.0 5.0 BH 0.0 0.1 0.5 1.0 2.0 3.0 5.0 HB MH 0.0 0.1 0.5 1.0 2.0 3.0 BH 0.0 0.1 0.5 1.0 2.0 3.0 5.0. Crossa. Table I. Cont.. 0.46 0.49 0.48 0.36 0.46 0.47 0.48 0.90 1.85 2.43 0.20 0.37 0.33 0.24 0.35 0.45. (46) (49)– – (50)– – (4)– (6)e (19) (24)– (27)⫹ (63)⫹⫹⫹ (73)⫹⫹⫹ (8) (11)e (10)e (12)e (20)e (9)e. 0.47 (14) 0.25 (5)– – 1.33 (40)⫹⫹⫹ 3.67 (110)⫹⫹⫹ 5.35 (107)⫹⫹⫹ 9.10 (91)⫹⫹⫹ 56.67 (170)⫹⫹⫹ 0.47 (14) 0.30 (6)– 0.66 (19)e 1.27 (38)⫹⫹⫹ 2.70 (81)⫹⫹⫹ 4.40 (44)⫹⫹⫹ 6.35 (127)⫹⫹⫹ 0.47 (14) 0.75 (15)e 1.50 (45)⫹⫹⫹ 4.23 (127)⫹⫹⫹ 11.90 (250)⫹⫹⫹ 21.10 (211)⫹⫹⫹ 0.37 (11) 0.70 (14)e 0.57 (17)e 1.40 (42)⫹⫹⫹ 2.47 (74)⫹⫹⫹ 2.50 (25)⫹⫹⫹ 3.30 (66)⫹⫹⫹. Small single spots (1–2 cells) m ⫽ 2. 0.07 0.13 0.09 0.00 0.08 0.03 0.06 0.17 0.47 0.80 0.03 0.07 0.00 0.00 0.07 0.00. 0.03 0.00 0.23 0.53 1.20 2.30 9.00 0.00 0.00 0.03 0.17 0.53 0.60 0.70 0.00 0.20 0.27 1.03 3.14 5.80 0.03 0.05 0.03 0.17 0.37 0.30 0.25 (7) (13)– (9)– – (0)– (1)e (1) (3)e (5)e (16)⫹⫹⫹ (24)⫹⫹⫹ (1) (2)e (0)e (0)e (4)e (0)e. (1) (0)e (7)⫹ (16)⫹⫹⫹ (24)⫹⫹⫹ (23)⫹⫹⫹ (27)⫹⫹⫹ (0) (0)e (1)e (5)⫹ (16)⫹⫹⫹ (6)⫹⫹⫹ (14)⫹⫹⫹ (0) (4)⫹ (8)⫹⫹ (31)⫹⫹⫹ (66)⫹⫹⫹ (58)⫹⫹⫹ (1) (1)e (1)e (5)e (11)⫹⫹ (3)e (5)⫹. Large single spots (⬎2 cells) m ⫽ 5. 0.06 0.05 0.04 0.00 0.15 0.03 0.04 0.30 0.47 0.70 0.00 0.00 0.00 0.00 0.00 0.00. 0.03 0.05 0.07 0.20 0.25 0.50 2.33 0.00 0.00 0.00 0.00 0.00 0.00 0.00 0.03 0.05 0.07 0.27 1.33 1.40 0.00 0.00 0.00 0.00 0.00 0.00 0.00 (6) (5)– – (4)– – (0)e (2)e (1) (2)e (9)⫹⫹ (16)⫹⫹⫹ (21)⫹⫹⫹ (0) (0)e (0)e (0)e (0)e (0)e. (1) (1)e (2)e (6)e (5)⫹ (5)⫹⫹ (7)⫹⫹⫹ (0) (0)e (0)e (0)e (0)e (0)e (0)e (1) (1)e (2)e (8)⫹ (28)⫹⫹⫹ (14)⫹⫹⫹ (0) (0)e (0)e (0)e (0)e (0)e (0)e. Twin spots m⫽5. Spots per fly (no. of spots) statistical diagnosisc. 0.59 0.67 0.61 0.36 0.69 0.52 0.58 1.37 2.79 3.93 0.22 0.43 0.33 0.24 0.42 0.45. (59) (67)– – (63)– – (4)– – (9)e (21) (29)– (41)⫹⫹⫹ (95)⫹⫹⫹ (118)⫹⫹⫹ (9) (13)e (10)e (12)e (24)e (9)e. 0.53 (16) 0.30 (6)– – 1.63 (49)⫹⫹⫹ 4.40 (132)⫹⫹⫹ 6.80 (136)⫹⫹⫹ 11.90 (119)⫹⫹⫹ 68.00 (204)⫹⫹⫹ 0.47 (14) 0.30 (6)– 0.69 (20)e 1.43 (43)⫹⫹⫹ 3.23 (97)⫹⫹⫹ 5.00 (50)⫹⫹⫹ 7.05 (141)⫹⫹⫹ 0.50 (15) 1.00 (20)⫹ 1.83 (55)⫹⫹⫹ 5.53 (166)⫹⫹⫹ 16.38 (344)⫹⫹⫹ 28.30 (283)⫹⫹⫹ 0.40 (12) 0.75 (15)e 0.60 (18)e 1.57 (47)⫹⫹⫹ 2.83 (85)⫹⫹⫹ 2.80 (28)⫹⫹⫹ 3.55 (71)⫹⫹⫹. Total spots m⫽2. 0.58 0.67 0.61 0.36 0.69 0.52 0.58 1.37 2.74 3.90 0.22 0.43 0.33 0.24 0.42 0.45. (58) (67) (63) (4) (9) (21) (29) (41) (93) (117) (9) (13) (10) (12) (24) (9). 0.53 (16) 0.30 (6) 1.60 (48) 4.33 (130) 6.80 (136) 11.20 (112) 68.00 (204) 0.47 (14) 0.30 (6) 0.69 (20) 1.43 (43) 3.23 (97) 5.00 (50) 7.05 (141) 0.50 (15) 1.00 (20) 1.80 (54) 5.37 (161) 6.19 (340) 27.30 (273) 0.40 (12) 0.75 (15) 0.60 (18) 1.57 (47) 2.83 (85) 2.80 (28) 3.55 (71). mwh clones. 1.90 2.21 1.95 1.00 2.11 1.43 1.72 2.22 2.05 2.15 1.44 1.54 1.10 1.08 1.75 1.11. 1.63 1.67 1.67 1.70 1.86 1.85 1.65 1.29 1.17 1.40 1.63 1.73 1.54 1.52 1.67 1.90 1.80 1.89 1.94 1.89 1.50 1.53 1.28 1.43 1.54 1.57 1.44. Mean mwh clone size class. 1.2 1.4 1.2 0.7 1.4 1.1 1.2 2.8 5.6 8.0 0.5 0.9 0.7 0.5 0.9 0.9. 1.1 0.6 3.3 8.9 13.9 23.0 139.3 1.0 0.6 1.4 2.9 6.6 0.2 4.4 1.0 2.0 3.7 11.0 33.2 55.9 0.8 1.5 1.2 3.2 5.8 5.7 7.3. Observed. 0.4 0.2 0.0 0.4 0.5. 0.1 1.7 4.5 6.9. 0.2 0.1 –0.4 0.2. 0.7 0.4 2.4 5.0 4.9 6.5. 1.0 2.7 10.0 32.2 54.9. –0.3 0.5 2.0 5.7 9.3 3.5. –0.5 2.2 7.8 12.8 21.9 138.3. Control corrected. Clone formation per 105 cells per cell divisiond. Recombinagenicity in the Drosophila wing spot test. 387.
(4) 388. Typeb. Conc. (mM) No. of flies. (21) (33)e (50)⫹⫹ (57)⫹⫹⫹ (67)⫹⫹⫹ (29) (24)– – (30)– – (34)– (45)⫹. 9,10-Dimethylanthracene (mashed potato flakes) HB MH 0.0 50 0.42 1.0 60 0.55 5.0 60 0.83 10.0 60 0.95 20.0 60 1.12 BH 0.0 60 0.48 1.0 60 0.40 5.0 60 0.50 10.0 60 0.57 20.0 60 0.75 0.06 0.13 0.22 0.30 0.68 0.07 0.05 0.07 0.08 0.08. 0.05 0.15 0.22 0.27 0.47 0.00 0.02 0.05 0.10 0.15 (3) (8)e (13)⫹ (18)⫹⫹ (41)⫹⫹⫹ (4) (3)– (4)– (5)– (5)–. (3) (9)e (13)⫹ (16)⫹⫹ (28)⫹⫹⫹ (0) (1)e (3)e (6)⫹ (9)⫹⫹. Large single spots (⬎2 cells) m ⫽ 5. 0.06 0.18 0.18 0.23 0.15 0.00 0.00 0.00 0.00 0.00. 0.00 0.08 0.15 0.20 0.27 0.00 0.00 0.00 0.00 0.00 (3) (11)e (11)e (14)⫹ (9)e (0) (0)e (0)e (0)e (0)e. (0) (5)⫹ (9)⫹⫹ (12)⫹⫹⫹ (16)⫹⫹⫹ (0) (0)e (0)e (0)e (0)e. Twin spots m⫽5. 0.54 0.87 1.23 1.48 1.95 0.55 0.45 0.57 0.65 0.83. 0.48 0.83 1.00 1.30 1.88 0.33 0.43 0.65 0.52 0.65 (27) (52)⫹ (74)⫹⫹⫹ (89)⫹⫹⫹ (117)⫹⫹⫹ (33) (27)– – – (34)– – (39)– (50)⫹. (29) (50)⫹ (60)⫹⫹⫹ (78)⫹⫹⫹ (113)⫹⫹⫹ (20) (26)e (39)⫹⫹ (31)e (39)⫹⫹. Total spots m⫽2. 0.54 0.82 1.22 1.47 1.93 0.55 0.45 0.57 0.65 0.83. 0.48 0.82 0.95 1.28 1.82 0.33 0.43 0.65 0.52 0.65 (27) (49) (73) (88) (116) (33) (27) (34) (39) (50). (29) (49) (57) (77) (109) (20) (26) (39) (31) (39). mwh clones. 1.78 2.12 2.21 2.51 2.59 1.52 1.59 1.53 1.56 1.64. 1.76 2.18 2.28 2.34 2.44 1.20 1.35 1.44 1.90 1.85. Mean mwh clone size class. 1.1 1.7 2.5 3.0 4.0 1.1 0.9 1.2 1.3 1.7. 1.0 1.7 1.9 2.6 3.7 0.7 0.9 1.3 1.1 1.3. Observed. –0.2 0.0 0.2 0.6. 0.6 1.4 1.9 2.9. 0.2 0.6 0.4 0.6. 0.7 1.0 1.6 2.7. Control corrected. Clone formation per 105 cells per cell divisiond. nc, not calculated because the number of wing precursor cells exposed during the 6 h acute feeding period was not determined. aST, standard cross; HB, high bioactivation cross. bMH, marker-heterozygous wings; BH, balancer-heterozygous wings. cStatistical diagnoses according to Frei and Wu ¨ rgler (1988). m, minimal risk multiplication factor for the assessment of negative results. One-sided binomial tests, significance levels α and β: positive results, ⫹ (α 艋 0.05), ⫹⫹ (α 艋 0.01), ⫹⫹⫹ (α 艋 0.001); negative results, – (β 艋 0.05), – – (β 艋 0.01), – – – (β 艋 0.001); inconclusive results, α ⬎ 0.05, β ⬎ 0.05. dClone frequencies per fly divided by the number of cells examined per fly (48 800) gives an estimate of formation frequencies per cell and per cell division in chronic exposure experiments (Frei and Wu¨ rgler, 1988). eInconclusive.. (26) (36)e (38)e (50)⫹⫹ (69)⫹⫹⫹ (20) (25)e (36)⫹ (25)e (30)e. Small single spots (1–2 cells) m ⫽ 2. Spots per fly (no. of spots) statistical diagnosisc. 0.43 0.60 0.63 0.83 1.15 0.33 0.42 0.60 0.42 0.50. 9,10-Dimethylanthracene (Instant Medium) HB MH 0.0 60 1.0 60 5.0 60 10.0 60 20.0 60 BH 0.0 60 1.0 60 5.0 60 10.0 60 20.0 60. Crossa. Table I. Cont.. M.A.Spano´ et al..
(5) Recombinagenicity in the Drosophila wing spot test Genes, flies and crosses The markers multiple wing hairs (mwh, 3-0.3) and flare-3 (flr3, 3-38.8) used in the wing spot test are at the tip and roughly in the middle of the left arm of chromosome 3, respectively. Two crosses were carried out to produce the experimental larval progeny: the ST cross, flr3/In(3LR)TM3, ri pp sep l(3)89Aa bx34e e BdS females crossed with mwh males; the HB cross, ORR; flr3/ In(3LR)TM3, ri pp sep l(3)89Aa bx34e e BdS females crossed with mwh males. Graf et al. (1984, 1989) described the basic methods and the ST cross. The HB cross is described in more detail in Graf and van Schaik (1992). For genetic descriptions and symbols we refer to Lindsley and Zimm (1992). Larval feeding From the two crosses eggs were collected for 8 h in culture bottles with an agar–agar base (3% w/v) topped with a thick layer of fermenting live baker’s yeast supplemented with sucrose. Three days later the larvae were washed out of the bottles with tap water and collected in a stainless steel strainer. For chronic feeding series of vials were prepared with 1.5 g dry Drosophila Instant Medium (Carolina Biological Supply Co., Burlington, NC) and 5 ml of the test solutions. Equal batches of 3-day-old larvae were then distributed into the vials where they fed for the remainder of their larval life (~48 h), pupated and hatched as adult flies. With DMA a separate chronic feeding series was performed in which the Drosophila Instant Medium was replaced by mashed potato flakes (Stocki; Knorr, Thayngen, Switzerland). In this case 1 g mashed potato flakes was combined with 5 ml of the test solutions. For acute feeding with POC 300 mg microcrystalline cellulose (Merck, Darmstadt, Germany) were mixed with 2 ml of the test solutions in a small beaker. The larvae were then introduced into these beakers at the bottom of plexiglass tubes which had their lower end covered with nylon gauze. The larvae were fed for 6 h with the mutagen/cellulose suspension entering the tubes through the gauze. Afterwards they were washed free of mutagen solution and transferred to vials containing normal Instant Medium prepared with distilled water. There they continued to develop to adulthood. All experiments comprised negative controls prepared with water or the corresponding solvents. The experiments were carried out at 25°C and 65% relative humidity. More details on the feeding techniques may be found in Graf et al. (1984) and Graf (1995).. Fig. 1. Structural formulae of the chemical compounds.. balancer chromosome. To determine the fraction of recombinational events responsible for induced wing spots both types of wings of surviving flies were analysed (Frei et al., 1992; Graf et al., 1992b). This study investigates the recombinagenic activity of chemical compounds belonging to different chemical classes. Larvae from both crosses were treated acutely or chronically with the oxidizing agent potassium chromate (POC), which acts mainly by generating active oxygen species. Three different promutagens that interact with DNA only after metabolic activation were tested by chronic feeding: the bifunctional alkylating cytostatic drug cyclophosphamide (CPH), the procarcinogen p-dimethylaminoazobenzene (DAB) and the polycyclic aromatic hydrocarbon 9,10-dimethylanthracene (DMA). DMA was applied in parallel in two different media (Drosophila Instant Medium and mashed potato flakes) to investigate the influence of this parameter on the test results. Materials and methods Chemicals DAB (CAS 60-11-7), DMA (CAS 781-43-1) and POC (CAS 7789-00-6) were purchased from Fluka (Buchs, Switzerland). CPH (Endoxan, CAS 50-18-0) was obtained from the Hospital Pharmacy, University of Zurich, Switzerland. CPH and POC were dissolved in distilled water; DAB and DMA were dissolved in a mixture of 1% Tween 80 (Serva, Heidelberg, Germany) and 3% ethanol (Merck, Darmstadt, Germany). The structural formulae of the three promutagens CPH, DAB and DMA are shown in Figure 1.. Somatic mutation and recombination test The hatched flies were stored in 70% ethanol. Each cross produces two types of progeny, i.e. marker-heterozygous (mwh flr⫹/mwh⫹ flr3) and balancerheterozygous (mwh flr⫹/mwh⫹ TM3, BdS) flies. The dominant BdS marker allows the wings of these two genotypes to be distinguished. Wings were mounted on slides and examined for spots at 400⫻ magnification. Frequency and size of single and twin spots were recorded. Single spots (mostly mwh but rarely also flr3) can result from various types of mutational events (deletions, point mutations, specific chromosome aberrations, etc.) or from recombination if mitotic crossing-over takes place between the two marker genes. Twin spots (composed of a mwh and a flr3 area) are produced by mitotic recombination between the proximal marker flr3 and the centromere of chromosome 3. Only mwh single spots can be recovered on the wings of balancer-heterozygous flies. They are all due to mutational events because recombinational events are suppressed in inversion-heterozygous cells with the multiply inverted TM3 balancer chromosome. Data evaluation and statistical analysis The data were evaluated according to the procedure described by Frei and Wu¨ rgler (1988, 1995). Accordingly, we distinguished small single spots (1–2 cells in size), large single spots (⬎2 cells) and twin spots, as this makes sense biologically. The frequencies of mwh clones (mwh single spots and the mwh part of twin spots) were used to calculate the clone formation frequencies per 105 cells per cell generation (see also Frei et al., 1992; Frei and Wu¨ rgler, 1995). Dose dependence of clone formation frequency was determined in linear regressions for the marker-heterozygous and balancer-heterozygous genotypes. The differences between the slopes of the two regressions provided a measure of the relative recombinagenic activity of the genotoxic test compounds.. Results All four compounds were tested in two independent experiments. The data were pooled after verifying that there were no significant differences between repetitions. A negative control (water or solvents) was included in all experiments. Table I summarizes the results. The spot data for small single spots, large single spots and twin spots together with the total number of spots are given for both marker-heterozygous and 389.
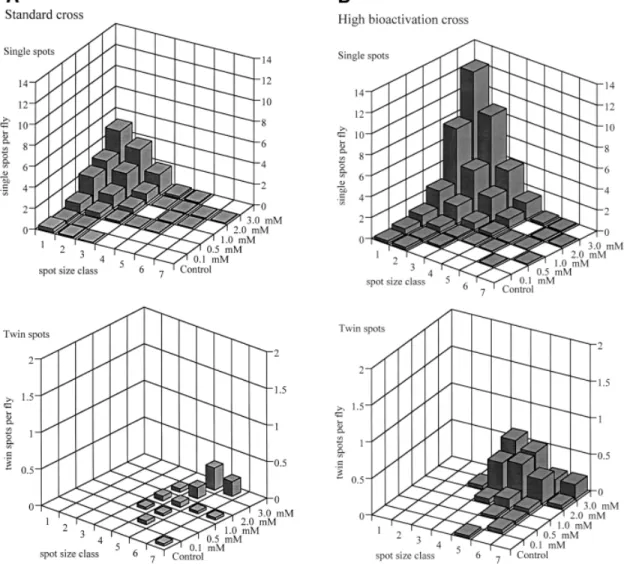
(6) M.A.Spano´ et al.. Fig. 2. Size distributions for single and twin spots after chronic treatments with different concentrations of cyclophosphamide. (A) ST cross; (B) HB cross.. balancer-heterozygous individuals. For the statistical evaluation the results were compared with the corresponding controls. POC was tested with two different exposure methods: chronic feeding (48 h) and acute feeding (6 h). The ST cross as well as the HB cross were used in parallel with both exposure methods so that the larvae derived from both crosses were treated under identical conditions. Four (0.5–5.0 mM) and five (5.0–100.0 mM) different concentrations were tested with chronic feeding and acute feeding, respectively. The highest concentrations in both treatments were toxic, reducing the numbers of surviving flies (see Table I). Only a few marker-heterozygous and no balancer-heterozygous flies were obtained in the HB cross at the highest exposure with 5.0 mM POC for 48 h. Chronic treatments with POC led to very high frequencies of spots in both types of wings in both crosses. In contrast, acute feeding induced spots only in the markerheterozygous wings of the two crosses, whereas in the balancerheterozygous wings the results were inconclusive. CPH, DAB and DMA were studied in chronic feeding experiments. Six different concentrations of CPH (0.1–5.0 mM) were tested in both crosses. The highest concentration (5.0 mM) was toxic: only a few flies survived in the ST cross, while none survived in the HB cross. This cytostatic drug produced dose-related genotoxic effects in both types of wings and in both crosses. 390. The size distributions for single spots and twin spots recorded on marker-heterozygous wings after chronic treatment of larvae with 0.1–3.0 mM CPH are shown in Figure 2A and B for the two crosses. The figures show that the size distributions for single spots and twin spots recorded on marker-heterozygous wings after feeding with CPH are completely different. There are very few twin spots, particularly in the small size classes. As has been shown previously (Szabad et al., 1983; Graf et al., 1984; Wu¨ rgler and Vogel, 1986; Graf, 1995), a lack of twin spots in classes 2 and 3 (2–4 cells in size) is basically due to a property of the flr marker, which is not expressed in small clones. Although in principle twin spots are exclusively due to recombination, their frequency of recovery would be inadequate to determine the recombinagenic activity of a compound, because small twin spots cannot be unambiguously identified, being confused with small mwh single spots. As outlined elsewhere, an appropriate determination should be based on the frequency of mwh clones of single and twin spots induced in marker-heterozygous and balancer-heterozygous wing primordia (Frei et al., 1992; Graf et al., 1992b; Frei and Wu¨ rgler, 1995). Four different concentrations of DAB (0.5–10.0 mM) were tested with larvae of the ST cross. The low concentrations gave negative results and the highest one (10.0 mM) an inconclusive result. Because no positive effects were obtained.
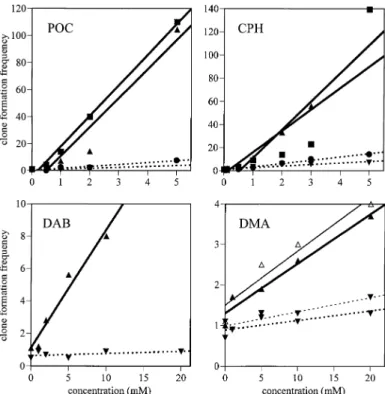
(7) Recombinagenicity in the Drosophila wing spot test. Fig. 4. Linear extrapolation of dose–response relationships obtained with the four compounds. Squares, ST cross, marker-heterozygous wings; circles, ST cross, balancer-heterozygous wings; triangles, HB cross, markerheterozygous wings; inverted triangles, HB cross, balancer-heterozygous wings; closed symbols, Instant Medium; open symbols, mashed potato medium.. Fig. 3. Size distributions for mwh clones on marker-heterozygous (MH) and balancer-heterozygous (BH) wings after chronic treatment of larvae of the HB cross with the highest concentration of each compound.. for this compound in the marker-heterozygous wings of the ST cross the corresponding balancer-heterozygous wings were not analysed. Five different concentrations of DAB (1.0–20.0 mM) were tested with larvae of the HB cross. The lowest concentration (1.0 mM) gave a negative result, while the next three concentrations (2.0, 5.0 and 10.0 mM) were clearly genotoxic in the marker-heterozygous wings with positive results for all categories of spots. The highest concentration (20.0 mM) was very toxic for the marker-heterozygous larvae and no flies survived. A very small number of balancerheterozygous flies survived this highest concentration, but in the balancer-heterozygous wings all treatments led to inconclusive results. DMA was tested at four concentrations (1.0–20.0 mM) with larvae of the HB cross only but with two different culture media (Instant Medium and mashed potato flakes). The two sets of results are very similar. DMA was weakly but significantly genotoxic in marker-heterozygous flies. The highest concentration also gave a positive result in balancer-heterozygous flies. Table I also gives the sizes of the mwh clones recorded in single and twin spots on both types of wings for all four compounds. The sizes of the mwh clones are given as mean size class, whereby class 1 represents the smallest clone size possible, i.e. 1 cell, class 2 corresponds to 2 cells, class 3 to 3–4 cells, class 4 to 5–8 cells, etc. Hence, the size class represents the number of cell division cycles that occurred between the time of induction of the clone in the larval. imaginal disk cells and the beginning of differentiation of the wing. It is evident that the mwh clones are always smaller in the balancer-heterozygous wings than in the corresponding marker-heterozygous wings. This difference in the average mwh clone size is illustrated in Figure 3 by the clone size distributions obtained with the highest concentrations of the four compounds. As suggested in earlier studies, many of the small clones recovered in balancer-heterozygous flies may represent cases of induced segmental aneuploidy with reduced proliferation capacity (Frei et al., 1992; Frei and Wu¨ rgler, 1996). Based on the frequencies of the mwh clones, the clone formation frequencies per cell and cell division without and with correction for control frequencies were calculated, as given in Table I. These clone formation frequencies can then be used to determine the recombinagenic activity of the four compounds. The linear regressions calculated represent first approximations to the corresponding dose–response curves, as shown in Figure 4. Based on the slopes of the regression lines, the percentage of recombinational events among total genotoxic activity was estimated for each compound, as shown in Table II. These estimations are relatively crude: a linear approximation for the dose–response curves was used, but this is not necessarily a true model and may not always be fulfilled. Keeping these limitations in mind, it appears that the percentages of recombination determined for each compound are quite similar in the ST and HB crosses. It is evident that there is a high contribution of recombination to total wing spot induction for all compounds tested (between 83 and 99% recombination). 391.
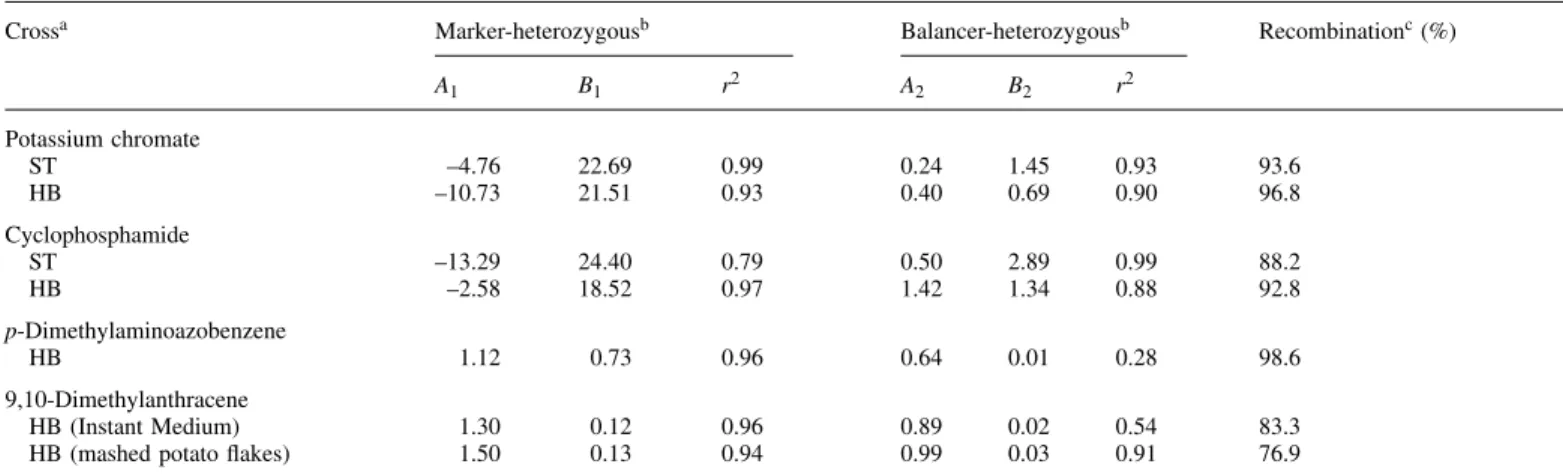
(8) M.A.Spano´ et al.. Table II. Linear extrapolation of the dose–response relationships for mwh clone formation frequencies per 105 cells per cell division and percentage of recombinational events Crossa. Marker-heterozygousb. Balancer-heterozygousb. Recombinationc (%). A1. B1. r2. A2. B2. r2. Potassium chromate ST HB. –4.76 –10.73. 22.69 21.51. 0.99 0.93. 0.24 0.40. 1.45 0.69. 0.93 0.90. 93.6 96.8. Cyclophosphamide ST HB. –13.29 –2.58. 24.40 18.52. 0.79 0.97. 0.50 1.42. 2.89 1.34. 0.99 0.88. 88.2 92.8. p-Dimethylaminoazobenzene HB. 1.12. 0.73. 0.96. 0.64. 0.01. 0.28. 98.6. 9,10-Dimethylanthracene HB (Instant Medium) HB (mashed potato flakes). 1.30 1.50. 0.12 0.13. 0.96 0.94. 0.89 0.99. 0.02 0.03. 0.54 0.91. 83.3 76.9. aST,. standard cross; HB, high bioactivation cross. y-axis intercept; B1 and B2, slopes; r2, coefficient of determination. of recombinational events ⫽ (B1 – B2)/B1.. bA and A , 1 2 cPercentage. Discussion Genotoxicity The chronic treatments (48 h) with the direct acting agent POC and the promutagen CPH revealed that these compounds are highly genotoxic in the ST and HB crosses, with a clear-cut dose–response effect for all spot types distinguished. In contrast, the promutagen DAB was negative in the ST cross, but significantly genotoxic in the HB cross, inducing both single and twin spots. The promutagen DMA was tested in the HB cross only. It showed a rather weak genotoxicity with both types of medium, but induced all types of spots at significant frequencies. The frequency of spots induced in marker-heterozygous individuals in relation to the molar concentration of the genotoxins gives a ranking order for their respective genotoxic effectiveness, POC µ CPH ⬎ DAB ⬎ DMA. With POC larvae of the same age were also given an acute treatment of 6 h at higher concentrations. In this set of experiments the induction of small and large single spots was frequently statistically inconclusive in both crosses, but, nevertheless, several positive results were obtained for these spot categories. On the other hand, clear positive responses were obtained throughout for induction of twin spots in both crosses. The two types of exposure for POC allow a comparison of the effects of chronic and acute feeding. From Table I it is obvious that the chronic feeding method was more efficient than the acute one: much higher frequencies of spots were induced and at lower concentrations of POC. Furthermore, the spot frequencies achieved with increasing concentrations of POC in the acute feedings seemed to level off at ~1.0 spot per wing. It is a well-known phenomenon that in acute feeding experiments the larvae may stop feeding prematurely if the solutions of the test compounds are very concentrated and therefore not palatable. Consequently, they resume feeding only after transfer to drug-free medium. The present data demonstrate once more that acute feeding protocols are not advisable for routine genotoxicity screening of chemical compounds or mixtures. Acute treatments may be successful in a sufficiently reproducible manner only if very potent genotoxins, such as the oxidizing agent POC, or other powerful direct 392. acting alkylating agents are tested (Graf, 1995; RodriguezArnaiz et al., 1996). Theoretically, different spot size distributions are expected after chronic and acute exposures (Graf, 1995). In line with Graf et al. (1984), chronic treatment for 48 h results in a distribution in which small spots predominate and the larger spots are present at decreasing frequency with increasing size, as shown in Figure 2 for CPH. The strong genotoxin POC showed a somewhat different spot size distribution (see Figure 3). The low number of the smallest class of spots (1 cell) observed with POC in chronic feedings may be due to rapid turnover and clearance of the compound in the individuals after pupation. Similar effects have been obtained with other compounds that show very high genotoxic activity, such as 1((5-nitrofurfurylidene)amino)adamantane (Moraga and Graf, 1989), methyl methanesulfonate and mitomycin C (RodriguezArnaiz et al., 1996). In previous studies CPH was tested in the ST cross by chronic exposures of different durations up to the maximum tolerated concentration (Graf et al., 1989). A 48 h feeding interval was obviously optimal for this compound. The present experiments with CPH aimed at a quantitative evaluation of its genotoxicity in the ST and HB crosses. CPH was found to be equally potent for dose-related spot induction in the markerheterozygous individuals of both crosses. However, the highest concentration was very toxic to larvae of the ST cross, reducing the number of flies available for analysis. The same concentration was lethal for larvae of the HB cross, which are apparently more sensitive to the toxic action of this promutagen. Maybe, as a consequence of this difference in toxicity of CPH in the two crosses, the shapes of the dose–response curves for clone formation are different (Figure 4). The high toxicity observed in larvae of the HB cross is most probably due to the constitutively high levels of cytochromes P450, especially CYP6A2, in these individuals. This may lead to increased production of toxic metabolites (Saner et al., 1996). In conclusion, it appears that not only larvae derived from the HB cross but also those from the ST cross have sufficient bioactivation capacity to produce the genotoxic metabolites of CPH that lead to the high genotoxic effects. CPH has been tested for genotoxicity in transgenic larvae.
(9) Recombinagenicity in the Drosophila wing spot test. expressing the mammalian cytochrome P450 CYP2B1 using the wing spot test and an injection protocol (Jowett et al., 1991). The transgenic larvae were hypersensitive to CPH compared with control larvae. However, the frequencies of total spots observed in these experiments were much lower than those obtained with either cross in our experiments with chronic feeding of larvae. The injection protocol may have its limits, not only because injection is a relatively elaborate technique, but also because exposure of the target cells is acute rather than protracted. Particularly important for indirectly acting compounds, it may also have reduced sensitivity because it bypasses a most relevant compartment for biotransformation, namely the epithelial cells of the gut. The promutagen DAB proved to be much more toxic to larvae of the ST cross than to those of the HB cross. Furthermore, it was not genotoxic at all in the former, while it was positive in the latter, with a clear dose–response effect. Similar results were obtained in previous experiments (Graf et al., 1992a). This result again demonstrates the utility of the HB cross, with increased levels of cytochromes P450, for detection of genotoxic activity of compounds depending on metabolic activation. With respect to results obtained with other Drosophila assay systems, we may recall that DAB induced sex-linked recessive lethal mutations in male germ cells (Angus, 1985; Parry and Sinclair, 1985). It was also weakly positive in the white/white⫹ SMART of the eye (Vogel and Nivard, 1993). DMA has also been tested previously in the Drosophila wing spot test, but only with the ST cross (Graf et al., 1989). Chronic exposure (48 h) with 5.0 and 10.0 mM DMA produced positive results for all three types of spots. However, the frequencies of spots at the highest concentration were generally no higher than those observed at the lower one. It was concluded that larval metabolic capacity for this procarcinogen was probably already at its limits at the lower concentration. DMA also produced positive results in the w/w⫹ SMART of the eye in experiments with several different Drosophila tester strains (Rodriguez-Arnaiz et al., 1993). Based on these prior results, the present experiments were performed only with the HB cross. In contrast to the results recorded with the ST cross, a clear dose–response effect was obtained with the HB cross (see Figure 4), which may be attributed to the increased metabolic transformation capacity of this genotype. In a study that analysed the combined effects of methyl urea and sodium nitrite increased spot frequencies were obtained with mashed potato flakes as compared with Drosophila Instant Medium (Guzma´ n-Rinco´ n and Graf, 1995; Guzma´ n-Rinco´ n et al., 1998). This prompted us to explore the utility of mashed potato flakes in a series of experiments with DMA. The results obtained with Drosophila Instant Medium and mashed potato flakes were rather similar, indicating that the composition of the feeding medium does not seem to influence the genotoxic activity of this compound. Mashed potato flakes may therefore be a cheaper alternative to Instant Medium for the testing of genotoxins. Recombinagenicity In marker-heterozygous individuals single spots (mwh or flr) can be produced either by point mutation, certain types of chromosome breakage event (deletion) or by mitotic recombination. However, we cannot tell how much each mechanism contributes to the total of spots recovered. On the other hand, the presence of twin spots proves that mitotic recombination. is induced, as these spots result from mitotic crossing-over between the flr locus and the centromere. From the significant induction of twin spots recorded on marker-heterozygous wings with the test compounds studied here it can be concluded that they all have recombinagenic activity. In balancer-heterozygous individuals the flr marker is absent. The spots that can be recovered are therefore mwh single spots. All recombination events are suppressed or eliminated owing to inversion heterozygosity brought about by the presence of the multiply inverted balancer chromosome. As a rule, therefore, the frequencies of mwh clones observed on the wings of balancer-heterozygous flies are always lower than those observed on the wings of marker-heterozygous flies (Graf et al., 1984; Frei and Wu¨ rgler, 1996). After chronic treatments with POC, CPH and DMA it was obvious that the frequencies of mwh clones observed on balancer-heterozygous wings were considerably lower than those observed on marker-heterozygous wings. Nevertheless, in balancer-heterozygous wings spot induction by these compounds was statistically significant compared with those of the respective negative controls. Hence, we may conclude that although the large majority of the spots induced by POC, CPH and DMA in the wings of marker-heterozygous flies are due to mitotic recombination, a small but significant number of them have other causes and may be due to point mutation or chromosome breakage (deletion). With DAB no significant spot induction could be demonstrated in balancer-heterozygous flies, in spite of a slight suggestive trend in the dose–response effect. It is possible that this compound is an exclusive or almost exclusive recombinagen. Such compounds do exist, as shown earlier for ellipticine (Frei and Wu¨ rgler, 1996). Based on the percentages shown in Table II, the ranking order of the compounds with respect to their relative recombinagenic efficiency was DAB ⬎ POC ⬎ CPH ⬎ DMA. Most genotoxins so far studied for recombinagenicity in the wing spot test show values of ~70%, in the range ~50–90%. Thus the values found for DAB (99%), POC (97%), CPH (93%) and DMA (83%) are not unusual, but clearly in the higher range. It is now well documented that there is a link between the recombinagenic activity of chemical compounds and their carcinogenicity (Cairns, 1981). On account of this and in consideration of all the other advantages offered by rapid somatic assays in D.melanogaster it seems a profitable strategy to screen for genotoxic and recombinagenic activity of compounds in the first instance with this type of assay. On comparing the sensitivities of different somatic assays in Drosophila, such as genetic instabilities in the zeste-white or the white-ivory eye spot test on the one hand and the wing spot test on the other, it became clear that these somatic test systems are not equivalent with respect to the spectra of genotoxic agents they are able to detect (Batiste-Alentorn et al., 1995; Graf and Wu¨ rgler, 1996). The SMART approach appears to be the most potent and, moreover, the wing spot test represents a rapid and inexpensive test method that allows quantitative determination of both the genotoxic and recombinagenic activities of chemical compounds or complex mixtures (Magnusson and Ramel, 1990; Frei et al., 1992; Graf et al., 1992b; Marec and Gelbic, 1994; Guzma´ n-Rinco´ n and Graf, 1995; Frei and Wu¨ rgler, 1996; Graf and Wu¨ rgler, 1996; Rodriguez-Arnaiz et al., 1996; Gonza´ lez-Ce´ sar and RamosMorales, 1997; Vogel et al., 1999). 393.
(10) M.A.Spano´ et al.. General conclusions In summary, all four compounds tested are genotoxins showing clear-cut dose–response effects, but they differ in genotoxic effectiveness. In addition, they are characterized by relatively high proportions of recombinagenic activity (83–99%). It seems likely, therefore, that they produce primary damage in DNA that is to a considerable extent further processed by recombinational DNA repair pathways. The present and previous reports show that D.melanogaster offers a very valuable possibility to combine eukaryotic in vivo genotoxicity testing with a versatile metabolic capacity for xenobiotics and that the wing SMART method is an efficient and quick procedure for quantitative determination of the recombinagenic potential of genotoxic agents. References Angus,D.S. (1985) Sex-linked recessive lethal tests in Drosophila with benzidine, 4,4⬘⬘-diaminoterphenyl, 4-dimethylaminoazobenzene and 4⬘cyanidimethylaniline. In Parry,J.M. and Arlett,C.F. (eds) Comparative Genetic Toxicology. The Second UKEMS Collaborative Study. VCH Verlagsgesellschaft, Weinheim, Germany, pp. 494–497. Batiste-Alentorn,M., Xamena,N., Creus,A. and Marcos,R. (1995) Genotoxicity testing of five compounds in three Drosophila short-term assays. Mutat. Res., 341, 161–167. Bishop,J.M. (1991) Molecular themes in oncogenesis. Cell, 64, 235–248. Cairns,J. (1981) The origin of human cancers. Nature, 289, 353–357. Engler,P. and Strob,U. (1988) Immunoglobulin gene rearrangement. In Kucherlapati,R. and Smith,G.R. (eds) Genetic Recombination. American Society for Microbiology, Washington, DC, pp. 667–700. Frei,H. and Wu¨ rgler,F.E. (1988) Statistical methods to decide whether mutagenicity test data from Drosophila assays indicate a positive, negative or inconclusive result. Mutat. Res., 203, 297–308. Frei,H. and Wu¨ rgler,F.E. (1995) Optimal experimental design and sample size for the statistical evaluation of data from somatic mutation and recombination tests (SMART) in Drosophila. Mutat. Res., 334, 247–258. Frei,H. and Wu¨ rgler,F.E. (1996) Induction of somatic mutation and recombination by four inhibitors of eukaryotic topoisomerases assayed in the wing spot test of Drosophila melanogaster. Mutagenesis, 11, 315–325. Frei,H., Clements,J., Howe,D. and Wu¨ rgler,F.E. (1992) The genotoxicity of the anti-cancer drug mitoxantrone in somatic and germ cells of Drosophila melanogaster. Mutat. Res., 279, 21–33. Gonza´ lez-Ce´ sar,E. and Ramos-Morales,P. (1997) Sodium azide induces mitotic recombination in Drosophila melanogaster larvae. Mutat. Res., 389, 157– 165. Graf,U. (1995) Analysis of the relationship between age of larvae at mutagen treatment and frequency and size of spots in the wing somatic mutation and recombination test of Drosophila melanogaster. Experientia, 51, 168–173. Graf,U. and van Schaik,N. (1992) Improved high bioactivation cross for the wing somatic mutation and recombination test in Drosophila melanogaster. Mutat. Res., 271, 59–67. Graf,U. and Wu¨ rgler,F.E. (1996) The somatic white-ivory eye spot test does not detect the same spectrum of genotoxic events as the wing somatic mutation and recombination test in Drosophila melanogaster. Environ. Mol. Mutagen., 27, 219–226. Graf,U., Wu¨ rgler,F.E., Katz,A.J., Frei,H., Juon,H., Hall,C.B. and Kale,P.G. (1984) Somatic mutation and recombination test in Drosophila melanogaster. Environ. Mutagen., 6, 153–188. Graf,U., Frei,H., Ka¨ gi,A., Katz,A.J. and Wu¨ rgler,F.E. (1989) Thirty compounds tested in the Drosophila wing spot test. Mutat. Res., 222, 359–373. Graf,U., Badoux,M. and Holliger,E. (1992a) The carcinogen DAB is highly genotoxic in the improved high bioactivation cross of the Drosophila wing spot test (SMART). Drosoph. Inf. Serv., 71, 235–236. Graf,U., Heo,O. and Olvera Ramirez,O. (1992b) The genotoxicity of chromium(VI) oxide in the wing spot test of Drosophila melanogaster is over 90% due to mitotic recombination. Mutat. Res., 266, 197–203. Guzma´ n-Rinco´ n,J. and Graf,U. (1995) Drosophila melanogaster somatic mutation and recombination test as a biomonitor. In Butterworth,F.M., Corkum,L.D. and Guzma´ n-Rinco´ n,J. (eds) Biomonitors and Biomarkers as Indicators of Environmental Change. Plenum Press, New York, NY, pp. 169–181. Guzma´ n-Rinco´ n,J., Espinosa,J. and Graf,U. (1998) Analysis of the in vivo nitrosation capacity of the larvae used in the wing somatic mutation and recombination test of Drosophila melanogaster. Mutat. Res., 412, 69–81.. 394. Happle,R. (1999) Loss of heterozygosity in the human skin. J. Am. Acad. Dermatol., 41, 143–161. Hoffmann,G.R. (1994) Induction of genetic recombination: consequences and model systems. Environ. Mol. Mutagen., 24, 59–66. Jowett,T., Wajidi,M.F.F., Oxtoby,E. and Wolf,C.R. (1991) Mammalian genes expressed in Drosophila: a transgenic model for the study of mechanisms of chemical mutagenesis and metabolism. EMBO J., 10, 1075–1081. Lindsley,D.L. and Zimm,G.G. (eds) (1992) The Genome of Drosophila melanogaster. Academic Press, San Diego, CA. Magnusson,J. and Ramel,C. (1990) Inhibitor of poly(ADP-ribose)transferase potentiates the recombinogenic but not the mutagenic action of alkylating agents in somatic cells in vivo in Drosophila melanogaster. Mutagenesis, 5, 511–514. Marec,F. and Gelbic,I. (1994) High recombinagenic activities of three antiviral agents, adenine derivatives, in the Drosophila wing spot test. Mutat. Res., 311, 305–317. Marshall,C.J. (1991) Tumor suppressor genes. Cell, 64, 313–326. Moraga,A.A. and Graf,U. (1989) Genotoxicity testing of antiparasitic nitrofurans in the Drosophila wing somatic mutation and recombination test. Mutagenesis, 4, 105–110. Parry,J.M. and Sinclair,P.B. (1985) An evaluation of the genotoxicity of BZD, DAT, DAB and CDA in the sex-linked recessive lethal test using Drosophila melanogaster. In Parry,J.M. and Arlett,C.F. (eds) Comparative Genetic Toxicology. The Second UKEMS Collaborative Study. VCH Verlagsgesellschaft, Weinheim, Germany, pp. 499–505. Rodriguez-Arnaiz,R., Vogel,E.W. and Szakmary,A. (1993) Strong intra-species variability in the metabolic conversion of six procarcinogens to somatic cell recombinagens in Drosophila. Mutagenesis, 8, 543–551. Rodriguez-Arnaiz,R., Orozco-Soto,P., Gayta´ n-Oyarzu´ n,J.C. and Graf,U. (1996) Analysis of mitotic recombination induced by several mono- and bifunctional alkylating agents in the Drosophila wing spot test. Mutat. Res., 351, 133–146. Saner,C., Weibel,B., Wu¨ rgler,F.E. and Sengstag,C. (1996) Metabolism of promutagens catalyzed by Drosophila melanogaster CYP6A2 enzyme in Saccharomyces cerevisiae. Environ. Mol. Mutagen., 27, 46–58. Sengstag,C. (1994) The role of mitotic recombination in carcinogenesis. Crit. Rev. Toxicol., 24, 323–353. Stern,C. (1936) Somatic crossing-over and segregation in Drosophila melanogaster. Genetics, 21, 625–730. Szabad,J., Soos,I., Polgar,G. and Hejja,G. (1983) Testing the mutagenicity of malondialdehyde and formaldehyde by the Drosophila mosaic and the sexlinked recessive lethal tests. Mutat. Res., 113, 117–133. Vogel,E.W. (1992) Tests for recombinagens in somatic cells of Drosophila. Mutat. Res., 284, 159–175. Vogel,E.W. and Nivard,M.M.J. (1993) Performance of 181 chemicals in a Drosophila assay predominantly monitoring interchromosomal mitotic recombination. Mutagenesis, 8, 57–81. Vogel,E.W. and Zijlstra,J.A. (1987a) Mechanistic and methodological aspects of chemically-induced somatic mutation and recombination in Drosophila melanogaster. Mutat. Res., 182, 243–264. Vogel,E.W. and Zijlstra,J.A. (1987b) Somatic cell mutagenicity in Drosophila melanogaster in comparison with genetic damage in early germ-cell stages. Mutat. Res., 180, 189–200. Vogel,E.W., Graf,U., Frei,H. and Nivard,M.M.J. (1999) The results of assays in Drosophila as indicators of exposure to carcinogens. In McGregor,D.B., Rice,J.M. and Venitt,S. (eds) The Use of Short- and Medium-term Tests for Carcinogens and Data on Genetic Effects in Carcinogenic Hazard Evaluation, IARC Scientific Publications no. 146. IARC, Lyon, pp. 427–470. Wu¨ rgler,F.E. (1992) Recombination and gene conversion. Mutat. Res., 284, 3–14. Wu¨ rgler,F.E. and Vogel,E.W. (1986) In vivo mutagenicity testing using cells of Drosophila melanogaster. In De Serres,F.J. (ed.) Chemical Mutagens, Vol. 10, Principles and Methods for their Detection. Plenum Press, New York, NY, pp. 1–72. Wu¨ rgler,F.E., Graf,U. and Frei,H. (1985) Somatic mutation and recombination test in wings of Drosophila melanogaster. In Ashby,J., de Serres,F.J., Draper,M. and Ishidate,M. (eds) Progress in Mutation Research, Vol. 5, Collaborative Study of Short-term Tests for Carcinogens. Elsevier/NorthHolland, Amsterdam, The Netherlands, pp. 325–340. Zimmermann,F., Schwaier,R. and Laer,U. (1966) Mitotic recombination induced in Saccharomyces cerevisiae with nitrous acid, diethylsulfate and carcinogenic, alkylating nitrosamides. Z. Vererbungsl., 98, 230–246. Received on June 29, 2000 and accepted on April 24, 2001.
(11)
Figure

Documents relatifs