Journal of Fluorescence, VoL 7, No. I, 1997
Frequency-Domain Fluorescence Lifetime Imaging for
Endoscopic Clinical Cancer Photodetection: Apparatus
Design and Preliminary Results
G. Wagni~res, 1-z J. Mizeret, 1 A. Studzinski, ~ and H. van den Bergh ~
Received June 14. 1996; accepted October 25, 1996"
We describe a new fluorescence imaging device for clinical cancer photodetection in hollow organs in which the tumor/normal tissue contrast is derived from the fluorescence lifetime of endogenous or exogenous fluorochromes. This fluorescence lifetime contrast gives information about the phys- icochemical properties of the environment which are different between normal and certain diseased tissues. The excitation light from a CW laser is modulated in amplitude at a radio frequency by an electrooptical modulator and delivered by an optical fiber through an endoscope to the hollow organ. The image of the tissue collected by the endoscope is separated in two spectral windows, one being the backscattered excitation light and the other the fluorescence of the fluorochrome. Each image is then focused on the photocathode of image intensifiers (II) whose optical gain is modulated at the same frequency as the excitation intensity, resulting in homodyne phase-sensitive images. By acquiring stationary phase-sensitive frames at different phases between the excitation and the detection, it is possible to calculate in quasi-real time the apparent fluorescence lifetime of the corresponding tissue region for each pixel. A result obtained by investigating the endogenous fluorochromes present in the mucous membrane of an excised human bladder is presented to illustrate this method and most of the optical parameters which are of major importance for this photodetection modality have been evaluated.
KEY WORDS: Light-induced fluorescence; frequency domain; photodetection; cancer; fluorescence lifetime imaging; endoscopy; optical biopsy.
I N T R O D U C T I O N
Because an important portion o f the advanced-stage cancers is difficult to treat effectively, it is important to detect them at an early stage3 t) Many invasive cancers are preceded by alterations, such as dysplasia, or carci- noma in situ (CIS)52~) However, for most o f these early lesions, there are no effective methods to detect these stages of the disease. Most cancers originate in superfi-
I Institute of Environmental Engineering, Swiss Federal Institute of Technology (EPFL), CH-1015 Lausanne, Switzerland.
2 To whom correspondence should be addressed at LPAS, Bfitiment de Chimie, EPFL, CH-1015 Lausanne, Switzerland.
75
cial tissues (skin cancer) or in the tissues lining the body cavities or tubes such as bronchial cancers o f the lung and cancers o f the esophagus, stomach, colon, bladder, and female reproductive organs. Furthermore, the use of light-induced fluorescence (LIF) spectroscopy originated with the development o f medical endoscopes by numer- ous investigators as a potentially powerful method o f detecting and localizing malignant tumors.
Tissue characterization using LIF spectroscopy can be divided into two categories. The first is based on the detection of the native tissue fluorescence (autofluoresc- ence), which induces an optical contrast between the le- sion and the surrounding normal tissues. Among other things, tissues are made up of proteins, nucleic acids,
76 Wagni~res, Mizeret, Studzinski, and van den Bergh lipids, and water with fluorescing and nonfluorescing
chromophores. Many tissues are known to fluoresce in the UV and visible part of the spectrum. r The groups of Alfano, ~6) Lohmann,CT) and Yuanlong as) conducted pi- oneering studies in this field which, to some extent, gave rise to the increasing number of papers on the autoflu- orescence excitation and emission spectra of human and animal tissues performed in vitro and in vivo. OJS)
The second approach concerning the clinical use of LIF spectroscopy for detecting and localizing malignant tumors is based on the administration of a fluorescent drug such as hematoporphyrin derivative (HPD) or its somewhat purified form Photofrin II, cl6,23) ~-aminolevu- linic acid-induced protoporphyrin IX (ALA-PPIX), t24,27) tetra(meta-hydroxyphenyl)chlorin (mTHPC), ~28) and fluorochromes coupled to monoclonal antibodies, tzg) Such "drugs" tend to localize to some extent selectively in certain tumors after intravenous injection. The region where a superficial cancer is suspected is then irradiated with light at a wavelength at which more dye fluores- cence is induced from the tumor, with its relatively high drug concentration, than from the dye-deficient sur- rounding normal tissue.
The interest in studying the time-resolved fluores- cence spectroscopy of exogenous and endogenous fluor- ochromes to characterize biological tissues is connected with two major reasons.
(1) The optical contrast between the lesion and the surrounding normal tissue is a key parameter limiting the performance of cancer LIF photo- detection. This contrast is unfortunately de- graded frequently when a steady-state LIF technique is used due to, among other things, tissue autofluorescence in both tumor and nor- mal tissue. As the above-mentioned clinically used exogenous dyes have fluorescence life- times which are different from that of the en- dogenous fluorochromes, better discrimination (improved contrast) between these two dyes can be obtained in principle using time-re- solved fluorescence imaging.
(2) Several endogenous and exogenous fluoro- chromes are more or less sensitive to their local environment. According to the literature, some microenvironmental parameters differ between normal tissues and some neoplastic lesions. Among these, one might mention the pH,C30) the DNA and/or RNA content,O~) the cell mem- brane permeability, which can influence the ac-
cess of the fluorochrome to certain
m~crocompartments such as the nucleus,C32.33) and the enzymatic activity.t34as) As the fluores-
cence lifetime is very sensitive to small pertur- bations in the environment of the fluorochrome, it is of interest to evaluate the performance of time-resolved LIF spectroscopy for tissue char- acterization based on the physicochemical properties of the local environment. More im- portant is the fact that, in principle, environ- mentally sensitive dyes do not require selective localization in a tumor for effective marking. Fluorescence lifetimes can be determined from the inverse slope of the exponential decay of the light inten- sity following pulsed excitation. This is the so-called "time-domain" approach. The corresponding approach for the imaging of fluorescence lifetime consists of pixel- by-pixel scanning and time-correlated single-photon counting3 TM Such measurements require a considerable
amount of time, and it may not be practical to produce high-resolution and/or real-time images. Other laborato- ries have created time-decay contrasts using time gating of the long-lived fluorescence. ~37~s~ However, these meth- ods provide information only on the presence of the de- layed emission. Moreover, on-gating of delayed emission does not appear to have contrast opportunities such as particularly lifetime-based contrast and selective obser- vation of either short or long components of the fluores- cence decay. Obviously, the technique of pulsed image intensifier gating is restricted to fluorescence lifetimes that differ by at least one order of magnitude to allow for an efficient lifetime-based selective signal suppression.
Another approach, which avoids most of the above mentioned drawbacks of the time-domain approach, con- sists of using "frequency-domain" fluorescence lifetime imaging (FLIM) techniques as described below.
One of the novelties of our implementation of this method is that fluorescence and reference images are taken simultaneously and treated in quasi-real time. The main advantage of such simultaneous measurement com- pared to sequential detection is that exactly the same area is imaged in the different spectral bands indepen- dently of the scene movements. Moreover, the device described below allows for an immediate observation of the endoscopic area under white light illumination dur- ing fluorescence detection to localize the origin of the fluorescence signals of interest.
EXPERIMENTAL
Operating Principle of the FLIM Apparatus
The basic principle of "frequency-domain" FLIM has been described by Lakowicz et aL O9,41) This group
Frequency-Domain Fluorescence Lifetime Imaging for Cancer Photodetection 77
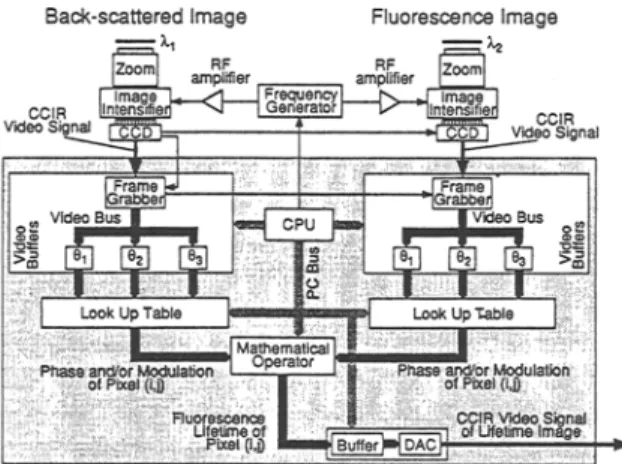
Fig. 1. Principle and signal processing of the frequency-domain fluorescence lifetime imaging apparatus. Three reference (backscattering) and three
fluorescence images are detected simultaneously for three different phases from the fluorescence excitation. Detection of this type enables deter- mination of the phase and modulation of both images for each pixeI. The fluorescence lifetime is then deduced from the phase difference and the modulation ratio for each pixel at the video frequency.
essentially applied this technique in the context of flu- orescence microscopy experiments.
Briefly, the principle of this approach consists of measuring the fluorescence lifetimes or decay times -r by the phase method, in which the sample is illuminated with fluorescence excitation light modulated at a radio frequency to. The basic idea is to observe the fluores- cence image with an image intensifier (II), whose optical gain is modulated at the same frequency, resulting in homodyne phase-sensitive images. Detection of this type will preserve the decay time information, as the two- dimensional output signal at the position 7 in the image plane depends on the phase angle difference between the fluorescence emission and the gain modulation of the II. The phase shift A0 between the excitation light and the fluorescence and/or the modulation ratio M [M = (AC/DC components of the fluorescence)/(AC/DC com- ponents of the excitation)] enables (see Fig. I) the value of this lifetime in the case of a monoexponential decay to be obtained. These two parameters are related to the fluorescence lifetime by
a0 )
"r(-F) = t a n - (1)
to
"r(7) =l_to ~/~/~7) 1 (2)
In the case of multiexponential decays, the values of-r obtained with Eqs. (1) and (2) are generally not identical.
It is not possible to determine a fluorescence life- time from a single phase-sensitive image. Various ap- proaches, based on the detection of fluorescence images at two or more phase shifts, have been proposed by Lak- owicz et al. to measure the fluorescence lifetime, o9)
The approach we are using consists of determining the phase angle and/or the modulation at each point in the image by examining the detector phase-angle de- pendence of the image intensity for three phase shifts of the gain-modulation signal. This approach reduces sev- eral artifacts generated by the methods based on the de- tection at two phases only.
As presented in Fig. 1, two gain-modulated image intensifiers are used in our experimental setup. One of them (II 1) detects the tissue fluorescence, whereas the other one (II 2) detects the backscattered fluorescence excitation light. The reference value of these phase angle (OR) and modulation (mR) are obtained with II 2, whereas II 1 measures the fluorescence phase (OF) and modulation (rnF). These stationary phase-sensitive images are col- lected using two CCD cameras, digitized, and manipu- lated with a mathematical operator in real time (quasi-video frequency) to determine the absolute phase
78 Wagni6res, Mizeret, Studzinski, and van den Bergh and modulation of each pixel. A second mathematical
operator calculates the phase difference (A0) and/or modulation ratio (M) between the two images series, as well as the value of "r.
The resulting image therefore consists of pixels whose value corresponds to the fluorescence lifetime only. Hence, for "small" modulation frequencies (less than 5 GHz), the intensity of this lifetime image no longer depends on the fluorochrome concentration, ex- citation light intensity (which is quite heterogeneous in an endoscopic context), tissue-endoscope distance, and fluorochrome photobleaching (as long as the photoprod- ucts are not fluorescing). This lifetime image is finally combined with the corresponding color image obtained during white-light illumination of the endoscopic field.
An advantage of the experimental method proposed here is that pixel-to-pixel scanning is not required to obtain the fluorescence lifetime image, as the informa- tion from all pixels is obtained at the same time by the CCD.
Design and Characterization of the FLIM Apparatus
The major factor degrading the endoscopic detect- ability of small tumors is either low signal levels re- sulting in. high image noise or insufficient contrast between tumor and surrounding normal tissue. Thus contrast, noise and, to a lesser extent, image sharpness are key parameters in early cancer detection using a flu- orescence imaging technique. The typical surface of an early-stage squamous cell carcinoma in the tracheobron- chial tree, the esophagus, or the upper aerodigestive tract is of the order of 1 cm 2 at the time of detection. (23) Thus, at a typical observation distance, such a lesion occupies a significant portion of the field of view. The resolution of most standard medical endoscopes, image intensifiers, and CCD cameras is therefore sufficient for detecting such lesions. Therefore, when designing such an appa- ratus, the focus is on the reduction of noise and contrast enhancement of the tumor image.
Noise is due mainly to photon statistics (shot noise) in the context of such experiments as discussed below. This noise can therefore be reduced by increasing the number of detected photons. For a given apparatus, de- tection geometry, tissue optics, and tumor marker, this can be done either by increasing the fluorescence exci- tation light intensity or by increasing the detection pe- riod. The former is limited by the dye photobleaching and the latter by loss of image sharpness when moving the endoscope. Other factors that might limit the use of high light intensity are thermal effects in the tissue.
Under our conditions, the excitation light intensity is typically of the order of 50 mW/cm 2 at the tissue surface. Increasing the detection period to decrease the noise and/or to perform the calculation between the dif- ferent images is limited by the movement of the scene, i.e., integrating or calculation periods that are too tong would cause the image to streak and hence its quality to decrease. The frequency of intensity fluctuations corre- sponding to the maximum of the human eye temporal contrast sensitivity is between 5 and 10 Hz at the lu- minosity of conventional TV monitorsJ 42) Thus we found that the upper limit for time integration is of the order of 200 ms for a lifetime-reconstructed image, which corresponds to five consecutive PAL video frames.
The Endoscopes
In general we use standard medical rigid (Storz) and flexible (Olympus) endoscopes. Unfortunately, such endoscopes are not optimal for cancer photodetection, as the effective diameter of the objective which captures the light is small (typical diameter, 300 ~tm). This small diameter is due to the presence of biopsy, inflation, and/or suction channels and to their broad (typically 75 ~ ) field of view. Typically, if 20 mm is between the distal end of the endoscope and the cancer, the probability for the light emitted by the tissue to enter the objective is around 10-4! Furthermore, the imaging light guide flu- oresces when excitation light is reflected back to the ob- jective from the surface being inspected. Thus, at particular surface orientations, a strong specular reflec- tion may induce degradation of both the fluorescence and the reference images.
For the time being, we have designed our apparatus to be compatible with most standard endoscopes avail- able which deliver images of widely varying diameters and with different apertures.
Light Sources and Illumination Optics
The fluorescence excitation light sotur~ presented in Fig. 2 is a continuous-wave argon ion pumped dye laser system (Coh~nt, Palo Alto, CA; Ianova 100 + CR599). Such a tunable device provides more than 500 mW be- tween 390 and 950 nm if different spectral configurations (dyes, mirrors) are used. Moreover, the argon ion laser itself can be used in the "mid-UV" (334-, 351-, 364-nm) or "deep-UV" (275-, 305-nm) modes if shorter wave- lengths are required. This laser beam is then modulated in intensity at a radio frequency by a tunable (1- to 350-MHz) Pockels cell (Quantum Technology, Lake Mary, FL;
Frequency-Domain Fluorescence Lifetime Imaging for Cancer Photodetection 79
Fig. 2. Experimental setup of the frequency-domain FLIM apparatus for endoscopic tissue characterization.
300- to 700-nm coated K.DP crystal) combined with a polarizer. This Pockels cell is operated by an amplified (Quantum Technology; Type 3500 amplifier) frequency generator (Hewlett Packard HP 8648B).
Obturation of the modulated laser beam is achieved by a rotating optical chopper controlled by a central clock. Such an obturation is required by the fact that our apparatus alternates between two modes of observation. The first one consists of illuminating the endoscopic scene with white light and acquiring the normal endo- scopic color image. In the second mode, laser excitation only is performed and the fluorescence and backscattered images are recorded simultaneously at three phases (sep- arated by 120 ~ between 0 and 360 ~ from the laser mod- ulation. In this second mode, the laser beam is coupled into a 200-p.m-core diameter quartz optical fiber to il- luminate the endoscopic site.
The white-light source of our apparatus is a 300-W xenon lamp (Storz, Tuttlingen, Germany; Type 487B). An optical chopper controlled by the central timing con- troller switches off this white light during observation of the endoscopic field in the fluorescence mode. The transition time is about 2 ms, which enables alternation between these two modes at video frequency. The light provided by this white-light source is then coupled into the illumination optics of the endoscope.
Detection Optics, Spectral Design, and Detectors The dye fluorescence, excitation backscattered light, and tissue autofluorescence in one mode and the color image in the other mode are collected by the en- doscope objective. At the ocular end of the endoscope a beamsplitter cube is used to transmit 10% of the light for visual observation of the white-light image (cf. Fig.
2). The other 90% is reflected toward a Storz articulated optical arm which is quite flexible and transmits 50% at 630 nm. It consists in five rigid segments with Hopkins lenses. The quality of the image transmitted is superior to that of a fiberscope. The latter has a typical transmis- sion of 15% at this wavelength. The ocular at the end of the articulated arm is inserted into a black box which contains further optics, both gain-modulated image in- tensifiers, and the JVC (Model TK 1270 E) video color CCD camera. This ocular furnishes a divergent beam which varies from one endoscope to another and attains at most 15 ~ with a pupil of maximum 2-mm diameter. A photographic lens (Nikon f = 50 mm; aperture, 1.8) images this pupil on the reflecting chopper, which either lets the fluorescent and backscattered images pass or re- flects the white-light image toward the video color cam- era. This chopper is also controlled by the central clock. The focusing on the reflective chopper is necessary to keep the dead time to a minimum ( - 1 ms) between the two modes. A dichroic mirror separates the spectral do- mains corresponding to the dye fluorescence and the ex- citation light. Another bandpass filter is placed in front of the image intensifier, which amplifies the dye fluo- rescence image, whereas a narrow bandpass filter is placed in front of the other image intensifier to detect the backscattered excitation light only.
The zoom lenses (Fujinon H6XI 1.5B-MDM21) are necessary to make the apparatus compatible with many types of endoscopes. For instance, the size of the en- doscopic image may vary by as much as a factor of 3 according to the type of endoscope used. More impor- tantly, however, if one decreases the size of an image on the intensifier, the intensity per pixel increases, and the signal-to-noise ratio is improved. The consequent loss of resolution can be tolerated easily under these con- ditions. Proximity focused image intensifiers are the only electrooptical devices which can be used in the context of these experiments due to the weak fluorescence yield of the fluorochromes investigated, the small collection efficiency of the endoscope objective, and the necessity to use imaging detectors the optical gain of which can be modulated at radio frequencies. These two-stage, fast- gated image intensifiers (Hamamatsu V5548MOD) have a typical maximum gain of 15,000 candela/mVlux. Their "multialkali" photocathode is sensitive between 180 and 820 nm. The output of their phosphorescent screen (Type P20; kM~x = 550 rim) is coupled to a [739 (H) • 509 (V)-pixel] black-and-white CCD camera (Ha- mamatsu C 5985-10) with relay lenses (Hamamatsu A2098). The modulation of the optical gain of the image intensifiers is performed by changing the voltage be- tween their photocathodes and the input of their micro-
80 Wagni~res, Mizeret, Studzinski, and van den Bergh
Fig. 3. Electronic diagram of the frequency-domain FLIM apparatus.
channel plate. This voltage is controlled by a frequency generator (Hewlett Packard HP 8657B) which is "phase-locked" with the frequency generator control- ling the Pockels cell. A 12-bit phase shifter (Merrimac, West Caldwell, NJ; PLB-3B-10B) controlled by the computer is placed on the 10-MHz reference signal to change the phase of the HP 8657B frequency generator (see Fig. 2).
The overall transmission at 630 nm for this optical setup is 20% if a Storz 0* esophagoscope is used. This transmission concerns all the optical components located between the endoscope objective and the photocathode of the image intensifier.
Signal Processing and Electronic Design
The acquisition and signal processing of the fluo- rescence and backscattered images are performed sepa- rately (Fig. 3). An image is recorded by the CCD for each phase shift (three in our case) between the fluores- cence excitation and the II gain modulation as presented in Fig. 1. The integration time for each of these frames can be set from 40 ms to 1 s. The images are then trans- ferred to a frame grabber as a standard video signal (Comit6 Cousultatif International de Radio-communica- tion, CCIR). After digitization (8 bits) in the frame grab- ber, the images are stored in a video memory (buffer). These buffers (three per channel) are refreshed sequen- tiaUy. Therefore, one given memory always stores an image acquired with the same phase shift. After each acquisition, the three buffers are scanned simultane- ously. For each pixel, the 24 bits (3 • 8 bits) are trans- ferred to a fast programmable "fitting" operator (look-up table) which contains preprogrammed com- puted values of the phase and/or modulation. As the two
channels are synchronized, the output of the two look- up tables concern the same pixel at a given time. These two values are then transferred to the mathematical op- erator (2 • 8-bit look-up table). It calculates the appar- ent fluorescence lifetime of the corresponding pixels from these two values and stores the result in a buffer. For calculation of the fluorescence lifetime based on the phase shift, the operation consists in subtracting the phase of the reference image from the fluorescence im- age and applying expression (1). Similarly, the fluores- cence lifetime can also be obtained from the modulation. It consists of calculating the relative demodulation (Fig. 1) and applying formula (2). Once the whole image is completed, it is converted back to an analog video signal (CCIR) and, finally, overlaid on the color image (Fig. 2). In addition, both the result and the color images can be stored digitally on a hard disk (PC or external) or analogically on video recorders.
The principal difficulty is the synchronization be- tween all electronic devices and the mechanical com- ponents (laser, white light, and reflecting choppers). This synchronization is based on the video signal (clock of one of the CCD) for the analog part of the circuitry (including the analog-to-digital conversion) and by the CPU for the digital part. One of the CCD, that of the backscattered image channel as in Fig. 3, synchronizes the other so that the two images are recorded at the same time. The same synchronization signal is used by the frame grabbers. When the image is fully digitized, the CPU transfers it to the proper video buffer. During the acquisition of the next frame, the CPU scans the content of the 3 + 3 buffers. The outputs of the look-up tables are updated for each new address in 25 ns (static-RAM). The CPU triggers the beginning of the analog conversion to a CCIR signal when the stored image in the output buffer is completed. The three choppers are also con- trolled by the CPU via a timing controller card which also controls the phase shifter.
RESULTS AND DISCUSSION
Our FLIM apparatus was initially evaluated in vitro
using diluted fluorochromes with known fluorescence lifetimes from the literature. (43) Rhodamine 6G (3 ~tg/ml, 'r = 6 ns, kEM = 560 rim) and acridine orange (10 gg/ml, "r = 2 ns, k ~ = 530 rim) were dissolved in water for this purpose and their fluorescence was induced with green (514 nm) light of the argon ion laser modulated at 64 MHz. The lifetimes measured with our apparatus using both the phase shift and the modulation change
Frequency-Domain Fluorescence Lifetime Imaging for Cancer Photodetection 81
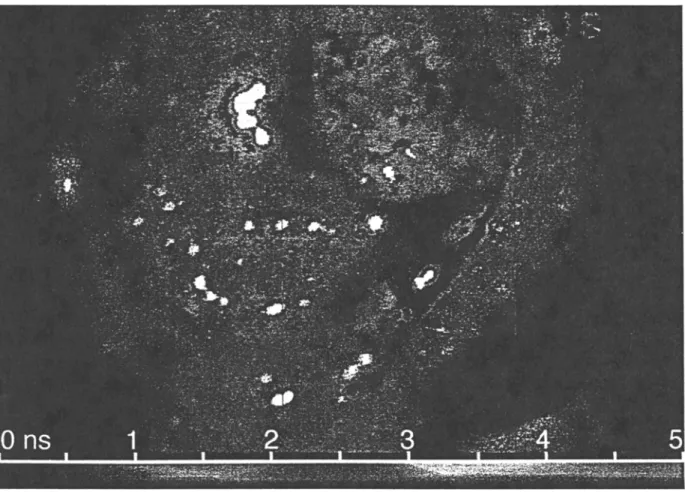
Fig. 4. Fluorescence lifetime image obtained with an opened, excised human bladder. The color of the pixel indicates the fluorescence lifetime,
from 0 ns (deep blue) to 5 ns (red). The area located in the upper right comer fluoresces with a lifetime o f about 0.5 ns (blue), whereas the lower
left area exhibits a longer lifetime of about 2.5 ns (green). The complete tissue sample has been characterized by serial histological sectioning. The short lifetime corresponded to ulceration of the mucous membrane, whereas the other part was normal urothelium. See the text for more information concerning the detection conditions.
were consistent with the predicted values of these life- times.
Preliminary, on-bench experiments were performed on a freshly excised human bladder. This bladder was opened after resection and examined by our FLIM ap- paratus. The fluorescence of the endogenous fluoro- chromes was also induced with green (514-nm) light. This wavelength, according to the literature, corresponds to the absorption of molecules of the flavin molecule family. (4,5~ The illumination intensity of this tissue sam- ple was 1 mW/cm 2. The filter used to reject the fluores- cence excitation light was a longpass k > 550-nm filter and the modulation frequency was 40 MHz. Figure 4 shows the image o f the effective fluorescence lifetime as measured on the basis of the phase-shift. The pixel hue gives the fluorescence lifetime. The area located in the upper right comer fluoresces with a lifetime of about 0.5 ns (blue area in Fig. 4), whereas the lower left area ex-
hibits a longer lifetime of about 2.5 ns (green area in Fig. 4). The complete tissue sample has been character- ized by serial histological sectioning. The short lifetime corresponded to ulceration of the mucous membrane, whereas the other part was normal urothelium. Also, the short fluorescence lifetime corresponded to a strong flu- orescence emission. Several specular reflections which induced saturation are clearly visible in this lifetime im- age (white spots). These saturations were detected by the reference camera. It is unfortunately impossible to elim- inate such artifacts using a standard optical filtration method. One approach consists of assuming that the phase and modulation reference, usually given by the reference image, is uniform over the entire field of view. This assumption is valid as long as Ad < <
2rrc/to,
where c is the velocity of light and Ad is the maximal distance difference between the distal end of the endo- scope and various points of the field of view. Under our
82 Wagni~res, Mizeret, Studzinski, and van den Bergh conditions, this method is feasible as long as the mod-
ulation frequency v = co/2"rr is smaller than typically 50 MHz. Hence, the investigation of finorochromes with a lifetime >5 ns using the FLIM apparatus can be per- formed with one image intensifier only, the reference being detected by a simple "point" detector.
It can be shown that the limitation of such imaging devices based on the tissue autofluorescence is essen- tially due to the shot noise. It is not a straightforward. matter to determine the optimal approach which would enable the effect of this noise on the final result (i.e., the value of the fluorescence lifetime) to be minimized. Var- ious approaches, based on the detection of fluorescence frames at two or more phases, have been proposed by Lakowicz et al. to induce a contrast based on the fluo- rescence lifetime. (39) It has been suggested that the min- imum number of frames necessary to resolve any monoexponential decay is three, which is consistent with the fact that the number of parameters to be determined is also three (i.e., the average amplitude, modulation, and phase; the frequency is known). With noise, the sine wave calculation is not unique, i.e., different acquisition of the same fluorescence will lead to sets of different lifetimes. The number of frames has to be chosen to minimize this distribution. On the one hand, if the num- ber of frames is increased, the fitting is more precise (increase of the redundancy). On the other hand, increas- ing the number of frames will reduce the fluorescence acquisition time per frame and therefore will decrease the signal-to-noise ratio. The results of an analytical study and computer simulation presented elsewhere (44) have shown that the effect of the shot noise on fluores- cence lifetime images is not dependent on the number of frames for a given illumination intensity and total acquisition time. This result is of major importance, as it indicates that lifetime recovery is possible and optimal from three 8-bif images processed in real time using a look-up table or a fast operator.
The study described in the above-mentioned refer- ence has also shown that, for a given excitation fre- quency, the effect of the shot noise on the lifetime image is smaller with phase shift- than with demodulation- based measurements for fluorescence lifetimes which are smaller than 1/co. For fluorescence lifetimes which are longer than 1/co, the situation is inverted, i.e., demodu- lation-based measurements give better results. These simulation and calculation results were verified for dif- ferent modulation frequencies with the tissue samples described above (results not shown here).
These tests on a freshly excised human bladder en- abled us to evaluate the optical parameters specific to this type of photodetection. As the spectral CCD detec-
tor sensitivity (0.15 mJ/cm 2 per frame at 550 nm to ob- tain saturation), the CCD accumulation time (100 ms) per frame and the typical gain of the image intensifiers (103 W/cm2/W/cm 2) were known, it is possible to deter- mine the illumination of the fluorescence image inten- sifier's photocathode. This illumination, due to the tissue autofinorescence, is of the order of 10 -s W/cm 2 if the normal bladder wall is observed from a distance of 20 mm under typical green light illumination intensity (10 mW/cm 2 at 514 nm). Such illumination of the photo- cathode corresponds to 10,000 photons or to 1000 pho- toelectrons per pixel and per frame (photocathode quantum efficiency ~ 10%). Under these conditions, we calculated that the resulting standard deviation is about 1 ns for a lifetime of 5 ns measured at 32 MHz.
As the diameter of the endoscopic image on the image intensifier's photocathode (3 ram), the tissue il- lumination (10 mW/cm2), the overall transmission of the optics (20%), and the diameter and the field of view of the endoscope's objective (300 lxm and 75 ~ respec- tively) are known, the tissue autofluorescence yield can be evaluated. This estimate leads to the value of 10 -3 autofluorescence photons emitted by the tissue per ex- citation photon at 514 urn.
In conclusion, our preliminary study showed that a tissue differentiation can be performed on the basis of tissue autofluorescence only using a fluorescence life- time imaging technique. Moreover, we have shown that such endoscopic tissue characterization can be per- formed in quasi-real time (several refreshes per second) by detecting the optimal number of three phase-resolved fluorescence images.
The experience gained in this study will help in the design of FLIM apparatuses for endoscopic diagnosis.
ACKNOWLEDGMENTS
The authors are grateful to the Fonds National Suisse de la Recherche Scientifique, the Programme prioritaire optique, the CHUV-EPFL-UNIL fund, Ciba- Geigy, the Swiss Cancer League, the Vaudoise, Valais- anne and Genevoise Cancer Leagues, the Fondation Dreyfuss (Lausanne), and the Fondation E. Muschamp for financial support.
REFERENCES
I. P. C. Norwell (1986) Cancer Res. 46, 2203-2207.
2. IL Pasche, M. Savary, and Ph. Monnier (1981) Acta Endosc. II, 9277-291.
F r e q u e n c y - D o m a i n F l u o r e s c e n c e L i f e t i m e I m a g i n g f o r C a n c e r P h o t o d e t e c t i o n 83
3. T. Muto, J. R. Buessey, and B. C. Morson (1975) Cancer 36, 2251-2270.
4. S. Undenfriend (1962) Fluorescence Assay in Biology and Med- icine, Vol. I, Academic Press, New York.
5. G. M. Brenboin, A. N. Domanskii, and K. K. Turoverov (1969)
Luminescence o f Biopolymers in Cells, Plenum Press, New York. 6. R. R. Alfano, D. B. Tata, J. J. Cordero, et al. (1984) IEEE J.
Quant. Electr. 20, 1507-1511.
7. W. Lohmann (1988) Naturwissenschafien 75, 201-202. 8. Y. Yuanlong, Y. Yanmin, L. Fuming, et al. (1987) Lasers Surg.
Med. 7, 528-532.
9. D. Braichotte, G. Wagni~res, Ph. Mormier, et al. (1991) SPIE
1525, 211-218.
10. R. R. Alfano, A. Pradhan, and G. C. Tang (1989) ./. Opt. Soc. Am. B 6(5), 1015-1023.
11. P. N. Yashke, R. F. Bonner, P. Cohen, et al. (1989) Gastrointest. Endosc. 35, 184.
12. R. Marchesini, M. Brambilla, E. Pigoli, et al. (1992) ,I. Photo- chem. Photobiol. B Biol. 14, 219-230.
13. K. T. Schomacker, J. K. Frisoli, C. C. Compton, et al. (1992)
Lasers Surg. Med. 12, 63-78.
14. W. S. Poon, K. T. Schomaker, T. F. Deutsch, et al. (1992) d.
Neurosurg. 76, 679-686.
15. R. Richards-Kortum, R. P. Rava, R. E. Petras, et al. (1991) Pho- tochem. Photobiol. 53, 777-786.
16. R. C. Benson, G. M. Farrow, J. H. Kinsey, et al. (1982) Mayo Clin. Proc. 57, 548-555.
17. G. Wagnii:res, Ch. Depeursinge, Ph. Monnier, et al. (1990) SPIE
1203, 43-52.
18. A. E. Profio, O. J. Balchum, and F. Cartens (1986) Med. Phys.
13, 717-721.
19. T. Hirano, M. lshizuka, K. Suzuki, et al. (1989) Lasers Life Sci.
3(2), 99-116.
20. R.. Baumgartner, H. Fisslinger, D. Jocham, et al. (1987) Photo- chem. Photobiol. 46(5), 759-763.
21. S. Montan, K. Svanberg, and S. Svanberg (1985) Opt. Lett. 10, 56-58.
22. G. Wagni~res, D. Braichotte, A. Chatelain, et al. (1991) SP1E
1525, 219-236.
23. Ph. Monnier, M. Savary, Ch. Fontolliet, et aL (1990) Lasers Med. Sci. 5, 149-169.
24. J. C. Kennedy and R. H. Pottier (1992)J. Photochem. Photobiol.
14, 275-292.
25. M. Forrer, Th. Glanzmann, J. Mizeret, et al. (1995) SPIE 2324, 84-88.
26. P. Jichlinski, H. -J. Leisinger, M. Forrer, et al. (1997)Lasers Surg. Med. (in press).
27. M. Kriegmair, R.. Baumgartner, R. Knuechel, et al. (1994) Urol-
ogy 44(6), 836-841.
28. D. Braichotte, J. -F. Savary, G. Wagni~res, et al. (1994) SPIE
2081, 62-73.
29. S. Folli, G. Wagnii:res, A. P~:legrin, et al. (1992)Proc. Natl. Acad. Sci. USA 89, 7973-7977.
30. S. Mordon, V. Maunoury, J. -M. Devoiselle, et al, (1992)J. Pho- tochem. Photobiol. B Biol. 13, 307-314.
31. H. S. Rye, S. Yue, D. E. Wemmer, et al. (1992) Nucleic Acids Res. 20, 2803-2812.
32. P. Herlin, J. Marnay, J. H. Jacob, et al. (1983) Endoscopy 15, 4- 7.
33. O. Kocher, M. Amaudruz, A. M. Schindler, et al. (1981) .I. Sub- microsc. Cytol, 13, 267-281.
34. L. Massaad, I. de Waziers, V. Ribrag, et al. (1993) Bull. Cancer
80(5), 397-407.
35. G. Weber (1976) Advances in Enzyme Regulation, Vol. 15, Per- gamon Press, New York.
36. S. F. Wang, S. Kitajima, T. Uchida, et al. (1990) Appl. Spectrosc.
44(1), 25-30.
37. W. L. Rumsey, J. M. Vanderkooi, and D. F. Wilson (1988) Sci- ence 241, 1649-1651.
38. M. Kohl, U. Sukowski, and B. Ebert (1993) SPIE 1881, 206-221. 39. J. R. Lakowicz and K. W. Bemdt (1991) Rev. Sci. Instrum. 62(7),
1727-1734.
40. J. R. Lakowicz, H. Szmacinski, K. Nowaczyk, et al. (1992)Anal,
Biochem. 202, 316-330.
41. J. R. Lakowicz, H. Szmacinski, K. Nowaczyk, et al. (1992) Proc. Natl. Acad. Sci. USA 89, 1271-1275.
42. D. E. Pearson (1975) Transmission and Display o f Pictorial In- formation, Pentech, London.
43. F. W. D. Rost (1991) Quantitative Fluorescence Microscopy,
Cambridge University Press, Cambridge.
44. J. Mizeret, G. Wagni~res, A. Studzinski, et al. (1995) SPIE 2627, 40-48.