● ● ● ● ● ● ● ● ● ● ● ● ● ● ● ● ● ● ● ● ● ● ● ● ● ● ● ● ● ● ● ●● ● ● ● ● ● ● ● ● ● ● 0 50 100 150 200 250 300 0.05 0.10 0.15 Number of species
Combined NODF with raw S
A
r=−0.67 ● ● ● ● ● ● ● ● ● ● ● ● ● ● ● ● ● ● ● ● ● ● ● ● ● ● ● ● ● ● ● ● ● ● ● ● ● ● ● ● ● ● ● 101.0 101.5 102.0 102.5 1.0 1.5 2.0 2.5 3.0 3.5Number of species (log scale)
Combined NODF with log
(
S)
B
r=0.06
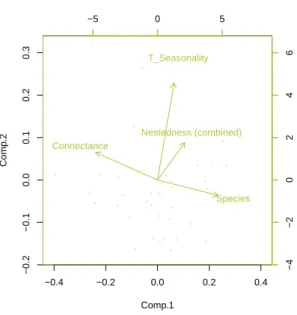
Figure S1: Association of network size with combined nestedness statistic. For 59 observed plant-pollinator networks, Panel A shows the association of the number of species (x-axis) with the combined nestedness statistic calculated using the raw number of species. Panel B shows the association of the number of species on a log scale (x-axis) with the combined nestedness statistic calculated using the log of the number of species. Each point corresponds to one of the 59 networks. The solid lines correspond to the linear regression (intended to guide the eye), and r corresponds to the Pearson correlation (only the correlation with the raw number of species was significant at the 5% confidence level). We reach the same conclusions using randomly-generated networks. −0.4 −0.2 0.0 0.2 0.4 −0.2 −0.1 0.0 0.1 0.2 0.3 Comp.1 Comp .2 . . . . . . . . . . . . . . . . . .. . . . . . . . . . . . . . . . . . . . . . −5 0 5 −4 −2 0 2 4 6 Nestedness (combined) Connectance Species T_Seasonality
Figure S2: Similar to Figure 5C in the main text but without outliers.