Publisher’s version / Version de l'éditeur:
ASHRAE Transactions, 114, pt. 1, pp. 355-368, 2008-07-01
READ THESE TERMS AND CONDITIONS CAREFULLY BEFORE USING THIS WEBSITE. https://nrc-publications.canada.ca/eng/copyright
Vous avez des questions? Nous pouvons vous aider. Pour communiquer directement avec un auteur, consultez la
première page de la revue dans laquelle son article a été publié afin de trouver ses coordonnées. Si vous n’arrivez pas à les repérer, communiquez avec nous à [email protected].
Questions? Contact the NRC Publications Archive team at
[email protected]. If you wish to email the authors directly, please see the first page of the publication for their contact information.
NRC Publications Archive
Archives des publications du CNRC
This publication could be one of several versions: author’s original, accepted manuscript or the publisher’s version. / La version de cette publication peut être l’une des suivantes : la version prépublication de l’auteur, la version acceptée du manuscrit ou la version de l’éditeur.
Access and use of this website and the material on it are subject to the Terms and Conditions set forth at
Balcony spill plumes: full-scale experiments, Part 2
Lougheed, G. D.; McCartney, C. J.
https://publications-cnrc.canada.ca/fra/droits
L’accès à ce site Web et l’utilisation de son contenu sont assujettis aux conditions présentées dans le site LISEZ CES CONDITIONS ATTENTIVEMENT AVANT D’UTILISER CE SITE WEB.
NRC Publications Record / Notice d'Archives des publications de CNRC:
https://nrc-publications.canada.ca/eng/view/object/?id=ae3a4675-278d-4d18-8af9-dea9ed51182e https://publications-cnrc.canada.ca/fra/voir/objet/?id=ae3a4675-278d-4d18-8af9-dea9ed51182ehttp://irc.nrc-cnrc.gc.ca
B a l c o n y s p i l l p l u m e s : f u l l - s c a l e e x p e r i m e n t s ,
P a r t 2
N R C C - 5 0 0 4 1
L o u g h e e d , G . D . ; M c C a r t n e y , C . J .
A version of this document is published in / Une version de ce document se trouve dans: ASHRAE Transactions, v. 114, pt. 1, 2008, pp. 355-368
The material in this document is covered by the provisions of the Copyright Act, by Canadian laws, policies, regulations and international agreements. Such provisions serve to identify the information source and, in specific instances, to prohibit reproduction of materials without written permission. For more information visit http://laws.justice.gc.ca/en/showtdm/cs/C-42
Les renseignements dans ce document sont protégés par la Loi sur le droit d'auteur, par les lois, les politiques et les règlements du Canada et des accords internationaux. Ces dispositions permettent d'identifier la source de l'information et, dans certains cas, d'interdire la copie de documents sans permission écrite. Pour obtenir de plus amples renseignements : http://lois.justice.gc.ca/fr/showtdm/cs/C-42
Balcony Spill Plumes: Full-Scale
Experiments, Part 2 (RP-1247)
ABSTRACT
There have been a number of concerns regarding the balcony spill plume equation provided in North American standards and codes. These include: lack of verification by full-scale experiments and application of the equation for high atria even though it was developed for low-height atria. As a result of these concerns, the American Society of Heating, Refrigerating and Air-Conditioning Engineers (ASHRAE) initiated a project to evaluate the balcony spill plume equation used in North American codes and standards (RP-1247). The research project included CFD modeling studies to investigate smoke entrainment in the balcony area and smoke entrainment in high atria. The primary research conducted, as part of RP 1247, was a series of full-scale experiments conducted to investigate smoke flow in balcony spill plumes and the resulting mechanical exhaust requirements for an atrium. The full-scale experiments included measurements inside the fire compartment and in the opening between the fire compartment and the balcony area. It also included measurements in a simulated atrium space. In Part 2 of this paper, the results of the measurements in the simulated atrium area are discussed. Also, the data was analyzed to estimate the mass flow rate at the end of the balcony and the air entrainment in the atrium space. The experimental entrainment rates are compared with algebraic equations, which are used to estimate the mass flow in an atrium.
INTRODUCTION
There have been a number of concerns regarding the balcony spill plume equation provided in NFPA 92B (2005) and IBC (2003). These include:
1. Lack of verification by full-scale experiments.
2. Application of the equation for high atria even though it was developed for low-height atria.
As a result of these concerns, the American Society of Heating, Refrigerating and Air-Conditioning Engineers (ASHRAE) initiated a project to evaluate the balcony spill plume equation used in North American codes and standards (RP-1247). Three research activities were undertaken:
• Full-scale experiments.
• CFD modeling to investigate smoke entrainment below the balcony and at the balcony edge as the plume spills into an atrium.
• CFD modeling of smoke entrainment into a balcony spill plume for high atria.
The CFD modeling studies were undertaken to address two concerns with the experimental program: 1. The distance between the balcony and the ceiling in the experimental facility was limited (5-7 m). This
distance exceeds the distance required in the initial request for proposals. However, in comparison to scenarios in many North American atria, this distance was a concern.
2. The second concern was the inability to fully investigate the effect of the parameters that affect air entrainment in the balcony area using full-scale experiments.
To address these issues, an effort was made to verify a CFD model using NIST’s Fire Dynamic Simulator (FDS) software (McGrattan et al 2002a; 2002b) for determining smoke entrainment into a spill plume. Detailed results of the modeling studies are provided in masters degree theses by Ko (2006) and McCartney (2006) and summarized in Ko et al. (2007) and McCartney et al. (2007).
The primary research conducted, as part of RP 1247, was a series of full-scale experiments, which investigated smoke flow in balcony spill plumes and the resulting mechanical exhaust requirements for an atrium. An extended set of full-scale experiments was conducted for a fire located in a compartment. Parameters that were varied included the width of the compartment opening and the fire size. Tests were
conducted with and without a downstand in the compartment opening and with and without draft curtains used to channel the flow below the balcony.
The full-scale experiments included measurements inside the fire compartment and in the opening between the fire compartment and the balcony area. It also included measurements in a simulated atrium space. In Part 1 of this paper, the results of the measurements in the fire compartment area are discussed (Lougheed, McCartney and Gibbs 2007).
In this paper, the results of measurements in the simulated atrium space are discussed. The data was analyzed to estimate the mass flow rate at the end of the balcony and the air entrainment in the atrium space. The experimental entrainment rates are compared with algebraic equations that are used to estimate the mass flow in an atrium.
EXPERIMENTAL STUDIES
There have been several experimental studies of balcony spill plumes. Most of these were conducted at the Building Research Establishment (BRE) in the UK using 1/10th scale models (Morgan and Marshall 1975; Morgan and Marshall 1979; Hansell et al. 1993; Marshall and Harrison 1996). Experiments were also conducted by at the University of Canterbury, New Zealand using salt-water modeling (Yii 1998) and a 1/10th scale model similar to that used at BRE (Harrison 2004). Reviews of the experimental studies are provided by Harrison (2004) and Lougheed et al. (2006). A brief summary of the experimental studies is provided in Lougheed et al. (2007).
BALCONY SPILL PLUME CALCULATION METHODS
Several methods for estimating air entrainment in balcony spill plumes have been developed. These include the BRE spill plume method (Morgan and Marshall 1975 and 1979), the correlations developed by Law (1996 and 1995) and the methods developed by Thomas (1987), Poreh et al. (1998) and Thomas et al. (1998). A brief summary of each method is provided in this Section.
The first method that was developed to estimate air entrainment in balcony spill plumes was the BRE spill plume method. The initial physical model studies conducted by Morgan and Marshal (1975; 1979) were used to develop and confirm the method. This approach provides methods for estimating the smoke flow approaching the end of the balcony, the air entrainment as the plume rotates around the spill edge and the smoke production in the ascending plume. The method for estimating the air entrainment in the rising plume was based on the approach used for infinite line plumes developed by Lee and Emmons (1961). Since the balcony spill plume has a finite length, an additional term was developed for use in estimating air entrainment into the ends of the plume. Subsequent experimental and theoretical studies (Morgan 1986; Morgan and Hansell 1987; Hansell, Morgan and Marshall 1993; Marshall and Harrison 1996) were used to further develop the method. Morgan et al. (1999) provide full details for this method.
The BRE spill plume method involves a complex series of calculations. Law (1986) developed a simple correlation for use by designers. The correlation was based on the physical model studies conducted by Morgan and Marshall (1975; 1979). The underlying assumptions in the approach by Law were that a balcony spill plume was analogous to the smoke flow from a window and that the theory developed by Yokoi (1960) for flows from rectangular heat sources could be used as the basis for a simplified equation.
Yokoi (1960) defined three zones for the smoke flow from a rectangular heat source: 1) near zone where the flow is rectangular; 2) intermediate zone where the smoke flow will be similar to that from a line source and 3) the remote zone where the smoke flow will be similar to that from a point source. The height for each zone was dependent on the initial dimensions of the rectangular source and its aspect ratio. Law (1986) used the equations developed by Yokoi for the intermediate zone and thus assumed that the balcony spill plume was analogous to a line plume with a virtual origin below the balcony.
The basic assumption in the methods for estimating the mass entrainment into a spill plume including those developed by Law is that it is analogous to a line plume. Based on this assumption, all the simplified equations for air entrainment into the rising plume are linear with the height of the plume above the balcony edge: B Az m&b = b+ (1) where: b
zb = height above the balcony (m);
A = linear coefficient for air entrainment in line plume (kg/s m);
B = coefficient defining initial conditions for line plume at balcony edge (kg/s).
The coefficients A and B are dependent on parameters such as fire size, opening width, balcony height and mass flow at the end of the balcony.
Using the equations developed by Yokoi (1960) for the intermediate zone, Law (1986) developed relationships for the coefficients A and B in terms of fire size, width of the opening and the height of the balcony. The resulting equation was:
(
)
b p 3 1 2 c p bA
Q
W
z
B
m
&
=
&
+
(2) where: bm& = mass flow rate at height zb (kg/s);
c
Q& = convective heat output (kW); W = length of the spill (m);
zb = height of plume above the balcony edge (m); Ap = linear coefficient for spill plume (kg/s m5/3 kW1/3); BBp = virtual origin term (kg/s).
Law (1986) used the results from the initial physical model experiments conducted at BRE (Morgan and Marshall 1975; Morgan and Marshall 1979) to determine a value for the linear coefficient, Ap, and an estimate for the virtual origin, Bp, based on the height of the balcony. Law (1995) slightly modified the estimate for both the linear coefficient and the virtual origin to derive the following relationship for the mass flow rate in balcony spill plume rate using the experimental data provided by Hansell, Morgan and Marshall (1993):
(
)
( . ) .36Q W z 025H 0 m 2 13 b c b = & + & (3) where: bm& = mass flow rate at height zb (kg/s);
c
Q& = convective heat output (kW); W = length of the spill (m);
zb = height of plume above the balcony edge (m); H = height of the balcony above the base of the fire (m).
Equation 3 is in the form used in CIBSE (1995), which was derived from Law (1995). The principle difference is that the total heat release rate was used in the algebraic relationship in Law (1995) as well as the earlier paper (Law 1986). The version provided in Equation 3 was developed assuming a radiative fraction of 0.35.
The equation in NFPA 92B (2005) was derived from the relationship given in Law (1995). However, the NFPA 92B equation is given in terms of the total heat release rate. If converted to the same form as Equation 3 assuming a radiative fraction of 0.35, the linear coefficient Ap = 0.41.
Law (1995) also provides a method for estimating the width of the spill plume for the scenario with no draft curtains located below the balcony to channel the flow. In this approach, the depth of the balcony, b, is added to the width of the opening to obtain the spill plume width. This approach is also used in NFPA 92B (2005).
Several other algebraic relations for the mass flow rate in balcony spill plumes were developed. Morgan et al. (1999) noted four different methods for calculating smoke production rates developed at BRE: BRE spill plume method, Method by Thomas (1987), Method by Poreh et al. (1998) and Method by Thomas et al. (1998). All of these relationships have the same general form as Equation 2 but differ in the value for the linear coefficient Ap and the parameters used to define the virtual origin.
At the same time as Law (1986) developed the initial correlation for the balcony spill plume, Thomas (1987) provided an alternative correlation for the physical model data (Morgan and Marshall 1975; Morgan and Marshal 1979). This approach was based on the relationship developed by Lee and Emmons (1961) for an infinite line source. A term was included in the equation for determining air entrainment into the ends of the plume. There are two major concerns regarding the Thomas (1987) method: 1) the equation includes the
density of the smoke and 2) the location of the virtual source is dependent on the compartment and fire parameters. Morgan et al. (1999) provide a method for estimating the virtual origin for this approach.
Poreh et al. (1998) used dimensional analysis to determine the mass flow rate for a line plume and the convective heat output of the fire. This approach includes a method for determining the location of the virtual origin. This method estimates the air entrainment into the sides of the spill plume. However, it does not allow for entrainment into the ends of the plume.
Thomas et al. (1998) used rigorous dimensional analysis to develop a relationship for the mass flow rate in a balcony spill plume. This approach does not require the specification of a virtual origin for the plume. However, it does require an estimate for the convective heat release rate and the mass flow rate at the balcony edge. It does not include entrainment into the end of the plume but a separate equation was developed.
The full Method by Thomas (1987) consists of a linear portion for air entrainment in the form of Equation 2. Assuming the virtual origin is determined using the same approach as used by Poreh et al. (1998), the coefficients for the linear portion of Thomas (1987) equation reduce to a form similar to that given by Poreh et al. (1998). The main difference in the two methods is the term for end entrainment, which also includes terms involving the height above the balcony and the virtual origin.
Harrison (2004) also developed equations for the air entrainment into a balcony spill plume. The equations have a similar form to those developed by Poreh et al. (1998) and Thomas et al. (1998). However, the linear coefficient, 0.2, is higher than that used in the earlier correlations (0.16). However, the linear coefficient developed in Harrison (2004) was determined by a fit to a set of physical model experiments and thus includes air entrainment into the end of the plume. The earlier correlations were developed assuming an infinite line plume with an additional term used in some cases to estimate end entrainment.
The correlations developed by Harrison (2004) were based on physical model experiments with a downstand at the end of the balcony. The downstand depth was 0, 0.1 and 0.2 m for the 1/10th scale model. The linear portion of the equation is comparable to correlations used for line plumes (CIBSE 1995):
z L Q 21 0 m 23 l c l & & = . (4) where: l
m& = mass flow rate for line plume at height z (kg/s); c
Q& = convective heat release rate (kW);
Ll = length of longest side of rectangular source (m); z = height above the base of the fire (m).
In summary, the simplified methods for balcony spill plumes all assume a linear equation for the air entrainment with height above the balcony (Equation 2). However, two different approaches were used to determine the linear coefficient, Ap, and the virtual origin term, Bp.
1. Law (1985 and 1995) used a fit to experimental data to determine Ap and the virtual origin.
2. The spill plume methods developed at BRE assumed a vertical line plume in the atrium. Any additional entrainment at the end of the balcony was included in the virtual origin term.
FULL-SCALE EXPERIMENTAL ARRANGEMENT
Experimental Design
The main objective of the experimental program was to determine balcony spill plume mass flow rates produced by steady fires in a compartment with an attached balcony. The steady-state atrium smoke layer elevation was the major dependent variable to be measured. However, in reviewing the literature used to develop the present correlations for air entrainment into balcony spill plumes, it was noted that some key parameters that affect the mass flow rate in the balcony smoke plume also affect the conditions within the fire compartment and the mass flow rate through the compartment opening. These parameters include the fire size (heat release rate), the width of the compartment opening and the presence of a downstand in the opening. In Part 1 of this paper, the experimental results were used to investigate the effects of these parameters on the conditions inside the fire compartment and on the smoke flow through the opening. In this paper, the experimental results are used to investigate the effect of the parameters on the air entrainment in the simulated atrium space.
The parameters that were investigated in the full-scale experiments that affected the conditions both within the compartment and simulated atrium space included: fire size (propane burner fires with heat release rates of 500 to 5000 kW were used), compartment opening width (5.0, 7.5, 10.0 and 12 m) and depth of the downstand in the compartment opening (0 and 1.6 m). These parameters are discussed in more detail in Lougheed et al. (2006) and Lougheed et al. (2007). Two additional parameters that affected the smoke flow in the balcony area were:
1. Balcony Depth – A limited number of tests were conducted without a balcony and a compartment opening of 12 m. However, the majority of the tests were conducted with a 4 m deep balcony. This balcony depth was arbitrarily chosen and is consistent with real applications as well as matching the scale model experiments conducted by Morgan and Marshall (1975; 1979). A study using CFD simulations was used to investigate air entrainment in the smoke flow below the balcony. The results of the modeling studies are discussed in Ko (2006) and Ko et al. (2007).
2. Draft Curtains – Removable panels were used to provide draft curtains to channel the flow to the edge of the balcony. Experiments were conducted without draft curtains and with the draft curtains placed in line with the edges of the compartment opening. Initially, the draft curtains had a depth of 2.0 m, which is comparable with the experiments conducted by Morgan and Marshall (1979). However, there was some smoke flow under the draft curtain with the downstand located in the compartment opening. The depth of the draft curtains was increased to 2.9 m to ensure all the smoke was contained. For the tests without draft curtains, there was no containment at the end of the balcony. The effective spill edge of the balcony included the two end sections in addition to the balcony length. The boundaries of the main facility (i.e. the atrium walls) acted as a secondary draft curtain for all experiments. The effect of draft curtains was also investigated using CFD modelling (Ko 2006; Ko et al. 2007)
The experiments conducted with the widest compartment opening and no compartment opening downstand represent cases of a fire under a balcony. For these experiments, the compartment ceiling acts as a balcony section to give a total balcony depth of 5 m for tests without the balcony section and 9 m with the balcony.
The following experimental parameters were maintained constant throughout the experimental program to reduce costs and simplify the data analysis: fire compartment size, fire location, compartment heat transfer and balcony elevation. Further discussion on these parameters is provided in Lougheed et al. (2006) and Lougheed et al. (2007).
Experimental Facility
In recent years, NRC has conducted joint research projects with ASHRAE related to atrium smoke management in an atrium facility (Lougheed et al. 1999; Lougheed, McCartney and Taber 2000; Lougheed, McCartney and Taber 2001). The atrium portion of the facility utilizes a section of the NRC Burn Hall facility with a footprint of 16.8 m by 30.5 m and a height of 12.2 m. A variable capacity smoke exhaust system was used to extract smoke from near the ceiling.
A 13.8 m wide by 5 m deep by 5 m high fire compartment with attached balcony was located near one end of the atrium (Figure 1). The compartment was constructed using a steel frame lined with sheet steel and protected using 25 mm thick ceramic fiber insulation. The front wall of the test compartment was modular in construction to allow for multiple opening widths. All removable sections forming the front wall of the fire compartment were constructed out of steel and were unlined. All openings were centered on the compartment centerline. A removable downstand could be installed at the top of the opening.
The rear and side walls and ceiling of the compartment were lined with noncombustible ceramic fiber insulation to protect against repeated fire exposure. This material has low thermal conductivity, thus minimizing conductive heat losses through the compartment boundaries and maximizing the temperature and resulting flow velocity of the hot layer exiting the compartment. The compartment floor was concrete.
A 4 m deep balcony was installed over the entire width of the fire compartment. The balcony was constructed of steel with negligible thickness. The underside of the balcony was flush with the ceiling of the fire compartment, allowing unimpeded flow of the exiting hot layer for tests without a downstand. The balcony was 5 m above the floor of the test facility and 7.2 m below the ceiling of the simulated atrium.
Elevation
Figure 1. Experimental facility.
Burner System
Previous investigations at NRC on atrium smoke management (Lougheed et al. 1999; Lougheed, McCartney and Taber 2000) have shown that large scale propane burner systems with dimensions of up to 3 m by 3 m are well-suited to conducting parametric studies since steady, measurable fire sizes can be maintained over extended durations. In this experimental program, a modular propane burner system was located at the center of the fire compartment at an elevation of 0.4 m. The propane was released from pipes forming three concentric squares with sides of 1, 2 and 3 m. Using this burner system, fires with areas of 1, 4 and 9 m2 could be produced. The physical size of the fire was varied depending on the heat release rate so that the fire density, Q& /area, was between 250 and 750 kW/m2. This range has been suggested as an acceptable approximation for typical commercial and retail fire loads (Klote and Milke 2002; Morgan et al. 1999).
The propane volumetric flow rate was measured using rotameters to estimate the total heat release rate of the fire. Combined errors in the propane physical properties and the rotameter system gave a typical heat release rate error range of ±10%.
Instrumentation
Thermocouple trees were installed inside the fire compartment and in the compartment opening. This instrumentation is described in Lougheed et al. (2006) and Lougheed et al (2007).
Since the propane burner fires used in the experimental program produce no visible smoke, accurate temperature measurements were required to determine the smoke layer depth in the simulated atrium. Two vertical arrays of thermocouples were installed in the simulated atrium to determine the atrium smoke layer elevation, one on the compartment centerline at a distance of 21 m from the fire compartment opening and another 4.2 m north of the first array (Figure 1). Each thermocouple tree consisted of 20 thermocouples spaced at 400 mm intervals with the highest thermocouple approximately 200 mm below the ceiling. All thermocouples were Type K without shielding or other types of radiation compensation; the assumed error in these devices is ±2 ˚C.
The mechanical exhaust system was instrumented with a pitot-static tube, micromanometer and two thermocouples to measure the exhaust mass flow rate. The typical error range in the mass flow measurement is approximately ±5%. Oxygen, carbon dioxide and carbon monoxide concentrations in the exhaust duct were also measured for selected tests using infrared and paramagnetic gas analyzers. This data was used to determine the total and convective heat release rate of the propane burner fire. Due to the extremely long filling rate represented by the large volume of the simulated atrium, determination of the heat release rate using the oxygen depletion method proved unfeasible, so gas concentration measurements were abandoned in later experiments.
Eighty-five experiments were conducted with various combinations of compartment geometry and fire size. The standard experiment was conducted with a fixed heat output and compartment and simulated atrium geometry. During the experiment, the ventilation rate for the simulated atrium was varied by running the fan at 5 to 6 different speeds (typically, 0, 12, 24, 36, 48 and 60 Hz).
Before each test, the compartment and simulated atrium geometry was set-up. Instruments were checked and calibrated if required and the exhaust system was set to the lowest flow rate. The data acquisition system was started approximately 60 s prior to ignition to collect ambient data. The data during the test was sampled at 2 s intervals. The propane burner system was ignited manually at a low level then increased to the planned heat release rate and maintained at this level until the end of the test.
SIMULATED ATRIUM RESULTS
This section provides a discussion of the data analysis and experimental results for the simulated atrium.
Temperatures in the Simulated Atrium
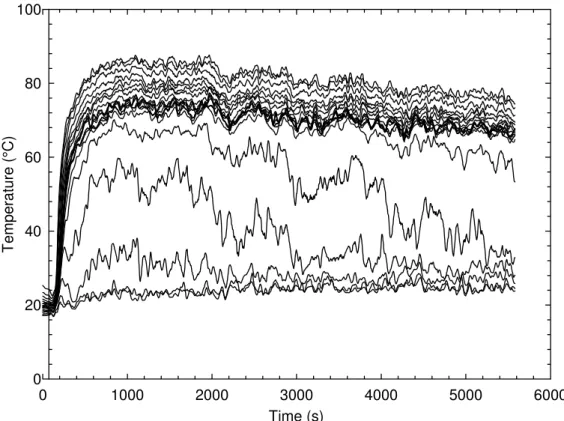
The temperature of the smoke layer in the simulated atrium was measured using two thermocouple trees. The exhaust flow rate was increased in a series of steps during each experiment, resulting in an increase in smoke layer height from step to step. Figure 2 shows typical temperatures measured by the center atrium thermocouple tree for Test 85 with a heat release rates of 3000 kW. The sampling rate was 2 s. A 15-point (30 s) running average was used to smooth the data. The results still appear very noisy. However, this is due in part to the extended time scale. p
Time (s) 0 1000 2000 3000 4000 5000 6000 T e mpe rature (° C) 0 20 40 60 80 100
Figure 2. Typical temperature trends for center atrium thermocouple tree (Test 85).
Using shorter timescales, the temperatures in the upper hot layer and cold lower layer were steady with the variation comparable to the error in the temperature measurement (Lougheed et al. 2006). The largest temperature variations were in the transition zone, which are due to turbulence produced by thermal instabilities between the hot and cold layer, local airflow in the simulated atrium, and variations in the fire size and the flow rate in the mechanical exhaust system. The data in the form shown in Figure 2 indicates there is a smoke layer. As the smoke layer height increases with the higher smoke exhaust rate, there is a decrease in temperature in the smoke layer due to increased mass entrainment into the spill plume. However, it is impossible to determine the location of the smoke layer interface using the raw data plots.
As the first step in determining the smoke layer interface height, the temperatures measured by the thermocouples on the two-thermocouple trees in the atrium were analyzed to determine steady-state temperature profiles. The steps were as follows:
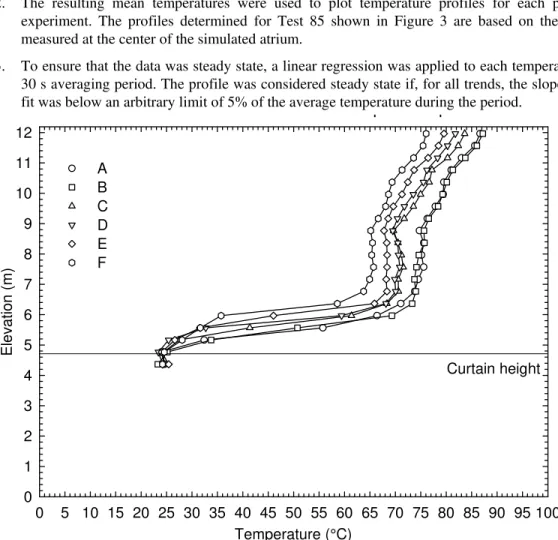
1. The average temperature measured by each thermocouple was determined 60 s before the end of each step in the experiment. The mean temperature for 15 data points (30 s time interval) was determined. 2. The resulting mean temperatures were used to plot temperature profiles for each portion of the
experiment. The profiles determined for Test 85 shown in Figure 3 are based on the temperatures measured at the center of the simulated atrium.
3. To ensure that the data was steady state, a linear regression was applied to each temperature over the 30 s averaging period. The profile was considered steady state if, for all trends, the slope of the linear fit was below an arbitrary limit of 5% of the average tempeprature during the perip od.
Temperature (°C) 0 5 10 15 20 25 30 35 40 45 50 55 60 65 70 75 80 85 90 95 100 El ev ati on ( m ) 0 1 2 3 4 5 6 7 8 9 10 11 12 A B C D E F Curtain height
Figure 3. Temperature profiles for Test 85.
A second atrium thermocouple tree was installed halfway between the center tree on the compartment centerline and the north edge of the facility. Data from this tree was intended to act as a quality check. Overall the general profiles were comparable at the two locations. However, there were some differences between the two sets of measurements (Lougheed et al. 2006):
1. There was an increased temperature near the ceiling due to the ceiling jet produced by the plume. The temperatures were typically slightly higher at the center of the atrium space indicating more influence of the ceiling jet at this location.
2. The temperatures were comparable at the top of the transition zone.
3. There were variations in the temperature within the transition zone. This was due to local flow variations in the experimental area.
4. Temperature differences did occur in the lower cold region in tests with high heat release rate and low mechanical exhaust. In this case, there was leakage of smoke under the draft curtain separating the simulated atrium from the other section of the test facility. As a result higher temperatures were measured at the center of the atrium.
Since there were differences in the temperatures measured at the two locations, both profiles were analyzed for each test to determine the smoke layer interface. Also, as part of the experimental data analysis, the atrium thermocouple trees were compared using the sum of the squared differences at each elevation to identify cases where the layer may be inaccurately measured. The results for those cases with large differences were reviewed to determine if they should be retained or eliminated from further analysis.
Smoke Interface Height
A number of algorithms have been used to determine the interface between the hot and cold layers in a fire compartment. These include the N-percent method, the maximum slope method, the integral method and the temperature-height integral method:
1. Percent Method – The smoke layer elevation is defined as where the temperature rise above ambient is N percent of the maximum temperature rise above ambient occurring in the profile (Cooper et al. 1982). Previous research has shown that values of N = 10-20% and N = 80-90% give elevations consistent with the bottom and top of the transition zone, respectively (Lougheed et al. 1999). Estimates for the elevation of the lower boundary (10 and 20% temperature increase) and upper boundary (80 and 90% increase in temperature) of the transition zone were calculated from the steady-state atrium center temperature profiles. The exact elevation was interpolated between the two measured temperatures, which bounded the temperature rise NΔT.
2. Maximum Slope Method – High density and temperature gradients are present near the bottom of the atrium smoke layer. These gradients are much larger than those found in the atrium smoke layer. The atrium smoke layer can therefore be considered as the elevation at which the temperature profile exhibits maximum slope. Janssens and Tran (1992) applied the maximum slope method in their analyses of data reduction techniques. The accuracy of this method decreases as the temperature gradient in the atrium smoke layer increases. The maximum slope method was applied to the data from the experimental program by determining the two temperatures with the maximum slope dT/dz and assigning their average elevation as the atrium smoke layer elevation.
3. Integral Method – Quintiere et al. (1984) used a method for determining interface height by solving two integral identities for the integrals of temperature and the reciprocal of temperature over the height of the compartment. The two integral identities are:
l i u i c h 0 T h T h h dz T 1 c + − = ∫ (5)
(
c i)
u i l h 0 T h T h h Tdz c + − = ∫ (6)where hc is the height of the compartment, hi is the smoke interface height and Tu and Tl are the temperatures in the hot and cold layers, respectively. While Equation 5 does have physical meaning and is a requirement for mass equivalency, Equation 6 does not have any physical meaning, but retains the same mean temperature as the data.
4. Integral Temperature-Height Curve. – Morgan and Marshall (1979) integrated the temperature-height curve to determine the depth of the smoke layer below the simulated atrium ceiling.
All of these methods define a single smoke layer elevation for a given temperature profile. This is one of the key assumptions of zone modeling with a distinct interface between the hot upper layer and the cold (ambient) layer. In reality, the hot and cold layers in a compartment both have a temperature gradient due to buoyancy and conduction, and are separated by a transition region where the gradient is higher due to turbulent mixing. Each method used to determine the location of the interface height results in different estimates of the smoke layer interface located at different heights in the transition zone.
NFPA 92B (2005) refers to different locations in the transition zone depending on the application. For smoke-filling calculations, the equations estimate the location of the first indication of smoke. This location is near the bottom of the transition zone. For steady state exhaust calculations using the axisymmetric
plume equation, the smoke layer interface height is used. This interface is located near the top of the transition zone.
The four algorithms for determining the smoke layer interface height were applied to the experimental profiles. Preliminary estimates made with the various methods indicated that the higher temperatures measured at the ceiling due to the ceiling jet affected the smoke layer estimates. With the ceiling jet included, the smoke layer interface was in some cases located in the upper hot layer. It was determined that the estimates using the integral and 80% percent methods were improved if the temperatures in the ceiling jet flow were not included in the calculation (Lougheed et al. 2006). That is, the estimated smoke layer interface was near the top of the transition zone (Figure 4). General trends noted for the results for the four algorithms were as follows (Lougheed et al. 2006):
1. The N-percent method is an empirical approach, which can be used to estimate the location of either the top or bottom of the transition zone. Since the primary interest was the location of the top of the transition zone, only the estimates using N = 80 and 90% were considered. Because of variations in the upper layer temperature, the smoke layer interface estimates using 90% could result in an estimated smoke layer interface height in the upper layer. The 80% assumption typically provided an estimate near the top of the transition zone (Figure 4).
2. The maximum slope method in principle should estimate the mid-point of the transition zone. This assumes that the general form of the temperature profile is consistent with an ellipsis curve. However, the variations in the experimental data resulted in localized changes in the temperature-height profile. As a result, the maximum slope method produced estimates, which varied throughout the transition zone.
3. The integral (Quintiere) method provided estimates for the smoke layer interface near the top of the transition zone. The results were typically comparable to the estimates obtained using the 80% temperature increase.
4. The integration of the temperature-height curve produced results comparable to those using the integral method and the 80% estimate. However, this approach showed larger variations in the location of the smoke layer interface.
0
1
2
3
4
5
6
7
8
9
10
11
12
0
20
40
60
80
100
120
Temperature (ºC)
Elevation (m)
Test 82 Profile D
Quintiere
Max. slope
80%
Figure 4. Smoke layer heights Test 82 Profile D center thermocouple tree.
The smoke layer heights determined using the maximum slope, 80% and temperature-height methods were compared with those determined using the integral method for the 400 temperature profiles measured in the simulated atrium (Lougheed et al. 2006). The maximum slope method typically provided a lower estimate for the smoke layer interface than the integral method. There was also a variation in the estimated height due to the variations in temperatures in the transition zone.
The temperature-height estimates for the smoke layer interface were typically lower than the heights estimated using the integral (Quintiere) method (Lougheed et al. 2006). The reason for these differences was not determined. In many cases, the estimated height was at or below the bottom of the transition zone.
The 80% and integral methods gave comparable estimates for the smoke layer interface (Lougheed et al. 2006). The 80% method did predict higher smoke layer levels especially for the smaller fire sizes, which did not have a well-defined hot layer. The comparison improved with larger fire sizes.
Mass Entrainment in the Simulated Atrium
The relationships for mass flow for a spill plume in an atrium are typically in the form of a linear equation relating the mass flow, m&b, to the height, zb, above the balcony (Equation 2).
Using the full-scale data, the variation in the smoke interface height versus the increase in mass flow in the exhaust system can be estimated. Using these estimated values, Equation 6 was used to estimate values for the coefficient Ap:
(
2)
13 c p b b A Q W z m& & = Δ Δ (6)Estimates for the linear coefficient, Ap, were tabulated using the smoke interface heights estimated using the integral and 80% methods (Lougheed et al. 2006). Estimates were determined using the data from both the center and north thermocouple trees.
The integral and 80% methods provide approximate smoke interface heights. The estimates are affected by various factors including the ceiling jet and the changes in temperature profile with increasing exhaust rate. For low mass flow rates, the interface heights could be inverted with increasing exhaust rate. A comparison between the linear coefficient, Ap, determined using the difference in smoke layer interface height determined using the 80% method and the integral method indicates that the values for Ap determined using the 80% method are generally lower than those determined using integral method (Lougheed et al. 2006).
Although there was a good comparison between the interface heights determined using the two approaches, there was minimal difference in interface height with increasing exhaust rate determined using the integral method. This resulted in unrealistically high estimates for the linear coefficient. The coefficients using the 80% methods were used for comparisons with the coefficients presently used in the literature (Lougheed et al. 2006).
Opening Width (m)
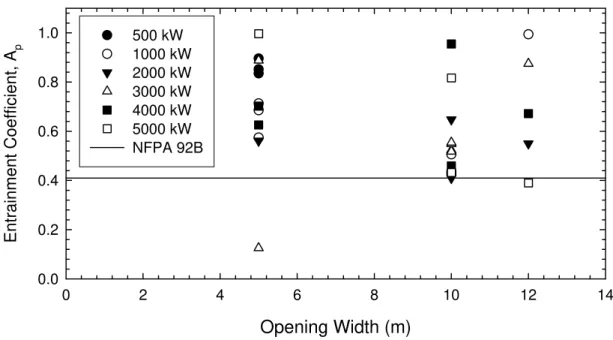
0 2 4 6 8 10 12 14 Ent rainment Coef fic ient , Ap 0.0 0.2 0.4 0.6 0.8 1.0 500 kW 1000 kW 2000 kW 3000 kW 4000 kW 5000 kW NFPA 92BFigure 5. Entrainment coefficient for tests with draft curtains.
Opening Width (m) 0 2 4 6 8 10 12 14 En tra in me nt C o effi cie n t, Ap 0.0 0.2 0.4 0.6 0.8 1.0 500 kW 750 kW 1000 kW 1500 kW 2000 kW 3000 kW 4000 kW 5000 kW NFPA 92B
Figure 6. Entrainment coefficient for tests without draft curtains.
Figures 5 and 6 show plots of the entrainment coefficient versus the opening width for tests with and without draft curtains, respectively. The results shown in the figures were estimated using the 80% method for determining the smoke layer interface height. Also shown in the figures is the coefficient value, 0.41, used in NFPA 92B (1995) assuming a convective heat release component of 65%.
The plume width used in the calculation of the entrainment coefficient for the tests with a draft curtain was the width of the compartment opening, which was equivalent to the spacing between the draft curtains. For the tests without draft curtains, the plume width was the width of the opening plus the depth of the balcony as required in NFPA 92B (2005).
All the estimates for the linear coefficient, Ap, were included in Figures 5 and 6. Possible outriders were not removed from the data set. The results shown in each figure include tests with and without a
downstand and for heat outputs of 500-5000 kW. Overall the entrainment coefficient was independent of these two parameters.
There are a number of factors that contributed to the variation in the results including the uncertainty in estimating the variation in the smoke layer interface. Another factor was the height above the balcony at which the entrainment coefficient was determined. With the low exhaust rates used in some tests, the smoke layer interface height was near the balcony height (< 2 m above the balcony). For these cases, the measurements were in the turning region of the plume where there is a high mass entrainment rate (Morgan and Marshall 1975; Morgan et al. 1999). Also, the base of the transition zone was near the bottom of the draft curtain separating the simulated atrium and the remainder of the test facility. Any smoke leakage under draft curtain will result in a low estimate for the variation in the smoke layer interface height with increasing exhaust rate and thus a high estimate for the entrainment coefficient.
Taking into consideration the uncertainty in the results, the linear coefficient determined using the data for the tests without draft curtains is comparable to the value used in NFPA 92B (Figure 6). As such, the set of full-scale tests without draft curtains are consistent with the approach used for estimating the plume width and the air entrainment in the spill plume.
For the tests with draft curtains, the linear coefficient determined using the experimental data is higher than that used in NFPA 92B particularly for the experiments with a 5 m opening. This set of results indicates very high entrainment into the rising plume. For the experiments with the draft curtains, the smoke flow is concentrated in a narrow region at the end of the balcony and in the rising plume. This smoke flow produced a more localized ceiling jet flow resulting in a recirculation flow in the simulated atrium that would produce additional air entrainment. This effect was investigated by Marshall and Harrison (1996) and was provided as a reason for the need to use the effective layer depth correction in the BRE spill plume method for small atriums.
For scenarios with wider openings both with draft curtains and without draft curtains, the ceiling jet would have a smaller effect. As a result, the linear entrainment coefficients were comparable with those used in NPFA 92B for these cases.
The experimental results indicate that the linear entrainment coefficient used in NFPA 92B is conservative for most scenarios. One exception is the scenario with narrow openings with the smoke confined by draft curtains in a small atrium in which the ceiling height above the balcony edge and the atrium area is limited. In this scenario, there can be additional air entrainment into the smoke layer by the ceiling jet flow. A mall scenario would be one situation in which this could occur. The second exception is the scenario with the smoke layer height near the balcony height. There is high entrainment in the turning region as the spill plume changes from a horizontal flow to a vertical smoke plume (Morgan et al. 1999). CFD modeling studies indicate that the smoke mass flow rate can double in the region between the vertical plane at the end of the balcony and the horizontal plane at the balcony edge (zb = 0) (Ko 2006; Ko et al. 2007).
Plume Mass Flow at the End of the Balcony
BBp is the second parameter in the linear relationship (Equation 2) for the mass entrainment in the spill
plume. This parameter defines the initial conditions at the end of the balcony.
For the relationships used in CIBSE (1995), which is based on the equation developed by Law (1995), and NFPA 92B, the parameter Bp is given by:
(
Q W)
025H A B 2 13 c p p= & . (7) whereBBp = coefficient defining initial conditions for spill plume at the end of the balcony (kg/s);
c
Q& = convective heat output (kW); W = length of the spill (m); H = height of the balcony (m);
Ap = linear coefficient for spill plume (0.36 for CIBSE and 0.41 for NFPA 92B)
The estimated mass flow at the end of the balcony based on the CIBSE and NFPA values for Ap were determined (Lougheed et al. 2006). For the tests with draft curtains, the length of the spill plume is the width of the compartment opening. For tests without draft curtains, the spill plume width is:
W = w + b (8) where:
W = width of the spill (m);
w = width of the opening from the area of origin (m); b = distance from the opening to balcony edge (m).
The results were grouped by the four compartment opening and balcony geometries used in the experiments. These were: 1) no downstand with draft curtains, 2) no downstand without draft curtains, 3) with downstand and draft curtains and 4) with downstand and no draft curtains.
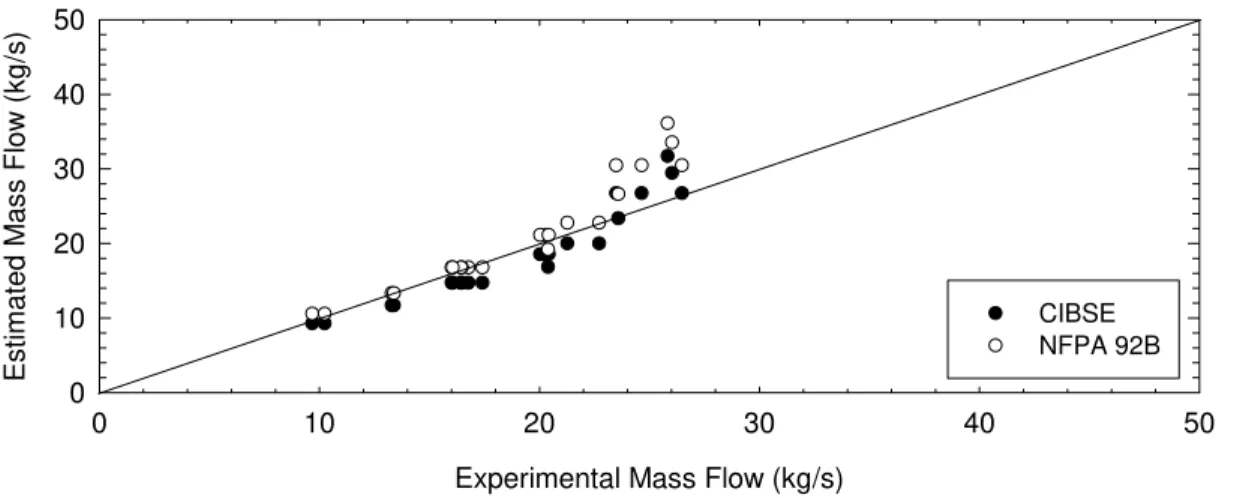
The mass flow rate at the end of the balcony was not measured experimentally. However, this flow rate can be estimated using the experimental results for the mass flow rate through the compartment opening and the factors for air entrainment under the balcony determined using CFD modeling for the four experimental geometries (Ko 2006; Ko et al. 2007). Comparisons with the mass flow rates estimated using Equation 7 are shown in Figures 7-10. Estimates were made using the linear coefficient, Ap, taken from CIBSE (1995) and from NFPA 92B (2005). The estimated results using the NFPA 92B coefficient is 13.8% higher than that determined using the CIBSE coefficient.
Figure 7 shows the comparisons for the scenario without a downstand and with draft curtains attached to the balcony. The estimated mass flow rate at the end of the balcony is comparable to the experimental results. The estimates based on the NFPA correlation are conservative for most cases. The highest differences were for the high mass flow rates. These were typically the experiments with the 10 m opening and the high heat release rates.
Figure 8 shows the comparisons for the experimental scenario without a downstand and without draft curtains. The estimated mass flow rates at the end of the balcony are conservative for this scenario. However, the results for tests with the 12 m opening including those without the balcony extension are included. These experiments gave lower mass flow rates than was expected for this opening width.
Figure 9 shows the comparisons for the experimental scenario with a downstand and with draft curtains. The estimated mass flow rates at the end of the balcony are conservative for this scenario.
Figure 10 shows the comparisons for the experimental scenario with a downstand and without draft curtains. For most cases, the estimated mass flow rates at the end of the balcony are conservative for this scenario. The exception were tests with the 12 m opening and high heat release rates that gave relatively high mass flow rates through the compartment opening (Tests 81, 82 and 85).
Experimental Mass Flow (kg/s)
0 10 20 30 40 50 Est imat ed M a s s Fl ow ( k g /s) 0 10 20 30 40 50 CIBSE NFPA 92B
Experimental Mass Flow (kg/s) 0 10 20 30 40 50 Est imat ed M a s s Fl ow ( k g /s) 0 10 20 30 40 50 CIBSE NFPA 92B
Figure 8. Estimated and experimental mass flow at end of balcony (no downstand and without draft curtains).
Experimental Mass Flow (kg/s)
0 10 20 30 40 50 Es ti m ated Mass Flow (k g/s) 0 10 20 30 40 50 CIBSE NFPA 92B
Figure 9. Estimated and experimental mass flow at end of balcony (with downstand and with draft curtains).
Experimental Mass Flow (kg/s)
0 10 20 30 40 50 Est imat ed M a s s Fl ow ( k g /s) 0 10 20 30 40 50 CIBSE NFPA 92B
Figure 10. Estimated and experimental mass flow at end of balcony (with downstand and without draft curtains).
Based on these results, the mass flow rate at the end the balcony determined using the parameter, Bp, are reasonable but conservative estimates of the mass flow rate. The exceptions were the two cases noted previously.
SIMPLIFIED MODELS FOR BALCONY SPILL PLUME
An underlying assumption in the simplified relationships for the balcony spill plume is that the entrainment in the atrium can be determined assuming it is a vertical line plume. In fact, the linear entrainment coefficients for several of the relationships (Thomas 1987; Poreh et al. 1998; Thomas et al. 1998; Harrison 2004) are less than or comparable to the entrainment coefficient used in CIBSE (1995) for a line plume originating in the atrium. The ones with lower linear entrainment coefficients were developed assuming an infinite line plume and additional relationships are used to include end entrainment.
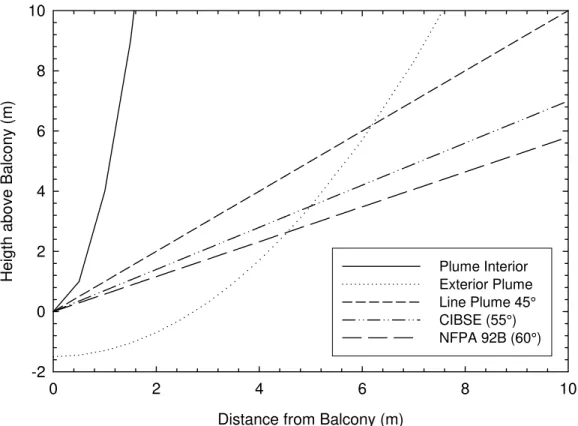
Initially, at the end of the balcony, the smoke flow is in the horizontal direction. Figure 11 shows an approximate trajectory for the top and base of the spill plume assuming the smoke flow depth is approximately 1.5 m. In determining the trajectories, it was assumed that the plume has a parabolic trajectory in the initial stage. The thickness of the plume at the end of the balcony is typical of those found in a series of tests in which the temperature profiles were measured under the balcony and at the end of the balcony (Lougheed et al. 2006). Also, the locations of the inner and outer boundaries of the plume at the 1 m height are consistent with experimental results.
The initial trajectory of the maximum temperature in the spill plume as it projects into the atrium was also determined (Lougheed et al. 2006). Based on the limited results measured at the 1 m height, the maximum temperature in the plume was between 1 and 2 m from the end of the balcony with the location depending on whether draft curtains were used. This indicates that, as the plume initially enters the atrium area, the location of the maximum temperature in the plume follows a linear trajectory, which is between 45° and 60° to the vertical.
The spill plume relationship developed by Law (1986; 1995) used experimental data to determine the entrainment parameter for the spill plume in the atrium space. A comparison of the CIBSE equations (CIBSE 1995) for a line plume and the spill plume (Equations 3 and 4) indicates that the relationship is equivalent to assuming a line plume trajectory in the atrium at 55° to the vertical axis. This linear approximation to the spill plume is shown in Figure 11. Also, shown are linear trajectories at 45° and 60° to the vertical. The latter is based on the correlation in NFPA 92B (2005).
The simplified model indicates that the algebraic relationship for the balcony spill plume based on Law’s analysis includes two basic assumptions:
1. The virtual origin term estimates the mass flow rate at the end of the balcony. The results of the full-scale experiments indicate that the empirical correlation given by Equation 7 provides a conservative estimate for the four scenarios investigated (see Figures 7-10).
2. The linear term estimates the air entrainment in the spill plume in the atrium area assuming a line plume, which has a trajectory of approximately 55° to 60° to the vertical. The full-scale estimates for the linear coefficient, Ap, are consistent with this assumption. This model is also consistent with the visual observations of the plume in the simulated atrium.
Distance from Balcony (m) 0 2 4 6 8 10 H e ig th a b o v e B a lc on y (m) -2 0 2 4 6 8 10 Plume Interior Exterior Plume Line Plume 45° CIBSE (55°) NFPA 92B (60°)
Figure 11. Spill plume trajectories.
The results of the full-scale experiments confirm the balcony spill plume relationship used in NFPA 92B for the near field. With this approach, the additional air entrainment into the plume resulting from the horizontal flow as the plume enters the atrium is accounted for by assuming a tilted line plume. However, as the plume rises in the atrium, the buoyancy effects will result in an increase in the vertical velocity and air entrainment into the plume will decrease the horizontal velocity resulting in a vertical plume. In this case, the use of a tilted line plume model would result in an over prediction of the air entrainment. The effect on the far field estimates is discussed by Lougheed et al. (2006) and McCartney et al. (2007).
With the limited height of the simulated atrium used for the full-scale tests, the estimates for the linear coefficient were determined typically between 2 and 4 m above the balcony. The estimates for the linear coefficient using the results from the lower heights will result in higher estimates. This was particularly the case for tests with high horizontal velocities such as those with the 5 m opening and draft curtains. In these cases, there was also indication that there was additional entrainment due to the recirculation of the ceiling jet flow. The estimated linear trajectory for the plume was between 70° and 80° to the vertical. Such linear trajectories do not provide a realistic approximation of the plume trajectory in the near field and would result in very high estimates for mass entrainment at higher heights. Overall, the present CIBSE (1995) and NFPA 92B (2005) provide better estimates for the smoke entrainment into the spill plume in the near field above the balcony.
The other approach to determining the mass entrainment into the spill plume was to assume a vertical line plume in the atrium. Various methods were used to estimate the additional air entrainment as the plume entered the atrium. For example, Morgan and Marshall (1975) developed a relationship for the additional mass entrainment at the balcony edge. Above the balcony, the air entrainment into the plume was determined assuming a vertical line plume. This included a relationship Morgan and Marshall (1975) for the air entrainment in the rotation region.
Poreh et al. (1998), Thomas et al. (1998) and Harrison (2004) provide various methods for estimating the additional mass entrainment into the plume as it enters atrium. Typically, these relationships are related to the mass flow rate at the end of the balcony. It is also assumed that this flow rate can be approximated by the mass flow through the compartment opening (Morgan et al. 1999). This assumption is reasonable for
the scenario without a downstand and with draft curtains in which there is limited entrainment into the smoke flow under the balcony (Ko 2005; Ko et al. 2006).
As with the BRE spill plume method, the simplified equations for the air entrainment into the plume developed by Poreh et al. (1989) and Thomas et al. (1998) assume a vertical line plume in the atrium space. An essential element in these approaches is the estimate of the initial mass at the balcony edge. The trajectories for the plume shown in Figure 11 indicate there is considerable horizontal flow as the plume enters the atrium. With such a trajectory, there can be considerable air entrainment in the plume before it reaches the balcony height (zb = 0). This is consistent with the findings of the CFD investigations, which showed that the mass flow at the end of the balcony could be doubled at the edge of the balcony (zb = 0) (Ko 2005; Ko et al. 2006). The correlations developed by Ko (2005) and Ko et al. (2006) using CFD simulations provide an alternative method for estimating the mass flow rate at the balcony edge. These correlations could also be used to generalize the simplified equations based on the vertical line plume assumption.
CONCLUSIONS
There have been a number of concerns regarding the balcony spill plume equation provided in North American standards and codes. These include: lack of verification by full-scale experiments and application of the equation for high atria even though it was developed for low-height atria. As a result of these concerns, ASHRAE initiated a project to evaluate the balcony spill plume equation used in North American codes and standards (RP-1247). The research project included CFD modeling studies to investigate smoke entrainment in the balcony area and smoke entrainment in high atria. However, the primary portion of the research conducted, as part of RP 1247, was a series of full-scale experiments conducted to investigate smoke flow in balcony spill plumes and the resulting mechanical exhaust requirements for an atrium.
The balcony spill plume scenario has primarily been investigated using 1/10th scale physical models. The full-scale experiments conducted for RP-1247 is the first time that an extensive series of full-scale experiments have been used to investigate the effect of the various parameters on air entrainment into a balcony spill plume. These experiments also provided data on the effect of the opening width, the presence or absence of a downstand and the fire size on the conditions within the fire compartment and in the compartment opening.
Temperature profiles were measured in a simulated atrium for a range of fire sizes and test geometries. The results from these measurements were used to estimate the air entrainment into the spill plume. The estimated mass entrainments were compared with those estimated using the algebraic equations for a balcony spill plume provided in design guides and standards including CIBSE and NFPA 92B. Both of the algebraic equations typically provide comparable but conservative comparisons to the experimental results. The NFPA 92B equation, which uses a higher linear entrainment coefficient, Ap, typically produces more conservative estimates for the mass entrainment than the CIBSE equation.
The results indicate the air entrainment in the atrium area estimated using the present design equations provides reasonable estimates for the region near the balcony for most scenarios (i.e. in the near field). One exception was the scenarios with draft curtains and a narrow (5 m) opening. In this case, higher estimates for air entrainment were determined. These results were consistent with the results of previous investigations conducted at BRE that indicated that the recirculation of the ceiling jet flow could produce additional air entrainment in spaces with limited ceiling height and area.
The second exception was for scenarios in which the smoke layer was immediately above the balcony (< 2 m). In this case, the high entrainment in the balcony area can result in higher air entrainment than estimated using the algebraic equations.
The experimental results for air entrainment into the spill plume for scenarios without draft curtains were consistent with the results determined using the algebraic equations. For these calculations, the effective width of the plume that spilled into the simulated atrium was determined using Equation 8 developed by Law (1995) and used in NFPA 92B (2005).
REFERENCES
CIBSE. 1995. Relationships for smoke control calculations, Technical Memoranda TM19:1995, London, UK: Chartered Institution of Building Services Engineers.
Cooper, L., Harkleroad M., Quintiere J. and Rinkinen W. 1982. An Experimental Study of Upper Hot Layer Stratification in Full-Scale Multiroom Scenarios, Journal Heat Transfer, 104, p. 741-749.
Hansell, G.O., Morgan, H.P. and Marshall, N.R. 1993. Smoke flow experiments in a model atrium. BRE Occasional Paper OP55, Borehamwood, UK: Building Research Establishment.
Harrison, R. 2004. Smoke Control in Atrium Buildings: A Study of the Thermal Spill Plume, Fire Engineering Research Report 04/1, Christchurch, NZ: University of Canterbury.
IBC. 2003. International Building Code. Falls Church, VA: International Code Council, Inc.
Janssens, M. L and Tran, H. C. 1992. Data Reduction of Room Tests for Zone Model Validation, Journal of Fire Sciences, 10, p. 528-555.
Klote, J.H. and Milke, J.A. 2002. Principles of Smoke Management, Atlanta, GA: American Society of Heating, Refrigerating and Air-Conditioning Engineers.
Ko, Y.J. 2006. CFD Study of the Balcony Spill Plume: Focused on the Balcony Area, Master of Engineering in Civil Engineering Thesis, Ottawa, ON: Carleton University.
Ko, Y.J., Hadjisophocleous, G. and Lougheed, G. 2007. CFD Study of the Air Entrainment of Balcony Spill Plumes at the Balcony Edge, ASHRAE Transactions, to be published.
Law, M. 1986. A Note on Smoke Plumes from Fires in Multi-Level Shopping Malls, Fire Safety Journal, 10, p. 197-202.
Law, M. 1995. Measurements of balcony smoke flow, Fire Safety Journal, 24, p. 189-195.
Lee, S-L and Emmons, H.W. 1961. A study of convection above a line fire, Journal of Fluid Mechanics, 11, p. 353-368.
Lougheed, G.D., Hadjisophocleous, G.V., McCartney, C. and Taber, B.C. 1999. Large-scale physical model studies for an atrium smoke exhaust system, ASHRAE Transactions, 105, (Part 1), p. 676-698. Lougheed, G.D., McCartney, C., Taber, B.C. 2000. Smoke movement for sprinklered fires, ASHRAE
Transactions, 106, (Part 1), p. 605-619.
Lougheed, G.D., McCartney, C., Taber, B.C. 2001. Sprinklered mercantile fires, ASHRAE Transactions, 107, (Part 1), p. 730-743.
Lougheed, G.D., McCartney, C.J and Gibbs, E. 2006. Balcony Spill Plumes, Final Report Research Project 1247, Ottawa, Ontario: National Research Council.
Lougheed, G.D., McCartney, C.J. and Gibbs, E. 2007. Balcony Spill Plumes: Full-Scale Experiments, Part 1, ASHRAE Transactions, to be published.
Marshall N. R. and Harrison R. 1996. Experimental studies of thermal spill plumes. Building Research Establishment Occasional Paper, OP1, Borehamwood, UK: Building Research Establishment.
McCartney, C. 2006. CFD Investigation of Balcony Spill Plumes, Master of Applied Science in Mechanical Engineering Thesis, Waterloo, ON: University of Waterloo.
McCartney, C., Lougheed, G.D. and Weckman, E.J. 2007. CFD Investigation of Balcony Spill Plumes in Atria, ASHRAE Transactions, to be published.
McGrattan, K.B., Baum, H.R., Rehm, R.G., Hammins, A., Forney, G.P. and Prasad, K. 2002a. Fire Dynamics Simulator (Version 3) – Technical Reference Guide, NISTIR 6783, Gaithersburg, MD: National Institute of Standards and Technology.
McGrattan, K.B., Forney, G.P., Floyd, F.E., Hostika, S. and Prasad, K. 2002b. Fire Dynamics Simulator (Version 3) – User Guide, NISTIR 6784, Gaithersburg, MD: National Institute of Standards and Technology.
Morgan, H.P. 1986. The horizontal flow of buoyant gases toward an opening. Fire Safety Journal, 11, pp 193-200.
Morgan, H.P., Ghosh, B.K., Garrard, G., Pamlitschka, R., De Smedt, J-C and Schoonbaert, L.R. 1999. Design Methodologies for Smoke and Heat Exhaust Ventilation, London, UK: Construction Research Communications Ltd.
Morgan H P and Hansell G O. 1987. Atrium buildings: calculating smoke flows in atria for smoke control design. Fire Safety Journal, 12, p 9-35.
Morgan, H.P. and Marshall, N.R. 1975. Smoke Hazards In Covered, Multi-Level Shopping Mall: an experimental-based theory of smoke production, BRE CP48/75, Borehamwood, UK: Building Research Establishment.
Morgan, H.P. and Marshall, N.R. 1979. Smoke Control Measures in a Covered, Two-Level Shopping Malls; An Experimentally Based Theory for Smoke Production, BRE CP48/75, Borehamwood, UK: Building Research Establishment.
NFPA. 2005. NFPA 92B, Standard for Smoke Management Systems in Malls, Atria and Large Spaces, Quincy, MA: National Fire Protection Association.
Poreh, M., Morgan, H.P., Marshall, N.R. and Harrison, R. 1998. Entrainment by two dimensional spill plumes in malls and atria, Fire Safety Journal, 30, p. 1-19.
Quintiere, J.G., Rinkinen, W.J. and Jones, W.W. 1981. The effects of room openings on fire plume entrainment, Combustion Science and Technology, 26, p. 193-201.
Quintiere, J., Steckler, K. and Corley, D. 1984. An Assessment of Fire Induced Flows in Compartments, Fire Science and Technology, 4, p. 1-14.
Thomas, P.H. 1987. On the upward movement of smoke and related shopping mall problems, Fire Safety Journal, 12, p. 191-203.
Thomas, P.H., Hinkley, P.L., Theobald, C.R. and Simms, D.L. 1963. Investigation of the flow of hot gases in roof venting, Fire Research Technical Paper No. 7, London, UK: The Stationary Office.
Thomas, P.H., Morgan, H.P., Marshall, N.R. 1998. The spill plume in smoke control design, Fire Safety Journal, 30, p. 21-46.
Yii E H. 1998. Exploratory salt water experiments of balcony spill plume using laserinduced fluorescence technique. Fire Engineering Research Report, Christchurch, NZ: University of Canterbury.
Yokoi, S. 1960. Study on the prevention of fire spread by hot upward current. Report 34, Tokyo, Japan: Building Research Institute.