Publisher’s version / Version de l'éditeur:
Vous avez des questions? Nous pouvons vous aider. Pour communiquer directement avec un auteur, consultez la
première page de la revue dans laquelle son article a été publié afin de trouver ses coordonnées. Si vous n’arrivez pas à les repérer, communiquez avec nous à PublicationsArchive-ArchivesPublications@nrc-cnrc.gc.ca.
Questions? Contact the NRC Publications Archive team at
PublicationsArchive-ArchivesPublications@nrc-cnrc.gc.ca. If you wish to email the authors directly, please see the first page of the publication for their contact information.
https://publications-cnrc.canada.ca/fra/droits
L’accès à ce site Web et l’utilisation de son contenu sont assujettis aux conditions présentées dans le site LISEZ CES CONDITIONS ATTENTIVEMENT AVANT D’UTILISER CE SITE WEB.
11th Canadian Building Science and Technology Conference [Proceedings], pp.
1-16, 2007-03-22
READ THESE TERMS AND CONDITIONS CAREFULLY BEFORE USING THIS WEBSITE. https://nrc-publications.canada.ca/eng/copyright
NRC Publications Archive Record / Notice des Archives des publications du CNRC :
https://nrc-publications.canada.ca/eng/view/object/?id=55aa4521-52d0-4e09-ae21-2de2ff5d171c https://publications-cnrc.canada.ca/fra/voir/objet/?id=55aa4521-52d0-4e09-ae21-2de2ff5d171c
NRC Publications Archive
Archives des publications du CNRC
This publication could be one of several versions: author’s original, accepted manuscript or the publisher’s version. / La version de cette publication peut être l’une des suivantes : la version prépublication de l’auteur, la version acceptée du manuscrit ou la version de l’éditeur.
Access and use of this website and the material on it are subject to the Terms and Conditions set forth at
Field assessment of the effect of different spectrally selective low
emissivity glass coatings on the energy consumption in residential
application in cold climates
Swinton, M. C.; Manning, M. M.; Elmahdy, A. H.; Parekh, A.; Barry, C.;
Szadkowski, F.
http://irc.nrc-cnrc.gc.ca
F i e l d a s s e s s m e n t o f t h e e f f e c t o f d i f f e r e n t
s p e c t r a l l y s e l e c t i v e l o w e m i s s i v i t y g l a s s
c o a t i n g s o n t h e e n e r g y c o n s u m p t i o n i n
r e s i d e n t i a l a p p l i c a t i o n i n c o l d c l i m a t e s
N R C C - 4 9 4 8 1
S w i n t o n , M . ; M a n n i n g , M . ; E l m a h d y , H . ; P a r e k h ,
A . ; B a r r y , C . ; S z a d k o w s k i , F .
A version of this document is published in / Une version de ce document se trouve dans: 11th Canadian Conference on Building Science and Technology, Banff, Alberta, March 22, 23, 2007, pp. 1-16
The material in this document is covered by the provisions of the Copyright Act, by Canadian laws, policies, regulations and international agreements. Such provisions serve to identify the information source and, in specific instances, to prohibit reproduction of materials without written permission. For more information visit http://laws.justice.gc.ca/en/showtdm/cs/C-42
Les renseignements dans ce document sont protégés par la Loi sur le droit d'auteur, par les lois, les politiques et les règlements du Canada et des accords internationaux. Ces dispositions permettent d'identifier la source de l'information et, dans certains cas, d'interdire la copie de documents sans permission écrite. Pour obtenir de plus amples renseignements : http://lois.justice.gc.ca/fr/showtdm/cs/C-42
Field Assessment of the Effect of Different Spectrally
Selective Low Emissivity Glass Coatings on the
Energy Consumption in Residential Application in
Cold Climates
Mike Swinton1
Marianne Manning2, Hakim Elmahdy3, Anil Parekh4, Chris Barry5,Frank Szadkowski6
ABSTRACT
The question: “How large an effect can changing the glazing system’s solar heat gain characteristics have on the overall energy consumption of a house?” can be posed by energy analysts, homeowners and glazing specialists alike. In an effort to quantify such an effect, two sealed, low emissivity, insulating glazing systems (with different solar transmission properties) were evaluated in a side-by-side experiment involving twin-houses, comparing their respective effects on house heating energy consumption (i.e., natural gas for space heating and electricity for air distribution) in a cold climate. This research project was conducted at the Canadian Center for Housing Technology (CCHT) located on the National Research Council Campus in Ottawa. This facility consists of two R-2000 houses that are very nearly identical in every aspect, and are fully instrumented.
First, benchmarking of the two houses was performed using a high solar transmission low emissivity coating on surface 3 of all double glazed argon filled windows and patio doors in both houses (29 windows and both the fixed and sliding portions of a patio door were included). Then, all insulating glazing units in the Test House were replaced by insulating glazing systems with a low solar transmission low emissivity coating on surface 2 of double glazed argon filled
windows. Air leakage tests for both houses, using a blower door, were also performed before and after replacing the glazing units.
During the winter monitoring period (four weeks from January 19 to February 15, 2006), natural gas and electricity consumption and air and window surface temperature measurements were recorded and analyzed. The preliminary results showed that the use of low solar transmission glazing systems increased the gas consumption in the Test House by about 8.7% relative to its performance with the high solar transmission glazing. In addition, the electric consumption was also increased by about 1.3% as a result of the reduced solar heat gain during the monitoring period.
1
Mr. Mike Swinton is a Principal Research Officer with the Institute for Research in Construction, National Research Council of Canada, Ottawa, Ontario.
2
Ms. Marianne Manning is a Technical Officer with the Institute for Research in Construction, National Research Council of Canada
3
Dr. Hakim Elmahdy is a Principal Research Officer with the Institute for Research in Construction, National Research Council of Canada
4
Mr. Anil Parekh is a Senior Researcher with CANMET Energy Technology Centre, Natural Resources Canada, Ottawa, Ontario
5
Mr. Chris Barry is the Director of Technical Services, Pilkington North America 6
This paper provides details about the CCHT, testing protocol, and the variation of the interior and exterior glass surface temperatures on a selected number of windows at different orientation. This research program also includes monitoring of energy consumption during summer cooling period, and computer simulation using HOT2000 and other simulation tools to compare actual testing and computer simulation results. However, the summer monitoring and computer modelling results are not part of this paper.
INTRODUCTION
Windows and other types of fenestration systems are key components of all types of buildings. On the energy performance, windows play a dual role, allowing solar gains to offset the auxiliary heating loads during the heating season or add to building loads during the cooling season. Various research studies have shown that, in a typical Canadian house with generous proportions of window surface area using a conventional window technology, the window heat losses during the heating season can account for up to 40% of the total heat losses. The solar gains typically range from 10% to 27% of total energy requirements for the house. During the summer months, excessive solar gains through windows add to cooling loads. During the last two decades, significant research efforts have resulted in the development of high thermal performance, low emissivity coated glass in windows. The products available today have generally much better insulating values; however, many may have lower solar heat gains. The low emissivity technology in question is relatively new - 'state-of-the-art' technology that can be termed 'early commercialization'. The breakthrough came in the last 8 years with a reduction in emissivity from 0.2 to 0.15 or lower, while maintaining high solar heat gain coefficients (SHGC). The actual solar heat gain through the glazing system is greatly affected by the solar/optical characteristics of the coating on the glass. Knowledge of the actual coating performance is essential in setting energy targets and extracting information to determine the effect of the high efficient windows on energy rating, load management, and reduction of space heating load as well as reduction of the cooling load demand.
Advanced glazing systems usually include a spectrally selective glass composition, with or without a low emissivity coating, (more common in commercial buildings) or a spectrally selective, low emissivity coating, to provide some means of control of the solar heat gain though windows. Low emissivity coating on glass is mostly effective during cold periods, when the room’s infrared radiation is retained in the enclosed space. There exist, however, solar characteristics of the film that control how much solar heat is transmitted through the glazing during the daytime and enters into the indoor environment. Proper selection of the coated glass may have different benefits during heating and cooling seasons. Glass manufacturers have made available several types of coated glass intended to provide a wide selection of spectrally selective glass. In most cases, the thermal performance characteristics of these glazing and their effect on the heating and cooling loads in buildings are based on computer simulations with limited field experiments to verify or validate their effect on whole-house heating and cooling. With rising cooling loads and associated peak electric demands in large population centers, there is a need to optimize the selection of windows in houses which can provide greater overall energy efficiency during the heating season along with better solar control during the summer months.
This project is to provide technological assessment of the performance of low emissivity, spectrally selective coatings on glass intended for use in residential (or commercial) buildings. An evaluation of two glazing systems was performed at the Canadian Centre for Housing
to assess their performance on a comparative basis. Details about the research houses, methodologies and the glazing systems are included in this paper.
This project is a collaborative effort between Pilkington (the Client), the National Research Council Canada Institute for Research in Construction (NRC/IRC) and Natural Resources Canada (NRCan).
OBJECTIVES
The objective of this winter experiment was to perform comparative field assessment of the thermal performance of advanced glazing systems in a twin-house facility and to quantify the effect of the use of these glazing systems on the overall space heating requirement of the house. A secondary objective was to identify the differences in performance characteristics of the glazing units themselves in terms of solar transmission to the house and changes in window surface temperatures that would quantify in real terms some of the factors influenced by the glazing characteristics, and their resulting effect on the energy savings.
The overall experiment (including winter experiments, summer experiments and modelling) was designed to demonstrate the greater net value of a high solar gain CVD (chemical vapour deposition) low emissivity coating compared to the low solar gain of a near infrared (IR) reflective sputtered low emissivity coating. The resulting hypothesis to be tested was thus: “During the long winter heating season, the value of the free passive solar energy should be significantly greater than the cost of the small increase in summer air conditioning load during the short cooling season, despite the slightly higher U-Factor losses of the CVD coating.”
This paper reports on the results of the winter experiment. Summer experiments were performed in the same year. The performance assessments generated by the two sets of experiments would be used to benchmark and validate some models commonly used by industry. The results of the summer experiments and model benchmarking and validation will be reported in subsequent papers relating to this project.
DESCRIPTION OF THE GLAZING TECHNOLOGY
High performance windows for residential glazing control undesirable heat gains and heat losses. In the colder northern half of North America, heat losses dominate and it is desirable to minimize heat loss and maximize solar gains to achieve satisfactory cold-climate performance. The heat transmission coefficient (U-Factor) value of single glazed unit, 5.96 W/m2.ºC can be reduced to 2.84 W/m2.ºC by double glazing and further reduced to around 1.7 W/m2.ºC by tripling the glazing or by using a low emissivity coating with double glazing. Solar heat gains, while unwanted in summer, are beneficial in winter for heating purposes. Transparent, low emissivity coatings all reflect invisible far infrared wavelengths and so all reduce conductive window heat transfer. Low emissivity coatings transmit, or reflect, or absorb significant amounts of invisible near-IR solar energy, thus affecting the net solar heat gain of a residence. The SHGC (Solar Heat Gain Coefficient) is a measure of this net solar heat gain. Low emissivity coatings are essentially visibly clear in appearance, transmitting over 55% of daylight when double-glazed, with
negligible visible tint or reflectivity.
Sputtered low emissivity coatings can have lower emittance, thermal conductivity, and lower solar heat gain values than the hard CVD coatings. Sputtered coatings are made in a vacuum chamber. These coatings are ‘soft’, and need to be ‘edge deleted’ to allow for a durable insulating
glass seal. They also need to be protected from atmospheric moisture by enclosing them within a sealed double glazed unit.
CVD coatings are made with a hard low emissivity coating, pyrolytically applied to hot glass, at atmospheric pressure. They can be exposed to atmospheric humidity and water, and even single glazed with the coating exposed, if desired.
A residential designer’s dilemma is to select the most cost effective, thermally appropriate glazing, while still allowing high visible light transmission.
In the benchmark configuration, both the Test House and the Reference house at CCHT were glazed with high solar heat gain, CVD coated low emissivity sealed double glazed units (center of glass U-Factor = 1.65 W/m2°K (0.29 Btu/hr.ft2.°F), SHGC = 0.72).
In the experimental configuration, the Reference House was left in Benchmark condition
(unchanged) and the Test house was re-glazed with a low solar heat gain, low emissivity, sputter-coated low emissivity glass, (center of glass U-Factor = 1.36 W/m2°K (0.24 Btu/hr.ft2.°F), SHGC = 0.41).
EXPERIMENTAL SETUP
DESCRIPTION OF CCHT TWIN HOUSES
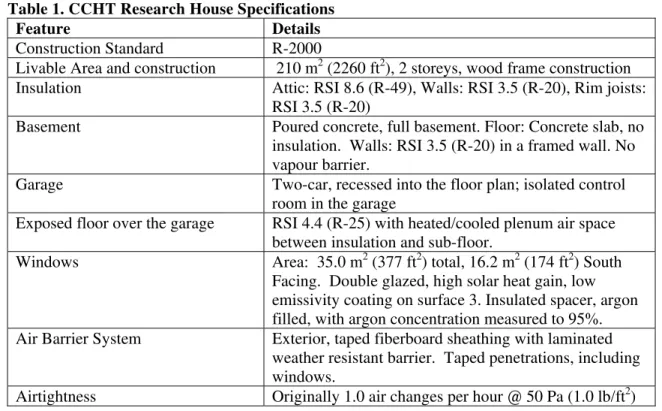
The CCHT Twin Houses are located on the National Research Council Montreal Road Campus in Ottawa, Ontario, Canada. Features of the houses are listed in Table 1. In addition to these features, the houses include a simulated occupancy system that simulates the daily water draws and electrical loads of a family of four. The internal heat gains from the occupants are also simulated. Refer to Swinton et al. (2001) for details of the CCHT research houses.
Table 1. CCHT Research House Specifications
Feature Details
Construction Standard R-2000
Livable Area and construction 210 m2 (2260 ft2), 2 storeys, wood frame construction
Insulation Attic: RSI 8.6 (R-49), Walls: RSI 3.5 (R-20), Rim joists:
RSI 3.5 (R-20)
Basement Poured concrete, full basement. Floor: Concrete slab, no
insulation. Walls: RSI 3.5 (R-20) in a framed wall. No vapour barrier.
Garage Two-car, recessed into the floor plan; isolated control
room in the garage
Exposed floor over the garage RSI 4.4 (R-25) with heated/cooled plenum air space
between insulation and sub-floor.
Windows Area: 35.0 m2 (377 ft2) total, 16.2 m2 (174 ft2) South
Facing. Double glazed, high solar heat gain, low emissivity coating on surface 3. Insulated spacer, argon filled, with argon concentration measured to 95%.
Air Barrier System Exterior, taped fiberboard sheathing with laminated
weather resistant barrier. Taped penetrations, including windows.
APPROACH
The study took place in the winter of 2005-2006. A side-by-side testing approach was used, as outlined by Swinton et al. (2001) and Manning et al. (2007).
The experiment consisted first of operating the houses with their original glazing system to generate benchmark performance characteristics. Then, all of the main floor and second floor windows and patio doors were replaced in the Test House with an alternate glazing system described above under ‘Descption of the Glazing Technology’.
The 31 replacement units were specified and manufactured to fit the original window
descriptions. In total, 7 fixed windows, 22 casement windows, and 2 patio doors were replaced. In the case of the casement windows, both the sash and the glazing unit were replaced, while the frame remained in place. The original window supplier was used to ensure consistency of the sashes. The fixed windows were originally sealed with a wet seal, this was cut out and removed during the replacement process. The replacement units were sealed with glazing tape for ease of replacement. Both the fixed and the sliding portions of the patio door were replaced. Two small basement windows consisting of conventional technology (clear double-glazed, no low emissivity coatings) were left unaltered in all experiments. The original insulating spacer (corrugated metal strip spacer) was no longer available on the market, so a comparable product was specified. The Reference House was left unmodified, for comparison purposes. Both houses were monitored intensively for 4 weeks, and the performance of the alternate glazing system was compared to that of the benchmark glazing system.
During the winter experiments, the houses were configured and operated according the conditions recorded in Table 2.
Table 2 - Operating Conditions for the Standard CCHT Benchmark System Reference House & Test House
1 Furnace High efficiency condensing; continuous fan circulation
2 Thermostat Setpoint 22°C (72 °F), located centrally on main floor.
3 Heat Recovery
Ventilator (HRV) On low speed continuous, 31 L/s (65 cfm)
4 Interior Doors All doors open
5 Window Shades
All interior blinds down with slats in the horizontal position, except the south-facing bedroom window containing the pyranometer where Venetians were drawn up.
6 Operable Windows Kept closed, resulting in a house airtightness of ~1.6 ach*
7 Simulated
Occupancy Standard Schedule
8 Humidifier Off
9 Hot Water Heater Standard Gas
* Some CCHT experiments feature a configuration with the windows cracked open to increase the air leakage characteristic. The houses were run in the ‘Tight’ house configuration for this experiment, but which is now looser than their original airtightness.
Table 3 Record of Experimental Days
Configuration Date Range Number of Days
Range of Outdoor Temperature (°C)
Benchmark Before 29-Oct-05 to 15-Jan-06 13 -18.9 to 15.9
Experiment 19-Jan-06 to 15-Feb-06 28 -18.6 to 7.5
Benchmark After 19-Feb-06 to 12-Mar-06 10 -17.5 to 9.9
The range of winter conditions during the experimental period is shown in Figure 1 for prevailing outdoor temperatures, and Figure 2 for prevailing solar intensity on the south face of the houses.
Outdoor Temperature - Winter Experiment
-20 -15 -10 -5 0 5 10
19-Jan-06 27-Jan-06 4-Feb-06 12-Feb-06 Date O utdoor T em per a tur e ( °C )
South-face Solar Radiation - Winter Experiment
0 200 400 600 800 1000 1200
19-Jan-06 27-Jan-06 4-Feb-06 12-Feb-06
Date and Time
Sol a r R adi a tio n , W/m2
Figure 1. Prevailing Outdoor Temperatures Figure 2. Prevailing Solar Intensity on the South face of the CCHT Houses
DATA COLLECTION
Well over 300 hourly readings were recorded in each house throughout the benchmark and experimental winter periods of this project. The majority of this data is used to keep track of the operation of the houses, as they are not lived in. Detailed review ensured that the houses were being run identically. Any malfunction of a device resulted in disqualifying the results of that experimental day from the dataset used for analysis.
Detailed consumption data consisted of: furnace fan electrical consumption and furnace gas consumption. These were collected on a 5-minute basis by means of pulse-meters at a resolution
of 0.6 Wh/pulse (2.0 Btu/pulse) and 1.4 L/pulse (0.05 ft3/pulse). The total daily consumption
values were calculated based on these data.
Temperature data were collected throughout the house, including: thermostat temperature, room air temperature, window surface temperature, and drywall surface temperature. Window surface temperatures were collected on the interior surface of three separate windows at the centre of the fixed pane, at the bottom edge of the fixed pane, at the bottom edge of the operable window pane, and on the frame at the base of both the operable and fixed window. Thermostat temperature and window surface temperatures were recorded on a 5-minute basis. All other temperature data were collected every five minutes, averaged and recorded hourly.
A precision spectral pyranometer was mounted vertically on the south face of the Reference House measured total incident solar radiation during summer testing. A second pyranometer was mounted vertically behind the glazing unit of a second storey south-facing window in the Test House.
ANALYSIS
Furnace gas consumption, fan motor electrical consumption were compiled on a daily basis from data recorded every 5-minutes. By plotting the daily consumption of the Test House against that of the Reference House, trends were developed for both house configurations (Benchmark and Experimental) across a range of environmental conditions. Using the Reference House
consumption as a reference, the benchmark line correlation was used to calculate the amount of energy consumed by the Test House for any given day of the experiments. Daily savings or increases were determined by comparing the Test House consumption with new glazing to the Test House consumption under benchmark conditions. The advantage of using the Reference House as a reference, instead of depending on correlations with outdoor temperature, is that both houses are exposed to identical outdoor conditions. This allows the effects of the glazing design strategy to be isolated from wind, solar and temperature effects.
RESULTS BENCHMARKS
Benchmarking occurred before and following the winter test period. In total, 13 days of data were collected in benchmarking configuration prior to the window experiment, and 10 days of data were collected following the experiment. The days spanned the winter season between 29-Oct-05 and 12-Mar-06. Temperature conditions on benchmarking days ranged from -18.9°C to
15.9°C. Total daily vertical solar radiation on the south face ranged from 871 kJ/(m2.day) to
21905 kJ/(m2.day).
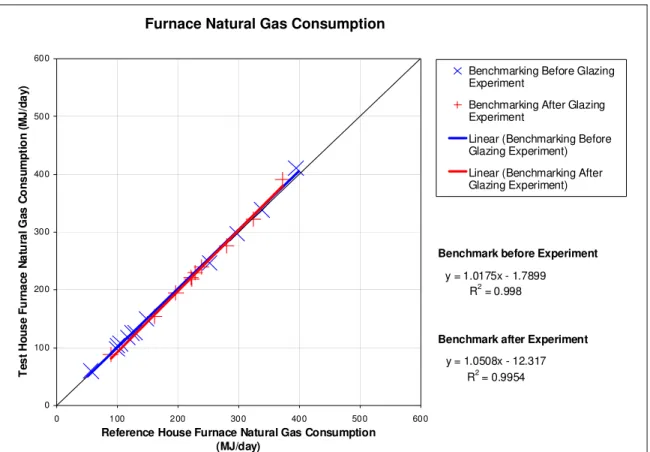
Furnace gas consumption data from benchmarking before and after the experiment is plotted in Figure 3. Total daily Reference House furnace gas consumption is plotted on the x-axis, while total daily Test House furnace gas consumption is plotted on the y-axis. Each point represents a single day of data. By plotting multiple days, a trend can be developed to indicate the relative performance of the two houses. If the two houses were in fact perfectly identical, the benchmark would have a slope of 1 and intercept at 0. There are always small differences between the houses, as it is impossible for them to be completely identical. This is seen by the slightly higher slope, and intercept that is less than 1 in both trends.
The “before” and “after” trends in this graph are very similar. Along the length of the trend lines, they stay within 7 MJ of one another. Experimental scatter could easily account for these small differences. The similarity in the trend lines indicates that the performance of the houses remained unchanged in terms of energy consumption by the window experiment. Additionally, this similarity allows all benchmarking data to be considered as a single trend. For the remainder of the winter analysis section, winter benchmarking data will appear as a set of data, and will not be split into two separate trends.
Furnace Natural Gas Consumption y = 1.0175x - 1.7899 R2 = 0.998 y = 1.0508x - 12.317 R2 = 0.9954 0 100 200 300 400 500 600 0 100 200 300 400 500 600
Reference House Furnace Natural Gas Consumption (MJ/day) T e s t H ous e Fu rna c e N a tu ra l G a s C o ns um pt io n ( M J /da y )
Benchmarking Before Glazing Experiment
Benchmarking After Glazing Experiment
Linear (Benchmarking Before Glazing Experiment) Linear (Benchmarking After Glazing Experiment)
Benchmark before Experiment
Benchmark after Experiment
Figure 3. Winter Benchmarking Furnace Gas Consumption Curve before and After the Experiment
EFFECT ON GAS CONSUMPTION
During the experiment, furnace natural gas consumption was monitored in both houses. The resulting daily consumption data is plotted along side the benchmarking data in Figure 4. On average, the results show an increase in gas consumption due to the installation of the new windows. The average increase over the duration of the winter glazing experiment was 23.4 MJ/day, with a maximum increase of 59.7 MJ/day.
Over the entire experimental period in the winter, the simple addition of increased consumption associated with the low SHGC low emissivity technology was 8.7% for gas and 1.3% for electricity.
The large amount of scatter in the glazing experiment data can be related direction to solar radiation. On days with high amount of solar radiation, the differences between the windows have greater effect, and the experiment point is further away from the benchmark trend line. On days with low amounts of solar radiation, points are much closer to the benchmark trend, and on a few occasions are below the benchmark line. The relationship between solar radiation and consumption data is further discussed in next section.
Natural Gas Consumption for Space Heating y = 1.0217x - 3.8078 R2 = 0.9971 0 100 200 300 400 500 600 0 100 200 300 400 500 600
Reference House Furnace Natural Gas Consumption (MJ/day) Tes t H o us e Fu rna ce Na tur al G a s C on s um pt io n (M J/d a y) High SHGC Low-e on surf 3 - Benchmark Low SHGC Low-e on surf 2 Linear (High SHGC Lowe on surf 3 -Benchmark) Benchmark 2005-2006
Figure 4. Window Glazing Project Winter Furnace Gas Consumption ANALYSIS OF SOLAR TRANSMISSION
The most notable difference between the windows is their ability to transmit solar radiation. This difference is demonstrated in Figure 5. Two days of solar data are plotted in this graph: January
15th – a Benchmark day, and January 26th – an Experiment day. On January 15th, a pyranometer
was mounted behind a south-facing HSG window. On January 26th, the pyranometer was situated
at the same south-facing location, behind a low solar heat gain low emissivity (LSG) window. Only 40% of the total solar radiation incident on a wall with the same orientation as the window was detected behind the LSG window. Whereas, 60% of the solar radiation was transmitted by the high solar heat gain low emissivity (HSG) window. (These numbers do not include the energy absorbed, convected and radiated to the room – factors included in the SHGC. Measured window temperatures discussed below give us an indication of those effects).
A relationship can be drawn between total daily solar radiation incident on the south facing wall of the House, and total transmitted solar radiation (as captured by the pyranometer mounted behind the window). This relationship is presented in Figure 6 for both the HSG and LSG windows. The slope of these lines gives a quick approximation of the percentage of solar
radiation being detected in the room. For the HSG windows, the slope is approximately 0.59, and the slope of the LSG curve is approximately 0.40. An alternative representation of these
relationships is plotted in Figure 7.
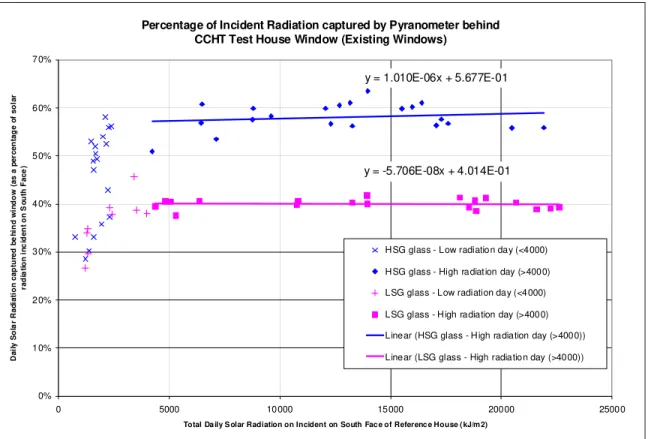
The percentage of solar radiation transmitted by the window is plotted against the total solar radiation incident on the south face of the house. Again, the curves indicate that on average 40% of the incident solar radiation is reaching the room side of the LSG window, while 57% on
average was detected behind the HSG window. On days with low solar gains, where less than
4000 kJ/m2/day were incident on the south face of the house, the relationship between percentage
of transmitted solar energy and total solar energy breaks down. On these days, the percentage of solar energy transmitted by the windows dropped for both the LSG and HSG windows. This result demonstrates that on days with low solar gains, generally very cloudy days, the spectrally selective properties of the low emissivity coating associated with the two different technologies are of less importance.
CCHT Research Houses - Transmitted Solar Energy
0 200 400 600 800 1000 1200 0:00 2:00 4:00 6:0 0 8:00 10:0 0 12:00 14:0 0 16:0 0 18:0 0 20:0 0 22: 00 0:0 0 2:00 4:0 0 6:00 8:00 10:0 0 12: 00 14:0 0 16: 00 18:0 0 20: 00 22:0 0 Time S o la r E n e rg y ( W /m 2)
Reference House - Pyranometer mounted vertically on brick wall
Test House - Pyranometer mounted vertically behind window - HIGH SOLAR GAIN ON S3 Test House - Pyranometer mounted vertically behind window - LOW SOLAR GAIN ON S2
15-Jan-06 26-Jan-06 11604 kJ/m2/day, ~60% 8327 kJ/m2/day, ~40% 19239 kJ/m2/day 20643 kJ/m2/day 581 W/m2 407 W/m2
Figure 5. Transmitted Solar Energy during Winter Glazing Experiment
CAUSAL RELATIONSHIPS BETWEEN SOLAR TRANSMISSION AND ENERGY CONSUMPTION
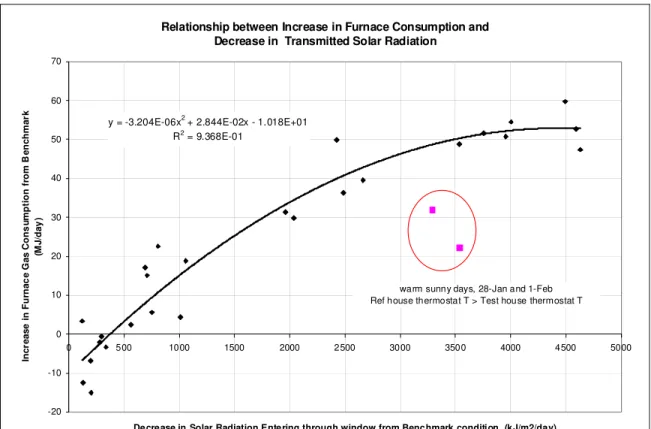
With the LSG windows transmitting less solar energy, the heating system has to compensate for the loss. The change in gas consumption from the benchmark configuration was first noted to be a function of the daily solar radiation incident on the south-facing wall of the house – the greater the south-face solar radiation over the day, the greater the space heating requirement in the LSG house (graph not shown). The daily increase in furnace gas consumption that results from the LSG technology can be plotted against the measured daily reduction in solar transmission measured through the bedroom’s south window; i.e., the ‘Deltas’ in Figure 4 are plotted against the corresponding ‘Deltas’ in Figure 6. The result is shown in Figure 8. This graph shows a good correlation, suggesting a strong causal relationship between reduced solar transmission and increased heating requirement, confirming the hypothesis. On the sunniest days, the house with the LSG windows had to compensate for the lost solar gains by consuming over 50 MJ more in equivalent gas consumption.
Window Transmission of Solar Radiation y = 0.5936x - 181.81 R2 = 0.9952 y = 0.4012x - 23.079 R2 = 0.9979 0 2000 4000 6000 8000 10000 12000 14000 0 5000 10000 15000 20000 25000
Total Daily Solar Radiation on Incident on South Face of Reference House (kJ/m2)
D a il y S ol a r R a di a ti on c a p tu re d be hi nd w ind ow ( k J /m2 )
High Solar Gain on Surface 3 Low Solar Gain on Surface 2 Linear (High Solar Gain on Surface 3) Linear (Low Solar Gain on Surface 2)
Figure 6. Daily Solar Radiation Measured in the room as a function of Daily Solar Radiation Measured at the South Face of the Houses
Percentage of Incident Radiation captured by Pyranometer behind CCHT Test House Window (Existing Windows)
y = 1.010E-06x + 5.677E-01 y = -5.706E-08x + 4.014E-01 0% 10% 20% 30% 40% 50% 60% 70% 0 5000 10000 15000 20000 25000
Total Da ily S olar Radiation on Incident on South Fac e of Referenc e House ( kJ/m 2)
D a il y S o la r R a d iati o n ca p tu red b e h in d w in d o w (a s a p e rc en ta g e o f so la r ra di a ti on in c ide nt on S o ut h F a c e )
H SG glass - Low radiation day (<4000) H SG glass - High radiation day (>4000) LSG glass - Low radiation day (<4000) LSG glass - H igh radiation day (>4000) Linear (HSG glass - H igh radiation day (>4000)) Linear (LSG glass - High radiation day (>4000))
Figure 7. Daily Solar Radiation Measured as a Percentage of Daily Solar Radiation Measured at the South Face of the Houses
The trend on this graph highlights other factors at play. The y-intercept is below zero, indicating that there are some thermal differences between the two types of windows, detectable when solar gains are less of a factor in the house energy balance. On days with very low solar gains, the LSG windows appear to be outperforming slightly the HSG windows. Finally, the two outliers in Figure 8 are believed to be a result of outdoor conditions. On these two days, hotter temperatures and high solar gains cause the Reference House temperatures to drift above the control of the thermostat. Because the Reference House operates at higher temperatures than the Test House on those days, this introduced a second factor (higher heat losses) over and above the higher solar gains, negating to some extent the general trend we were observing.
Relationship between Increase in Furnace Consumption and Decrease in Transmitted Solar Radiation
y = -3.204E-06x2 + 2.844E-02x - 1.018E+01 R2 = 9.368E-01 -20 -10 0 10 20 30 40 50 60 70 0 500 1000 1500 2000 2500 3000 3500 4000 4500 5000
Decrease in Solar Radiation Entering through window from Benchmark condition (kJ/m2/day)
In cr ease i n F u rn ac e G as C o n s u m p ti o n f ro m B en ch m ar k (M J /d a y )
warm sunny days, 28-Jan and 1-Feb Ref house thermostat T > Test house thermostat T
Figure 8. Relationship between Increased Gas Consumption for Space Heating and Reduction in Solar Transmission through the South Windows
WINDOW SURFACE TEMPERATURES
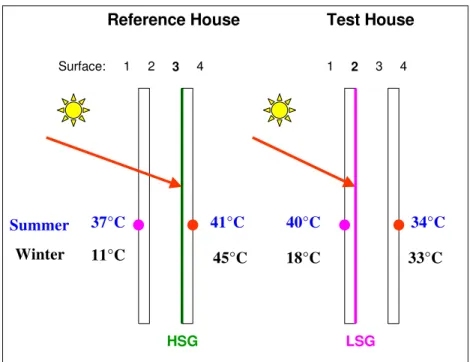
Surface window temperatures are also affected by the choice of low emissivity glass, and this too has an effect on space heating loads. The hotter window surfaces resulting from absorbed solar gains radiate heat inward, thereby contributing to the reduced gas consumption. Figure 9 shows a sketch of the two different glazing systems with window surfaces labeled and example peak glazing temperatures an clear days in winter and summer. These are direct side-by-side results as the windows are in the same location of the identical twin houses, measured simultaneously. This figure illustrates some of the key differences in how the glazing surface temperatures are affected by the glazing strategy.
37°C 40°C41°C 34°C
Reference House Test House
HSG LSG 11°C 45°C 18°C 33°C Winter Summer 1 2 3 4 1 2 3 4 Surface:
Figure 9. Illustration of the glazing systems, with example peak window temperatures on clear days in summer and winter
Figure 10 shows window surface temperature profiles for the clear day of January 26 2006. The glass temperatures are measured with surface-mounted thermocouples. The coated panes are ‘surface 3’ (interior pane) in the HSG House and ‘surface 2’ (exterior pane) in the LSG House. The resulting increased in temperature of the inner pane due to the HSG product can be seen. The phenomenon also contributes to increased heat gains and decreased space heating requirement.
Window Surface Temperatures - Bedroom 2 (South)
-15 -10 -5 0 5 10 15 20 25 30 35 40 45 50 0:00 2:00 4:00 6:00 8:00 10:00 12:00 14:00 16:00 18:00 20:00 22:00 0:00 Time T em p er a tu re ( °C )
Reference House Centre Ext. Test House Centre Ext. Reference House Centre Int. Test House Centre Int.
26-Jan-06
High Solar Gain S3
Low Solar Gain S2
decrease increase Interior Surface Exterior Surface
A record of daily maximum window temperatures for the entire experimental period is shown in Figure 11. It will be noted that the benchmark results (HSG technology) traces a near 45º line for both surfaces 1 and 4, and the deviation from those lines are shown for the LSG technology. The LSG is shown to increase surface 1 temperatures and decrease surface 4 temperatures according to the amount of solar gains available. On very cloudy days, the LSG lines tend to converge with the benchmark.
Livingroom - South Facing Window
y = 1.0257x + 0.057 R2 = 0.9986 y = 1.0699x - 1.5019 R2 = 0.9995 y = 0.5319x + 9.079 R2 = 0.9901 y = 1.377x - 0.455 R2 = 0.9395 -20 -10 0 10 20 30 40 50 -20 -10 0 10 20 30 40 50
Reference House Daily Maximum Temperature at Centre of Window (°C)
T e s t H o us e D a il y M a x im um Te m pe ra tur e a t C e nt re o f W indo w ( ° C )
Living room Benchmark - Exterior
Living room Benchmark - Interior
Living room Experiment - Exterior
Living room Experiment - Interior
Linear (Living room Benchmark -Exterior)
Linear (Living room Benchmark -Interior)
Linear (Living room Experiment -Interior)
Linear (Living room Experiment -Exterior) Decreased surface temperature on interior pane Increase surface temperature on exterior pane
Figure 11. Daily Centre of Window Maximum Surface Temperatures for both Window Types - All Experimental Days
DISCUSSION
As presented above, over the experimental period, the simple addition of savings associated with the high SHGC low emissivity coating technology resulted in consumption savings of 8.7% for gas and 1.3% for electricity. Nevetheless, this result is necessarily limited to the experimental period and is very much a function of the mix of solar gains experiences during that period. In many of the side-by-side experiments so far at the Canadian Centre for Housing Technology, comparison of one technology against another has for the most part yielded straight-line
correlations that could be used to deduce with some confidence the effect of the technology over the whole season. Such was the case for innovative heating technologies [Swinton, et al 2000]. Comparisons involving the control of solar gains such as the technologies investigated in this project introduce variability in the result that is a function of the available solar gains though the experimental period. The results show general increases in gas consumption for space heating associated with the LSG technology, but the effect originally appeared to be random, apparently bounded by a theoretical maximum saving that we postulated would be associated with clear day data only. This poses some challenges in generalizing the result over a heating season.
To sort out the apparently random effect, we introduced the concept of correlating the increased gas consumption for space heating to the measured reduction in solar transmission through a
south window. This correlation does contain some scatter, but nevertheless shows a systematic
trend with a reasonably good correlation coefficient (R2 = 0.9367). This approach holds some
promise that the data set could be used to assess the effect of the technology on space heating consumption over a whole heating season based on measured solar data throughout the season. Such an investigation is left for future research, along with the use of existing models to simulate the seasonal effects, once benchmarked using the dataset generated in this project.
Through the project and analysis, it became apparent that there were other small differences in the window technologies, (slightly different insulating spacers, different average percentage argon fill, and center of glass u-value), but these factors are presumed to be largely independent of solar effects and were thus quantified to some extent by the y-intercept of the correlation in Figure 8: approximately -10 MJ/day on average for the experimental period. The implication is that the windows with the LSG technology, and with their own slightly different insulated spacer, argon concentration and low emissivity characteristics amounted to a slightly better performance at night-time (no solar), as postulated in the hypothesis. This was verified to be the case, though almost negligible, through separate investigation of nighttime results. Nevertheless, this was taken into account in the overall results reported above, which includes both daytime and nighttime effects.
The detailed temperature measurements of window surfaces also highlighted another important effect of the spectrally selective low emissivity technologies. The implications of these effects will be studied in more detail as well, and may be valuable in contributing to benchmarking of the more detailed thermal performance models for windows.
CONCLUSION
During the winter heating season of 2006, the Canadian Centre for Housing Technology (CCHT) ran an experiment in its twin houses to determine the whole-house energy performance associated with two high performance glazing systems that featured different spectrally selective low
emissivity coatings. The experiment consisted first of operating the houses with their original glazing system, a high solar heat gain coefficient low emissivity coating on surface 3 of double glazed argon filled units, and this was used to generate benchmark performance characteristics of the two houses in identical configuration. Then, all of the main floor and second floor windows and patio doors were replaced in the Test House with an alternate glazing system under
investigation. The alternate system featured a low SHGC low emissivity coating on surface 2 of double glazed, argon filled units. The Reference House was left unmodified, for comparison purposes. Both houses were monitored intensively for 4 weeks, and the performance of the alternate glazing system was compared to that of the benchmark glazing system.
Comparisons included: overall gas consumption of the houses, overall energy savings or increases of one glazing system over the other, correlations of those savings to daily solar insolation and solar transmission, and finally, changes in surface temperatures. The experiment yielded consumption savings associated with the high SHGC low emissivity technology: 8.7% for gas and 1.3% for electricity, as a result of the use of the high SHGC low emissivity technology. These net savings through the experimental period correlated strongly to increased solar gains - both direct gains and through inward emission and convection of absorbed solar heat into the inner layer of glass, manifested as higher inner surface temperatures.
This information will be used to benchmark and validate computer models and also combined with summer experiments to develop estimates of net annual benefits of one glazing system over another.
REFERENCES
Manning, M.M., M.C. Swinton, F. Szadkowski, J. Gusdorf and K. Ruest, 2007. “The Effects of Thermostat Set-back and Set-up on Seasonal Energy Consumption, Surface Temperatures and Recovery Times at the CCHT Twin House Facility”, ASHRAE-Transactions, 2007 ASHRAE Winter Meeting (Dallas, Texas, January 28, 2007) pp. 1-12, January 2007.
Swinton, M.C., Moussa, H., Marchand, R.G., "Commissioning twin houses for assessing the performance of energy conserving technologies," Performance of Exterior Envelopes of Whole Buildings VIII Integration of Building Envelopes (Clearwater, Florida, December 02, 2001), pp. 1-10, December 07, 2001 (NRCC-44995)
Swinton, M.C., H. Moussa, E. Entchev, F. Szadkowski, and R. Marchand. 2000. Assessment of the Energy Performance of Two Gas Combo Heating Systems at the Canadian Centre for Housing Technology, Contract Report B-6001. Ottawa: NRCC.