Publisher’s version / Version de l'éditeur:
Proceedings of the Fourth Workshop on Statistical Machine Translation, pp. 242-249, 2009
READ THESE TERMS AND CONDITIONS CAREFULLY BEFORE USING THIS WEBSITE. https://nrc-publications.canada.ca/eng/copyright
Vous avez des questions? Nous pouvons vous aider. Pour communiquer directement avec un auteur, consultez la
première page de la revue dans laquelle son article a été publié afin de trouver ses coordonnées. Si vous n’arrivez pas à les repérer, communiquez avec nous à [email protected].
Questions? Contact the NRC Publications Archive team at
[email protected]. If you wish to email the authors directly, please see the first page of the publication for their contact information.
NRC Publications Archive
Archives des publications du CNRC
This publication could be one of several versions: author’s original, accepted manuscript or the publisher’s version. / La version de cette publication peut être l’une des suivantes : la version prépublication de l’auteur, la version acceptée du manuscrit ou la version de l’éditeur.
Access and use of this website and the material on it are subject to the Terms and Conditions set forth at
Stabilizing Minimum Error Rate Training
Foster, George; Kuhn, Roland
https://publications-cnrc.canada.ca/fra/droits
L’accès à ce site Web et l’utilisation de son contenu sont assujettis aux conditions présentées dans le site LISEZ CES CONDITIONS ATTENTIVEMENT AVANT D’UTILISER CE SITE WEB.
NRC Publications Record / Notice d'Archives des publications de CNRC:
https://nrc-publications.canada.ca/eng/view/object/?id=fffb669c-87f6-4a2c-8bba-e292e723abe8 https://publications-cnrc.canada.ca/fra/voir/objet/?id=fffb669c-87f6-4a2c-8bba-e292e723abe8
Stabilizing Minimum Error Rate Training
George Foster and Roland Kuhn National Research Council Canada
Abstract
The most commonly used method for training feature weights in statistical ma-chine translation (SMT) systems is Och’s minimum error rate training (MERT) pro-cedure. A well-known problem with Och’s procedure is that it tends to be sensitive to small changes in the system, particu-larly when the number of features is large. In this paper, we quantify the stability of Och’s procedure by supplying different random seeds to a core component of the procedure (Powell’s algorithm). We show that for systems with many features, there is extensive variation in outcomes, both on the development data and on the test data. We analyze the causes of this variation and propose modifications to the MERT proce-dure that improve stability while helping performance on test data.
1 Introduction
Most recent approaches in SMT, eg (Koehn et al., 2003; Chiang, 2005), use a log-linear model to combine probabilistic features. Minimum Error-Rate Training (MERT) aims to find the set of log-linear weights that yields the best translation per-formance on a development corpus according to some metric such as BLEU. This is an essen-tial step in SMT training that can significantly improve performance on a test corpus compared to setting weights by hand. MERT is a difficult problem, however, because calculating BLEU as a function of log-linear weights requires decoding, which is an expensive operation. Moreover, be-cause this function is not differentiable, efficient gradient-based optimization algorithms cannot be used.
Och’s procedure is the most widely-used ver-sion of MERT for SMT (Och, 2003). To reduce
computational cost, it relies on the key technique of optimizing weights over n-best lists of transla-tion hypotheses rather than over all possible hy-potheses. This allows the most probable hypoth-esis under a given set of weights—and the corre-sponding BLEU score—to be found by enumer-ating n-best entries rather than decoding. Some variant on Powell’s algorithm (Press et al., 2002) is typically used to maximize BLEU in this set-ting. The n-best lists are constructed by alternat-ing decodalternat-ing and BLEU maximization operations: decoding adds new hypotheses to the current lists, then BLEU is maximized over the lists to find new best weights for the subsequent decoding step, etc. This process continues until no new hypotheses are found.
Och’s procedure works well in practice, usually converging after 10–20 calls to the decoder, far fewer than would be required to maximize BLEU directly with a general-purpose optimization algo-rithm. However, it tends to be sensitive to small changes in the system, particularly for large fea-ture sets. This is a well-known problem with Och’s procedure (Och et al., 2004). It makes it difficult to assess the contribution of features, be-cause the measured gain in performance due to a new feature can depend heavily on the setting of some apparently unrelated parameter such as the size of n-best list used. Features with the poten-tial for statistically significant gains may be re-jected because Och’s procedure failed to find good weights for them.
In this paper we attempt to quantify the stabil-ity of Och’s procedure under different conditions by measuring the variation in test-set scores across different random seeds used with Powell’s algo-rithm. We show that there is extensive variation for large feature sets, and that it is due to two main factors: the occasional failure of Och’s procedure to find a good maximum on the development set, and the failure of some maxima to generalize to
the test set. We analyze the causes of each of these problems, and propose solutions for improving the stability of the overall procedure.
2 Previous Work
One possible approach to estimating log-linear weights on features is to dispense with the n-best lists employed by Och’s procedure and, instead, to optimize weights by directly accessing the de-coder. The disadvantage of this approach is that far more iterations of decoding of the full devel-opment set are required. In (Zens and Ney, 2004) the downhill simplex method is used to estimate the weights; around 200 iterations are required for convergence to occur. However, each iteration is unusually fast, because only monotone decoding is permitted (i.e., the order of phrases in the tar-get language mirrors that in the source language). Similarly, Cettolo and Federico (2004) apply the simplex method to optimize weights directly using the decoder. In their experiments on NIST 2003 Chinese-English data, they found about 100 iter-ations of decoding were required. Although they obtained consistent and stable performance gains for MT, these were inferior to the gains yielded by Och’s procedure in (Och, 2003). Taking Och’s MERT procedure as a baseline, (Zens et al., 2007) experiment with different training criteria for SMT and obtain the best results for a criterion they call “expected BLEU score”.
Moore and Quirk (2008) share the goal under-lying our own research: improving, rather than replacing, Och’s MERT procedure. They focus on the step in the procedure where the set of fea-ture weights optimizing BLEU (or some other MT metric) for an n-best list is estimated. Typically, several different starting points are tried for this set of weights; often, one of the starting points is the best set of weights found for the previous set of n-best hypotheses. The other starting points are often chosen randomly. In this paper, Moore and Quirk look at the best way of generating the ran-dom starting points; they find that starting points generated by a random walk from previous max-ima are superior to those generated from a uni-form distribution. The criterion used throughout the paper to judge the performance of MERT is the BLEU score on the development test set (rather than, for instance, the variance of that score, or the BLEU score on held-out test data). Another contribution of the paper is ingenious methods for
pruning the set of n-best hypotheses at each itera-tion.
Cer et al (2008) also aim at improving Och’s MERT. They focus on the search for the best set of weights for an n-best list that follows choice of a starting point. They propose a modified ver-sion of Powell’s in which “diagonal” directions are chosen at random. They also modify the ob-jective function used by Powell’s to reflect the width of the optima found. They are able to show that their modified version of MERT outperforms both a version using Powell’s, and a more heuris-tic search algorithm devised by Philipp Koehn that they call Koehn Coordinate Descent, as mea-sured on the development set and two test data sets. (Duh and Kirchhoff, 2008) ingeniously uses MERT as a weak learner in a boosting algorithm that is applied to the n-best reranking task, with good results (a gain of about 0.8 BLEU on the test set).
Recently, some interesting work has been done on what might be considered a generalization of Och’s procedure (Macherey et al., 2008). In this generalization, candidate hypotheses in each iter-ation of the procedure are represented as lattices, rather than as n-best lists. This makes it possi-ble for a far greater proportion of the search space to be represented: a graph density of 40 arcs per phrase was used, which corresponds to an n-best size of more than two octillion(2 ∗ 1027
) entries. Experimental results for three NIST 2008 tasks were very encouraging: though BLEU scores for the lattice variant of Och’s procedure did not typ-ically exceed those for the n-best variant on de-velopment data, on test data the lattice variant out-performed the n-best approach by between 0.6 and 2.5 BLEU points. The convergence behaviour of the lattice variant was also much smoother than that of the n-best variant. It would be interesting to apply some of the insights of the current paper to the lattice variant of Och’s procedure.
3 Och’s MERT Procedure
Och’s procedure works as follows. First the de-coder is run using an initial set of weights to gen-eraten best translations (usually around 100) for each source sentence. These are added to exist-ing n-best lists (initially empty). Next, Powell’s algorithm is used to find the weights that maxi-mize BLEU score when used to choose the best hypotheses from the n-best lists. These weights
are plugged back into the decoder, and the pro-cess repeats, nominally until the n-best lists stop growing, but often in practice until some criterion of convergence such as minimum weight change is attained. The weights that give the best BLEU score when used with the decoder are output.
The point of this procedure is to bypass di-rect search for the weights that result in maxi-mum BLEU score, which would involve decoding using many different sets of weights in order to find which ones gave the best translations. Och’s procedure typically runs the decoder only 10–20 times, which is probably at least one order of mag-nitude fewer than a direct approach. The main trick is to build up n-best lists that are represen-tative of the search space, in the sense that a given set of weights will give approximately the same BLEU score when used to choose the best hy-potheses from the n-best lists as it would when de-coding. By iterating, the algorithm avoids weights that give good scores on the n-best lists but bad ones with the decoder, since the bad hypotheses that are scored highly by such weights will get added to the n-best lists, thereby preventing the choice of these weights in future iterations. Unfor-tunately, there is no corresponding guarantee that weights which give good scores with the decoder but bad ones on the nbest lists will get chosen.
Finding the set of weights that maximizes BLEU score over n-best lists is a relatively easy problem because candidate weight sets can be evaluated in time proportional to n (simply cal-culate the score of each hypothesis according to the current weight set, then measure BLEU on the highest scoring hypothesis for each source sen-tence). Powell’s algorithm basically loops over each feature in turn, setting its weight to an op-timum value before moving on.1 Och’s linemax algorithm is used to perform this optimization effi-ciently and exactly. However this does not guaran-tee that Powell’s algorithm will find a global max-imum, and so Powell’s is typically run with many different randomly-chosen initial weights in order to try to find a good maximum.
4 Experimental Setup
The experiments described here were carried out with a standard phrase-based SMT system (Koehn 1It can also choose to optimize linear combinations of weights in order to avoid ridges that are not aligned with the original coordinates, which can be done just as easily.
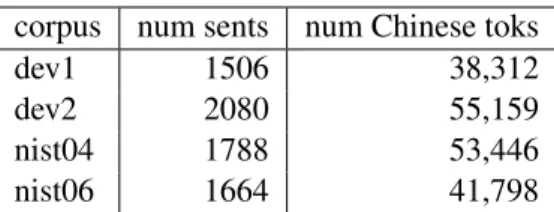
corpus num sents num Chinese toks
dev1 1506 38,312
dev2 2080 55,159
nist04 1788 53,446
nist06 1664 41,798
Table 1: Development and test corpora.
et al., 2003) employing a log-linear combination of feature functions. HMM and IBM2 models were used to perform separate word alignments, which were symmetrized by the usual “diag-and” algorithm prior to phrase extraction. Decoding used beam search with the cube pruning algorithm (Huang and Chiang, 2007).
We used two separate log-linear models for MERT:
• large: 16 phrase-table features, 2 4-gram lan-guage model features, 1 distortion feature, and 1 word-count feature (20 features in to-tal).
• small: 2 phrase-table features, 1 4-gram lan-guage model feature, 1 distortion feature, and 1 word-count feature (5 features in total). The phrase-table features for the large model were derived as follows. Globally-trained HMM and IBM2 models were each used to extract phrases from UN and non-UN portions of the training cor-pora (see below). This produced four separate phrase tables, each of which was used to generate both relative-frequency and “lexical” conditional phrase-pair probabilities in both directions (target given source and vice versa). The two language model features in the large log-linear model were trained on the UN and non-UN corpora. Phrase-table features for the small model were derived by taking the union of the four individual tables, sum-ming joint counts, then calculating relative fre-quencies.
All experiments were run using the Chi-nese/English data made available for NIST’s 2008 MT evaluation. This included approximately 5M sentence pairs of data from the UN corpus, and approximatel 4M sentence pairs of other mate-rial. The English Gigaword corpus was not used for language model training. Two separate devel-opment corpora were derived from a mix of the NIST 2005 evaluation set and some webtext drawn from the training material (disjoint from the train-ing set used). The evaluation sets for NIST 2004
cfg nist04 nist06 avg ∆ S avg ∆ S S1 31.17 1.09 0.28 26.95 0.90 0.27 S2 31.44 0.22 0.07 27.38 0.71 0.19 L1 33.03 1.09 0.37 29.22 0.97 0.34 L2 33.37 1.49 0.49 29.61 2.14 0.66 Table 2: Test-set BLEU score variation with 10 different random seeds, for small (S) and large (L) models on dev sets 1 and 2. The avg column gives the average BLEU score over the 10 runs;∆ gives the difference between the maximum and mini-mum scores, andS is the standard deviation.
and NIST 2005 corpora were used for testing. Ta-ble 1 summarizes the sizes of the devtest corpora, all of which have four reference translations.
5 Measuring the Stability of Och’s Algorithm
To gauge the response of Och’s algorithm to small changes in system configuration, we varied the seed value for initializing the random number gen-erator used to produce random starting points for Powell’s algorithm. For each of 10 different seed values, Och’s algorithm was run for a maximum of 30 iterations2 using 100-best lists. Table 2 shows the results for the two different log-linear models described in the previous section.
The two development sets exhibit a similar pat-tern: the small models appear to be somewhat more stable, but all models show considerable variation in test-set BLEU scores. For the large models, the average difference between best and worst BLEU scores is almost 1.5% absolute, with an average standard deviation of almost 0.5%. Differences of as little as 0.35% are significant at a 95% confidence level according to paired boot-strap resampling tests on this data, so these varia-tions are much too large to be ignored.
The variation in table 2 might result from Och’s algorithm failing to maximize development-set BLEU properly on certain runs. Alternatively, it could be finding different maxima that vary in the extent to which they generalize to the test sets. Both of these factors appear to play a role. The ranges of BLEU scores on the two development corpora with the large models are 0.86 and 1.3 re-spectively; the corresponding standard deviations 2Sufficient for effective convergence in all cases we tested.
dev nist04 nist06 inter
ρ r ρ r ρ
dev1 0.18 0.42 -0.27 0.07 0.73 dev2 0.55 0.60 0.73 0.85 0.94 Table 3: Pearson (ρ) and Spearman rank (r) cor-relation between dev-set and test-set BLEU scores for the large log-linear model. The final column shows nist04/nist06 correlation.
are 0.27 and 0.38. Different runs clearly have sig-nificantly different degrees of success in maximiz-ing BLEU.
To test whether the variation in development-set BLEU scores accounts completely for the vari-ation in test-set scores, we measured the correla-tion between them. The results in table 3 show that this varies considerably across the two de-velopment and test corpora. Although the rank correlation is always positive and is in some cases quite high, there are many examples where higher development-set scores lead to lower test-set scores. Interestingly, the correlation between the two test-set scores (shown in the last column of the table) is much higher than that between the de-velopment and test sets. Since the test sets are not particularly similar to each other, this suggests that some sets of log-linear weights are in fact overfit-ting the development corpus.
5.1 Bootstrapping with Random Seeds The results above indicate that the stability prob-lems with Och’s MERT can be quite severe, es-pecially when tuning weights for a fairly large number of features. However, they also consti-tute a baseline solution to these problems: run MERT some number of times with different ran-dom seeds, then choose the run that achieves the highest BLEU score on a test set. Since test-set scores are highly correlated, these weights are likely to generalize well to new data. Applying this procedure using the nist04 corpus to choose weights yields a BLEU increase of 0.69 on nist06 compared to the average value over the 10 runs in table 2; operating in the reverse direction gives an increase of 0.37 on nist04.3
3
These increases are averages over the increases on each development set. This comparison is not strictly fair to the baseline single-MERT procedure, since it relies on a test set for model selection (using the development set would have yielded gains of 0.25 for nist06 and 0.27 for nist04). How-ever, it is fairly typical to select models (involving different feature sets, etc) using a test set, for later evaluation on a
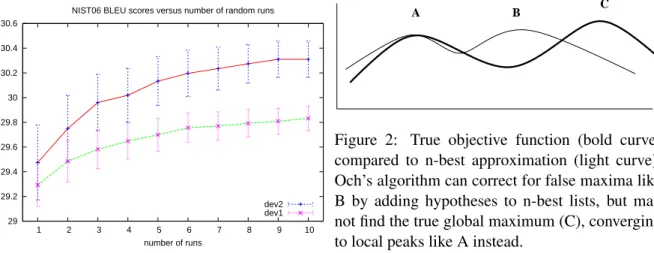
29 29.2 29.4 29.6 29.8 30 30.2 30.4 30.6 1 2 3 4 5 6 7 8 9 10 number of runs
NIST06 BLEU scores versus number of random runs
dev2 dev1
Figure 1: Results on the nist06 test corpus, using nist04 to choose best weights from varying num-bers of MERT runs, averaged over 1000 random draws. The error bars indicate the magnitude of the standard deviation.
An obvious drawback to this technique is that it requires the expensive MERT procedure to be run many times. To measure the potential gain from using fewer runs, and to estimate the stability of the procedure, we used a bootstrap simulation. For each development set and eachn from 1 to 10, we randomly drew 1000 sets of n runs from the data used for table 2, then recorded the behaviour of the nist06 scores that corresponded to the best nist04 score. The results are plotted in figure 1. There is no obvious optimal point on the curves, although 7 runs would be required to reduce the standard deviation on dev2 (the set with the higher variance) below 0.35. In the following sections we evaluate some alternatives that are less com-putationally expensive. The large model setting is assumed throughout.
6 Improving Maximization
In this section we address the problem of improv-ing the maximization procedure over the devel-opment corpus. In general, we expect that being able to consistently find higher maxima will lead to lower variance in test-set scores. Previous work, eg (Moore and Quirk, 2008; Cer et al., 2008), has focused on improving the performance of Powell’s algorithm. The degree to which this is effective de-pends on how good an approximation the current n-best lists are to the true search space. As
illus-second, blind, test set. A multi-MERT strategy could be nat-urally incorporated into such a regime, and seems unlikely to give rise to substantial bias.
A B C
Figure 2: True objective function (bold curve) compared to n-best approximation (light curve). Och’s algorithm can correct for false maxima like B by adding hypotheses to n-best lists, but may not find the true global maximum (C), converging to local peaks like A instead.
2 4 6 8 10 12 14 16 18 20 1 2 3 4 5 6 7 8 9 10 11 12 13 14 15 BLEU iter
dev2 BLEU scores versus Och iteration
best run worst run
Figure 3: Development-set BLEU scores after each Och iteration for two different training runs on the dev2 corpus.
trated in figure 2, it is possible for the true space to contain maxima that are absent from the approxi-mate (n-best) space. Figure 3 gives some evidence that this happens in practice. It shows the evolu-tion of decoder BLEU scores with iteraevolu-tion for the best and worst runs for dev2. Although the worst run explores a somewhat promising area at itera-tion 7, it converges soon afterwards in a region that gives lower true BLEU scores. This is not due to a failure of Powell’s algorithm, since the scores on the n-best lists rise monotonically in this range.
We explored various simple strategies for avoid-ing the kind of local-maximum behaviour exhib-ited in figure 3. These are orthogonal to improve-ments to Powell’s algorithm, which was used in its standard form. Our baseline implementation of Och’s algorithm calls Powell’s three times start-ing with each of the three best weight sets from the previous iteration, then a certain number of times with randomly-generated weights. The to-tal number of Powell’s calls is determined by an algorithm that tries to minimize the probability of
a new starting point producing a better maximum.4 The first strategy was simply to re-seed the ran-dom number generator (based on a given global seed value) for each iteration of Och’s algorithm. Our implementation had previously re-used the same “random” starting points for Powell’s across different Och iterations. This is arguably justifi-able on the grounds that the function to be opti-mized is different each time.
The second strategy was motivated by the ob-servation that after the first several iterations of Och’s algorithm, the starting point that leads to the best Powell’s result is nearly always one of the three previous best weight sets rather than a randomly-generated set. To encourage the algo-rithm to consider other alternatives, we used the three best results from all previous Och’s itera-tions. That is, on iterationn, Powell’s is started with the three best results from iterationn−1, then the three best fromn−2, and so forth. If more than 3(n − 1) points are required by the stopping al-gorithm described above, then they are generated randomly.
The final strategy is more explicitly aimed at forcing the algorithm to cover a broader por-tion of the search space. Rather than choosing the maximum-BLEU results from Powell’s algo-rithm for the subsequent decoding step, we choose weight vectors that yield high BLEU scores and are dissimilar from previous decoding weights. Formally:
ˆ
α = argmax
α∈P
w rbleu(α) + (1 − w) rdist(α), where P is the set of all weight vectors returned by Powell’s on the current iteration, rbleu(α) is α’s BLEU score divided by the highest score for any vector in P, and rdist(α) is α’s distance to previous weights divided by the largest distance for any vector in P. Distance to previous weights is measured by taking the minimum L2 distance fromα to any of the decoding weight vectors used during the previousm Och iterations.
Intuitively, the weight w that controls the im-portance of BLEU score relative to novelty should increase gradually as Och’s algorithm progresses in order to focus the search on the best maxi-4Whenever a new maximum is encountered, at least the current number of new starting points must be tried before stopping, with a minimum of 10 points in total. Experiments where the total number of starts was fixed at 30 did not pro-duce significantly different results.
mum found (roughly similar to simulated anneal-ing search). To accomplish this,w is defined as:
w = 1 − a/(iter + b),
whereb ≥ 0 and a ≤ b + 1 are parameters that controlw’s decay, and iter is the current Och iter-ation.
Each of the three strategies outlined above was run using 10 random seeds with both development corpora. The weight selection strategy was run with two different sets of values for the a and b parameters: a = 1, b = 1 and a = 5, b = 9. Each assigns equal weight to BLEU score and novelty on the first iteration, but under the first parameter-ization the weight on novelty decays more swiftly, to 0.03 by the final iteration compared to to 0.13.
The results are shown in table 4. The best strat-egy overall appears to be a combination of all three techniques outlined above. Under the a = 5, b = 9, m = 3 parametrization for the final (weight selection) strategy, this improves the development set scores by an average of approximately 0.4% BLEU compared to the baseline, while signifi-cantly reducing the variation across different runs. Performance of weight selection appears to be quite insensitive to its parameters: there is no sig-nificant difference between thea = 1, b = 1 and a = 5, b = 9 settings. It is possible that further tuning of these parameters would yield better re-sults, but this is an expensive procedure; we were also wary of overfitting. A good fallback is the first two strategies, which together achieve results that are almost equivalent to the final gains due to weight selection.
7 Generalization
As demonstrated in section 5, better performance on the development set does not necessarily lead to better performance on the test set: two weight vectors that give approximately the same dev-set BLEU score can give very different test-set scores. We investigated several vectors with this charac-teristic from the experiments described above, but were unable to find any intrinsic property that was a good predictor of test-set performance, perhaps due to the fact that the weights are scale invari-ant. We also tried averaging BLEU over boot-strapped samples of the development corpora, but this was also not convincingly correlated with test-set BLEU.
strategy dev avg ∆ S baseline 1 22.64 0.87 0.27 2 19.11 1.31 0.38 re-seed 1 22.87 0.65 0.21 2 19.37 0.60 0.17 +history 1 22.99 0.43 0.15 2 19.44 0.35 0.11 +sel 1,1,3 1 23.12 0.59 0.19 2 19.53 0.38 0.13 +sel 5,9,3 1 23.11 0.42 0.13 2 19.46 0.44 0.14 Table 4: Performance of various strategies for im-proving maximization on the dev corpora: base-line is the baseline used in section 5; re-seed is random generator re-seeding; history is accumu-lation of previous best weights as starting point; and sel a,b,m is the final, weight selection, strat-egy described in section 6, parameterized bya, b, andm. Strategies are applied cumulatively, as in-dicated by the+ signs.
An alternate approach was inspired by the reg-ularization method described in (Cer et al., 2008). In essence, this uses the average BLEU score from the points close to a given maximum as a surro-gate for the BLEU at the maximum, in order to penalize maxima that are “narrow” and therefore more likely to be spurious. While Cer et al use this technique while maximizing along a single dimen-sion within Powell’s algorithm, we apply it over all dimensions with the vectors output from Pow-ell’s. Each individual weight is perturbed accord-ing to a normal distribution (with variance 1e-03), then the resulting vector is used to calculate BLEU over the n-best lists. The average score over 10 such perturbed vectors is used to calculate rbleu in the weight-selection method from the previous section.
The results from regularized weight selection are compared to standard weight selection and to the baseline MERT algorithm in table 5. Regu-larization appears to have very little effect on the weight selection approach. This does not neces-sarily contradict the results of Cer et al, since it is applied in a very different setting. The standard weight selection technique (in combination with the re-seeding and history accumulation strate-gies) gives a systematic improvement in average test-set BLEU score over the baseline, although it does not substantially reduce variance.
strategy dev test avg ∆ S baseline 1 04 33.03 1.09 0.37 06 29.22 0.97 0.34 2 04 33.37 1.49 0.49 06 29.61 2.14 0.66 (+) sel 5,9,3 1 04 33.43 1.23 0.41 06 29.62 0.98 0.31 2 04 33.95 1.03 0.37 06 30.32 0.88 0.30 + reg 10 1 04 33.36 1.45 0.49 06 29.56 1.25 0.39 2 04 33.81 0.94 0.28 06 30.17 1.21 0.35 Table 5: Performance of various MERT tech-niques on the test corpora. (+) sel 5,9,3 is the same configuration as +sel 5,9,3 in table 4; + reg 10 uses regularized BLEU within this procedure.
8 Conclusion
In this paper, we have investigated the stability of Och’s MERT algorithm using different random seeds within Powell’s algorithm to simulate the effect of small changes to a system. We found that test-set BLEU scores can vary by 1 percent or more across 10 runs of Och’s algorithm with different random seeds. Using a bootstrap analy-sis, we demonstrate that an effective, though ex-pensive, way to stabilize MERT would be to run it many times (at least 7), then choose the weights that give best results on a held-out corpus. We propose less expensive simple strategies for avoid-ing local maxima that systematically improve test-set BLEU scores averaged over 10 MERT runs, as well as reducing their variance in some cases. An attempt to improve on these strategies by regular-izing BLEU was not effective.
In future work, we plan to integrate improved variants on Powell’s algorithm, which are orthog-onal to the investigations reported here.
9 Acknowlegement
This material is partly based upon work supported by the Defense Advanced Research Projects Agency (DARPA) under Contract No. HR0011-06-C-0023. Any opinions, findings and conclu-sions or recommendations expressed in this ma-terial are those of the authors and do not neces-sarily reflect the views of the Defense Advanced Research Projects Agency (DARPA).
References
Daniel Cer, Daniel Jurafsky, and Christopher D. Man-ning. 2008. Regularization and search for minimum error rate training. In Proceedings of the ACL Work-shop on Statistical Machine Translation, Columbus, June. WMT.
Mauro Cettolo and Marcello Federico. 2004. Min-imum error training of log-linear translation mod-els. In International Workshop on Spoken Language Translation, Kyoto, September.
David Chiang. 2005. A hierarchical phrase-based model for statistical machine translation. In Pro-ceedings of the 43th Annual Meeting of the Associ-ation for ComputAssoci-ational Linguistics (ACL), Ann Ar-bor, Michigan, July.
Kevin Duh and Katrin Kirchhoff. 2008. Beyond log-linear models: Boosted minimum error rate training for n-best re-ranking. In Proceedings of the 46th An-nual Meeting of the Association for Computational Linguistics (ACL), Columbus, Ohio, June.
Liang Huang and David Chiang. 2007. Forest rescor-ing: Faster decoding with integrated language mod-els. In Proceedings of the 45th Annual Meeting of the Association for Computational Linguistics (ACL), Prague, Czech Republic, June.
Philipp Koehn, Franz Josef Och, and Daniel Marcu. 2003. Statistical phrase-based translation. In Ed-uard Hovy, editor, Proceedings of the Human Lan-guage Technology Conference of the North Ameri-can Chapter of the Association for Computational Linguistics, pages 127–133, Edmonton, Alberta, Canada, May. NAACL.
Wolfgang Macherey, Franz Josef Och, Ignacio Thayer, and Jakob Uszkoreit. 2008. Lattice-based minimum error rate training for statistical machine transla-tion. In Proceedings of the 2008 Conference on Em-pirical Methods in Natural Language Processing (EMNLP), Honolulu.
Robert C. Moore and Chris Quirk. 2008. Random restarts in minimum error rate training for statisti-cal machine translation. In Proceedings of the Inter-national Conference on Computational Linguistics (COLING) 2008, Manchester, August.
Franz Josef Och, Daniel Gildea, and Sanjeev Khudan-pur et al. 2004. Final report of johns hopkins 2003 summer workshop on syntax for statistical ma-chine translation (revised version). Technical report, February 25.
Franz Josef Och. 2003. Minimum error rate training for statistical machine translation. In Proceedings of the 41th Annual Meeting of the Association for Computational Linguistics (ACL), Sapporo, July. William H. Press, Saul A. Teukolsky, William T.
Vet-terling, and Brian P. Flannery. 2002. Numerical Recipes in C++. Cambridge University Press, Cam-bridge, UK.
Richard Zens and Hermann Ney. 2004. Improve-ments in phrase-based statistical machine transla-tion. In Proceedings of Human Language Technol-ogy Conference / North American Chapter of the ACL, Boston, May.
Richard Zens, Sasa Hasan, and Hermann Ney. 2007. A systematic comparison of training criteria for sta-tistical machine translation. In Proceedings of the 2007 Conference on Empirical Methods in Natural Language Processing (EMNLP), Prague, Czech Re-public.