Publisher’s version / Version de l'éditeur:
Lighting Research and Technology, 38, September 3, pp. 191-223, 2006-09-01
READ THESE TERMS AND CONDITIONS CAREFULLY BEFORE USING THIS WEBSITE. https://nrc-publications.canada.ca/eng/copyright
Vous avez des questions? Nous pouvons vous aider. Pour communiquer directement avec un auteur, consultez la
première page de la revue dans laquelle son article a été publié afin de trouver ses coordonnées. Si vous n’arrivez pas à les repérer, communiquez avec nous à [email protected].
Questions? Contact the NRC Publications Archive team at
[email protected]. If you wish to email the authors directly, please see the first page of the publication for their contact information.
This publication could be one of several versions: author’s original, accepted manuscript or the publisher’s version. / La version de cette publication peut être l’une des suivantes : la version prépublication de l’auteur, la version acceptée du manuscrit ou la version de l’éditeur.
For the publisher’s version, please access the DOI link below./ Pour consulter la version de l’éditeur, utilisez le lien DOI ci-dessous.
https://doi.org/10.1191/1365782806lrt161oa
Access and use of this website and the material on it are subject to the Terms and Conditions set forth at
Lighting quality and office work: two field simulation experiments
Boyce, P. R.; Veitch, J. A.; Newsham, G. R.; Jones, C.; Heerwagen, J.; Myer, M.; Hunter, C. M.
https://publications-cnrc.canada.ca/fra/droits
L’accès à ce site Web et l’utilisation de son contenu sont assujettis aux conditions présentées dans le site LISEZ CES CONDITIONS ATTENTIVEMENT AVANT D’UTILISER CE SITE WEB.
NRC Publications Record / Notice d'Archives des publications de CNRC: https://nrc-publications.canada.ca/eng/view/object/?id=c05e1de2-52a7-487c-9d0e-7184914709d0 https://publications-cnrc.canada.ca/fra/voir/objet/?id=c05e1de2-52a7-487c-9d0e-7184914709d0
Light ing qua lit y a nd offic e w ork : t w o fie ld
sim ulat ion ex pe rim e nt s
N R C C - 4 8 1 5 5
B o y c e , P . R . ; V e i t c h , J . A . ; N e w s h a m , G . R . ;
J o n e s , C . C . ; H e e r w a g e n , J . ; M y e r , M . ; H u n t e r ,
C . M .
A version of this document is published in / Une version de ce
document se trouve dans : Lighting Research and Technology,
v. 38, no. 3, Sept. 2006, pp. 191-223
Lighting Quality and Office Work: Two Field Simulation Experiments
PR Boyce* Ph.D., JA Veitch† Ph.D., GR Newsham† Ph.D.,
CC Jones‡ B.F.A., J Heerwagen‡ Ph.D., M Myer* M.S., CM Hunter* M.S. *
Lighting Research Center, Rensselaer Polytechnic Institute, Troy, NY, USA. PR Boyce is now at: 60, Riverside Close; Bridge, near Canterbury; Kent CT4 5TN; UK
†
National Research Council of Canada, Institute for Research in Construction; Bldg M-24 1200 Montreal Road; Ottawa, Ontario KIA OR6; Canada. E-mail: [email protected]
‡
Battelle Memorial Institute / Pacific Northwest National Laboratory, Lexington, MA, USA.
Abstract
This paper describes two experiments concerning the effects of variations in lighting quality on office worker performance, health, and well-being. Experiment 1 had four experimental
conditions: a regular array of fully direct recessed parabolic luminaires; direct / indirect luminaires with no control; direct / indirect luminaires with a switchable desk lamp; and,
workstation-specific direct / indirect luminaires with control over the direct portion. Experiment 2 contrasted two conditions with no individual lighting control: a regular array of recessed prismatic lensed luminaires, and suspended direct / indirect luminaires. Participants considered the direct / indirect systems to be comfortable than the direct-only systems, with a further increase in comfort associated with individual control in Experiment 1. There were no simple main effects of lighting quality on the performance of any task, although the expected changes in performance associated with task visibility, practice, and fatigue were found. Interactions
between lighting quality and time suggested that having a degree of individual control of lighting tended to maintain motivation and vigilance over the day.
1. Introduction
Studies of the optimum lighting conditions for offices have resulted in a fair
understanding of the lighting conditions necessary to achieve high levels of visual performance and to avoid visual discomfort.1, 2 Lighting practitioners have adopted this knowledge, making it rare today to find offices lit in such a way that either visual performance is limited or extreme visual discomfort occurs.
However, all is not well in the world of office lighting. It is all too easy to find offices that are perceived to be gloomy and uninteresting, which has been the impetus behind the burgeoning research into lighting quality. 3-5 This approach emphasises lighting for the broad range of human needs. This paper describes two experiments done to determine to what extent different levels of lighting quality, as understood by lighting designers, affect the performance, health and well-being of office workers in mid-level North American offices. Additional details concerning the experiments are available in the complete project report. 6
The two experiments were designed to test a set of connected hypotheses about the effects of luminance distribution (created by varying the luminaires), non-task surface luminance (varied by changing the reflectance and colour of the cubicle surfaces) and control over lighting on various behavioural outcomes. This set of hypotheses proposes a set of causal mechanisms that are believed to underlie the predicted effects, in a form that Wyon has called a linked
mechanisms map.7 Figure 1 shows the linked mechanisms map developed for the field simulation experiments reported here. The rationale behind this linked mechanisms map is as follows: • Changing the luminous conditions in an office can immediately affect office workers in three
ways; by changing visual capability;1 by changing visual comfort;8 and, by changing the perception (appraisal) of the conditions.9
• These three aspects interact over time. For example, luminous conditions that cause visual discomfort or distraction, over time, will affect visual capability and the appraisal of the conditions. Similarly, luminous conditions that limit visual capability will, over time, affect visual comfort.
• Visual capabilities have a direct effect on task performance.1, 10, 11
They also affect the perception of competence to do the task and hence the motivation to do the task.
• Visual comfort has an indirect effect on mood and, through mood, an effect on feelings of health and well-being (although it could also be considered a form of well-being in itself). • Lighting conditions are appraised against expectations to determine whether the office
worker likes or dislikes the luminous conditions (preference) and this, in turn, leads to an effect on mood.12, 13
• Mood directly affects feelings of health and well-being. Mood and the perception of competence together affect the motivation to do the task and hence task performance.12, 14 • Finally, giving an office worker personal control directly affects their mood and feelings of
competence to do the task, even if the control is little used.15, 16
2. Experiment 1
2.1 Method
2.1.1 Setting
The setting was a 239 m2 air-conditioned office in downtown Albany, New York, which included space for nine modular partitioned cubicles, a conference room, a break area, an enclosed office for research staff, washrooms and a small kitchen. Rectangular windows fitted with beige perforated fabric blinds in the cubicle area, the conference room, and at the end of the hallway permitted a view out, but almost eliminated daylight as a light source in the cubicle area. Surface reflectances are shown in Table 1. Figure 2 shows a general view of the cubicle area.
The cubicles were square in plan of 2.28 m side. The heights of the panels forming the cubicles were either 1.67 m or 1.37 m. The L-shaped grey work surface in each cubicle was positioned 0.75 m above the floor (see Figure 4). A 0.43 m (diagonal screen dimension) CRT computer monitor was set at the angle of the L-shaped work surface, with the CPU on the floor below the work surface and the keyboard and mouse resting on a retractable shelf. The monitors were not identical, but all had the same performance characteristics. The tilt angle of each monitor was set to 12° from vertical each morning, and participants were asked not to move it. On one side of the monitor was a document holder. Completing the furnishing in each cubicle was a wheeled and padded chair of adjustable seat height, adjustable back position, and adjustable arm location.
2.1.2 Experimental Design
Experiment 1 used two research designs in parallel, which are shown in Table 2 along with the numbers of participants in each experimental condition. The between-groups research design was a 4 x 2 (Lighting Condition x Panel Reflectance) factorial experiment. Each participant whose data were analysed in this design participated once only; each was randomly assigned to one of the eight experimental conditions. This research design controlled for the effect of
participant expectancies formed as individuals gained knowledge about the purposes of the study. The repeated measures research design allowed a partial replication by collecting some data for which each individual could serve as his or her own control. In this design, a subset of the between-groups participants returned to experience a second lighting condition on another day. The data from their second visit was compared in repeated measures analyses to the data from their first visit.
Random assignment to the between-groups lighting conditions was achieved by randomly scheduling lighting conditions to testing days. Participants were randomly assigned to cubicles in the between-groups design (subject to the need to have equal numbers experiencing both
reflectance panels), and kept the same cubicle assignment if they returned for the repeated-measures design.
2.1.3 Independent Variables
2.1.3.1 Non-task surface luminance
Non-task surface luminance was varied by changing the fabric of the cubicle panels facing the occupant (behind the computer monitor). Five of the nine cubicles were grey with a reflectance of 0.30 (labelled light), and four were dark blue with a reflectance of 0.05 (labelled dark). This was the widest range of reflectances we could achieve with available materials.
2.1.3.2 Lighting manipulations
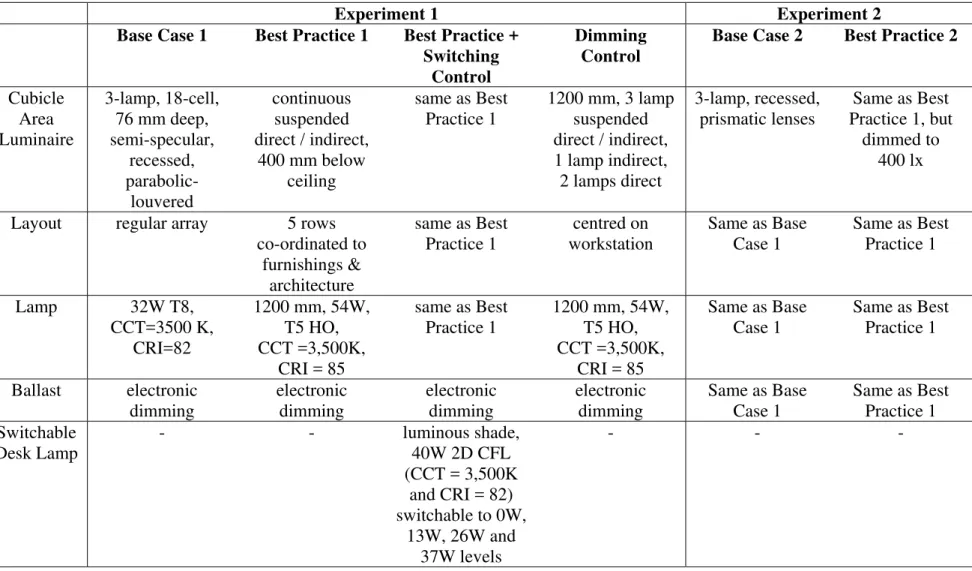
Four different lighting installations were compared. The choice of lighting installations and their labelling was based on extensive advance consultation with lighting researchers,
manufacturers, and designers as part of the project development process. All were designed to be representative of current office lighting practice in North America for a mid-level office. One of the authors, an IALD member with extensive office lighting experience, served as the lighting designer for this project; further, the four installations were reviewed by a panel of expert lighting designers before the experiment proceeded, to ensure that they were within the range of current practice and were suitable exemplars of the intended concepts. The implied gradation in lighting quality is consistent with previous research. 4 The four lighting installations are
summarized in Table 3 and described briefly here:
Base Case 1: Designed to represent the most common approach to office lighting in use today, it consisted of a regular array of recessed, parabolic-louvered luminaires (Figure 2).
Best Practice 1: The design team considered this the solution that would be the best practice for this type of office, providing a similar illuminance on the working plane as the Base Case 1 installation but brighter walls and ceiling and with reduced shadows and veiling
reflections. The basic design solution was a suspended direct / indirect luminaire (Figure 3 and Table 3).
Best Practice 1 with Switching Control: In this installation, the lighting of the hallway, conference room, and cubicle area was the same as in the Best Practice 1 lighting except that each cubicle was fitted with a free-standing desk lamp with a translucent shade (Figure 4 and Table 3), which the occupant was free to operate by changing the setting of the switch at any time. The lamp was set to 26 W at the start of the day.
Dimming Control: This condition provided greater control over workstation lighting to the occupant, while maintaining adequate ambient illuminance. Each cubicle had centered over it a suspended direct / indirect luminaire (Figure 5 and Table 3). The indirect component (1 lamp) operated at a fixed level, and the occupant could change the level of the direct portion of the luminaire output at any time using an interface on the computer in the workstation. The initial level was set to 50%.
2.1.3.3 Photometric conditions
Table 4 shows the mean illuminances provided by the four lighting installations on the work surface, on the monitor screen, on the keyboard, and at the participant's eyes, in the cubicles with the light and dark panels. Ranges (minimum to maximum) are provided for conditions with a degree of control.
The computer monitors were all set up to have a similar background colour. The screen luminance of a blank white screen display, in the absence of any lighting in the room, was 120 cd/m2.
2.1.4 Participant Characteristics
The participants were recruited from an office temporary services agency; and paid at the agency rate for each day they worked. They were all over 18 years of age and were required to have experience with Windows™-based word processing and spreadsheet software and a minimum typing speed of 30 words per minute. A total of 181 participants (69 male and 112 female, mean age = 32 years) provided valid data, of whom 45 (13 male and 32 female, mean age = 32 years) also returned for a second session. The repeated measures subset differed from the full between-groups sample for every demographic variable except years in the workforce and years as a temporary worker: The people who completed a second session included a higher proportion of women, a lower proportion of people aged 40 – 49, more contact lens wearers, and fewer people with only a high school diploma, than the between-groups sample. (Complete details of the sample are available in the full report. 6)
2.1.5 Dependent Measures and Procedure 2.1.5.1 Daily procedure
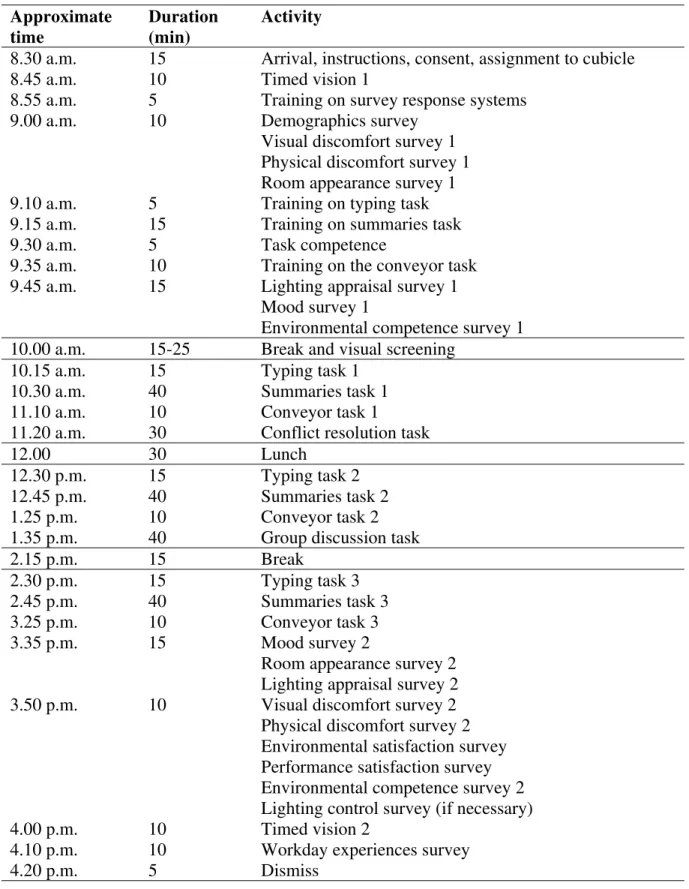
The tasks and questionnaires were structured to fill a full working day interrupted by the usual coffee and lunch breaks. The activities undertaken by the participants during the day are listed in chronological order in Table 5 and described below.
Participants arrived at the site between 8:30 a.m. and 9:00 a.m. each day in same-sex groups of 3-9 people. Sessions were either composed entirely of people who were in the
between-groups experiment (i.e., on their first visit), or of people who had returned for a second day as part of the repeated-measures experimental design. This ensured that all the between-groups participants had the same starting level of knowledge about the experiment, and could not acquire extra knowledge from a repeating participant in the same group.
The first session, from 8.30 a.m. to 10.00 a.m., was primarily used for collecting
demographic and current state information from the participants and for training the participants in the tasks. Subsequent sessions involved performance on a mixture of visual and cognitive tasks, with participants working as individuals or in a group. Several of the tasks and surveys were repeated so that changes over time could be examined.
2.1.5.2 Measurements of perceptions and feelings
Each concept in the linked mechanisms map was represented among the dependent variables (DVs), some by more than one DV. Details of the DVs are provided in the full report.6 Perceptions and feelings included:
• Appraisal: There were two tools for appraising the lighting. The Office Lighting Survey17
consists of ten questions in agree-disagree format. The NRC lighting quality scale18 is a set of Likert-scaled items that produces separate scores for Lighting Quality (0-4, higher values indicating higher lighting quality) and Bothersome Glare (0-4, higher values indicating more bothersome glare) ratings.
ratings based on Flynn et al.4, 9 These were reduced to four subscales using principal components analysis. The four subscales, all on scales from 0-99, were Attractive, Comfortable, Visibility, and Spaciousness; in all cases higher values indicate more preferred conditions.
• Mood: Arousal, pleasure, and dominance were rated using the Mehrabian and Russell 3-Factor Mood Scale,19 which returns scores for each scale between 0 and 8, in which higher numbers reflect more of the construct.
• Competence: Self-rated task competence was the estimate of one's likely performance on one of the cognitive tasks, expressed as the number of trials one expected to be able to complete in the three 20-minute periods devoted to the task. Environmental competence was the average of responses to 4 items (scored 0-8, higher values indicating greater environmental competence) developed by Jones.20
• Health and well-being: There were five measurements of this concept. Environmental satisfaction was the 4-item scale developed by Sundstrom et al.,21 which is scored from 0-4 (higher values indicate higher environmental satisfaction). A similar approach was used to quantify satisfaction with one's own performance: Self-rated productivity was a single item from Wilson and Hedge22, in which individuals rate their performance under these conditions relative to their usual performance, on a scale from -4 through +4. Positive scores indicate that these conditions improved their performance relative to their usual performance. Visual discomfort was the total of the intensity ratings for eight symptoms8 (range 0-32, higher scores indicate greater discomfort). There was a parallel 9-item scale for physical discomfort (range 0-36). Participants also rated the difficulty of the various tasks on Likert scales from 0-4, with higher scores indicating greater difficulty.
2.1.5.3 Performance measures
The performance measures were designed to provide quantitative measurements of clerical, cognitive, and visual aspects of work. They were:
• Timed vision test. Participants indicated whether or not they could see the target (a square grating) presented in the centre of the screen; the computer recorded accuracy and speed of performance. Gratings varied in luminance contrast (0 to 16 nominal grey levels), spatial frequency, and orientation (scores were averaged over size and orientation). Viewing distance was fixed using a simple chin cup placed in a marked position relative to the computer monitor. The dependent measure was a composite of time and accuracy: total correct identifications/total reaction time.
• Motivation. Motivation was conceptualised as the individual's willingness to persist at a difficult or impossible task.23 The NRC Conveyor Belt task24 was used to assess
motivation. This target identification task was presented at increasing speeds in a series of 8 15-sec steps. Participants were instructed to keep trying as long as possible, but to stop when the task became impossible to keep up with. The outcome measure was the speed at which the participant either ceased to attempt the task (1-8), or at which responses became random. We assigned a score of 9 to participants who were able to perform this task at the highest speed. For data analysis this score was cubed to improve the normality of the distribution; thus, the final range was 1-729.
• Vigilance. Accuracy of performance on the conveyor belt task at lower speeds was one measure of vigilance or attention. This was expressed as the hit rate: [(hits-false
positives)/targets], averaged over the three middle speeds. A second measure of vigilance or attention was the speed with which the participant responded to a random prompt
similar to the arrival of an e-mail message. This task could occur at any time during the day apart from when the participants were on a break or when the conveyor belt or typing tasks were running. Vigilance was measured as the time (in seconds) taken to respond to the appearance of a yellow envelope icon announced by a beep. For analysis we
transformed this variable using the inverse to improve normality. • Typing task. This task used the NRC Typing Task software25
to measure the speed of perfectly accurate transcription typing from printed passages on paper. The printed passages were presented in three print sizes (8 point, 12 point and 16 point), all at the same high luminance contrast, done in a random order that differed between
workstations. The dependent measure was correct characters per second.
• Cognitive judgements. Participants read 300-word passages on the computer and short summaries of the passage, and were asked to provide ratings of the accuracy of the
summary relative to the passage, the grammatical accuracy of the passage, and the quality of the writing. These were all single-item ratings on Likert scales from 0-4 (higher values indicating more favourable judgements). We averaged the ratings over the first six
passages read in each session. They did a similar task using passages printed on paper, but rated interest, ease of understanding, suitability for publication in a fictitious magazine (all on scales from -3 to +3), and likelihood that the group of participants would choose the passage for the magazine (probability, 0-100). Paper- and computer-based judgements were analysed separately.
• Cognitive performance. Work with the passages and summaries provided three measures of speed of work and one of accuracy. Participants were asked to categorize the
summaries by topic (politics, sports/entertainment, business and science/health); the sum of correct categorizations (out of 6 in a session) was the accuracy measure. This was squared for analysis, giving a possible range of scores from 0-36. Speed measures (in seconds) were the speed of categorization; the speed of making cognitive judgements; and the speed of choosing the best sentences to form a summary of a new passage (summary extraction).
• Work structure. For the typing, conveyor belt, and summary extraction tasks, the time intervals (in seconds) between completing one part of the task and starting the next were recorded. These were analysed to give an indication of whether or not lighting conditions altered the work strategies of participants, as had been observed in a prior experiment.26 2.1.5.4 Social behaviour
We included measures of social behaviour in order to test hypotheses derived from positive affect theory.12, 27
• Liking for group members. The participants rated the degree of liking for the other group members following a group discussion task in which the group chose lead articles for a fictional magazine for which they role-played being the editorial board. This was the average score of five items, scaled from -3 to +3, in which positive values indicate liking and negative values indicate dislike for the others in the group.
• Conflict resolution. Five scenarios involving workplace conflicts were presented on paper, each with five alternative responses based on Kilmann and Thomas:28
accommodation, avoidance, collaboration, co-operation, or competition. For each scenario, the participant was first asked to rate the likelihood that they would adopt each alternative response, the likelihood being given on a 7-point scale from very unlikely to very likely (-3 to +3). After assessing each alternative response in this way, the
participant was asked, without looking back at these answers, to rank order the five alternative responses (1-5).
• Willingness to volunteer. The participants were asked at the end of the day how much time they would be willing to spend completing questionnaires on environmental issues regarding buildings, transportation, and energy conservation, at home, on a scale ranging from zero to ten hours, and how willing they would be to spend another day like they had just completed (from 0-99).
2.2 Results - Experiment 1
The general between-groups analysis was a 4 x 2 (Lighting Design X Reflectance) factorial. For Lighting Design, three orthogonal planned comparisons were tested: Base Case 1 versus Best Practice 1; Best Practice 1 versus Best Practice 1 + Switching Control; and, Best Practice 1 versus Dimming Control. For Reflectance there was one possible comparison,
between Light and Dark partitions. All possible interactions of the three Lighting Design planned comparisons and the Reflectance comparison were also examined. The repeated measures
analysis was a 2-level (Lighting Design) comparison between Base Case 1 and Dimming Control. Participants who repeated kept the same reflectance on both occasions, making it a between-groups variable. Reflectance was ignored in the repeated measures analysis because it lacked statistical power.
Extensive manipulation checks were conducted to test for possible biases either in the random assignment of participants to conditions for the between-groups comparison or
expectancies that might have biased the results. The random assignment appeared to be effective; however, there was evidence that the people who were in the Base Case 1 lighting condition were less likely than people in other experimental conditions to identify lighting as a purpose of the experiment (~20% for Base Case 1, vs. ~40% for the other conditions). This pattern was expected because the Base Case lighting was typical of current office practice, whereas the other lighting conditions were relatively less common. These expectations seem unlikely to have significantly biased the results for the between-groups comparison, but the possibility that these opinions may have intensified responses for the repeated measures participants on their second visits cannot be ruled out.
There were statistically significant results on measures of perceptions, feelings, and performance, but none for social behaviours. Only key results will be discussed here for reasons of brevity. Detailed results are available in Boyce et al.6
2.2.1 Perceptions and Feelings
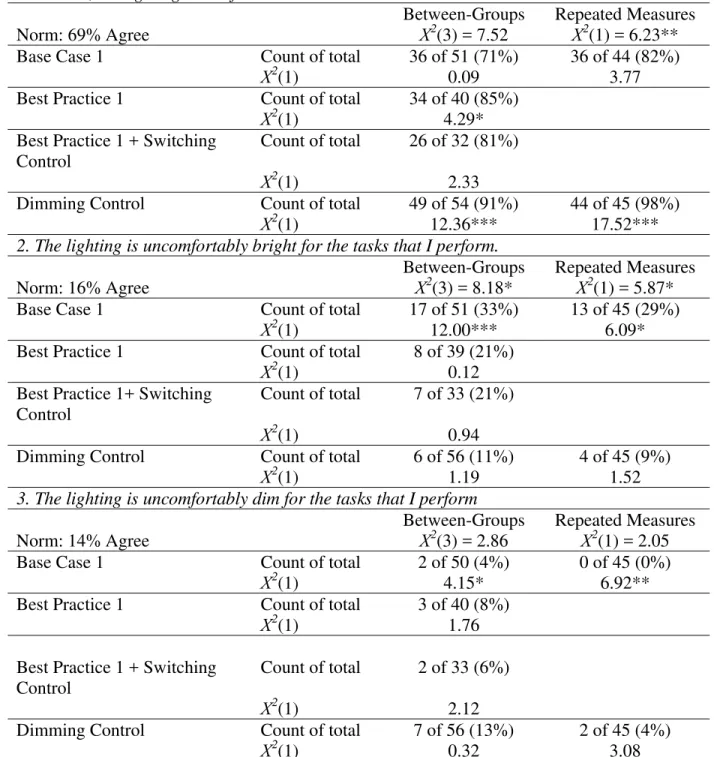
The Office Lighting Survey results for Experiment 1 are shown in Table 6. The table includes overall significance tests for differences between lighting conditions and, for each individual lighting condition, a significance test against normative data from a sample of over 800 individuals in 13 offices with new or energy-efficient upgraded lighting, all in the upper North-East of the USA.17 (There were no differences in office lighting survey results as a function of panel reflectance.) This table shows the percentage of agreement with each of 10 statements, for each lighting condition. We used the Χ2 test of independence to determine whether the pattern of agreement was the same for the four lighting designs in the between-groups research design (3 degrees of freedom, at the top of the third column for each question), and for the two conditions in the repeated-measures design (1 degree of freedom, at the top of the fourth column for each question). We also used Χ2 to test, for each lighting condition, whether the % of agreement matched the agreement that would be predicted by the normative sample; these are the 1 degree-of-freedom tests associated with each lighting design.
All of the lighting conditions were relatively comfortable: even the Base Case 1 lighting, which was intended to be representative of the majority of present-day office lighting, was rated as comfortable by 71% of respondents in the between-groups design and 82% of the repeated-measures participants. Equally importantly, the participants distinguished between the various lighting conditions, with the strongest distinctions for the repeated-measures participants.
The most substantive difference for the between-groups data is between the Base Case 1 and the other conditions. For both overall judgments (questions 1 and 10), the Base Case 1 group responded in a similar way to the normative sample. The percentage agreement that the lighting is comfortable rose for all conditions with direct / indirect systems, and was highest for the Dimming Control group. Similarly, the Base Case 1 condition was judged most similar to other workplaces (question 10) but the other conditions were judged as better than lighting in other workplaces. Base Case 1 lighting was also more likely to be rated as uncomfortably bright or for the luminaires to be too bright. This is consistent with differences between the normative and Base Case 1 light levels: the horizontal illuminance target would have been ~500 lx for the normative sample rather than the 600 lx for the Base Case 1.
One notable finding is the response pattern for the Best Practice 1 + Switching Control group on question 6, "Reflections from the light fixtures hinder my work." A higher-than-expected percentage of this group agreed with the statement (39%), indicating that reflected images were somewhat of a problem for them. The percentages of agreement for the other groups were all consistent with the normative data (19%). It is not surprising that the Best Practice 1 + Switching Control participants might have found reflected images problematic, as the luminous desk lamp had the potential to cause such reflections, whereas all of the other luminaires were designed to prevent them.
Turning to other measurements of perceptions and feelings, there were few statistically significant differences for the MANOVA and ANOVA analyses of planned comparisons between lighting designs. This is disappointing but not surprising, given the Office Lighting Survey results showing that all the lighting conditions were considered largely acceptable. However, there were statistically significant results for the repeated measures analysis, which showed that the Dimming Control condition was rated as having better lighting quality and higher ratings of environmental satisfaction and self-rated productivity than the Base Case 1 lighting (Table 7).
There were statistically significant main effects of time on the room appearance judgements, mood, and visual and physical discomfort. These are all consistent with the
development of fatigue over the working day. Details are in the full report.6 On a scale of 0-100, ratings of the room as comfortable (M = 70.2 [SD = 13] AM and M = 66.1 [SD = 14.4] PM) and visible (M = 64.8 [SD = 13.8] AM and M = 63 [SD = 15.2] PM) dropped from the morning to the afternoon. Mood, rated on a scale from 0-8, showed similar drops for ratings of pleasure (M = 4.98 [SD = 1.44] AM and M = 4.32 [SD = 1.66] PM) and arousal (M = 3.65 [SD = 1.03] AM and M = 3.42 [SD = 1.27] PM) for the between-groups sample, and pleasure for the repeated
measures design (M = 5.17 [SD = 1.39] AM and M = 4.57 [SD = 1.74] PM). Both visual and physical discomfort got worse over the course of the day, which is consistent with other research.29 Visual discomfort (on a scale from 0-32 where higher values indicate more severe symptoms) went from a mean of 2.34 in the morning (SD = 2.97) to 4.87 (SD = 5.02) in the afternoon. Physical discomfort, on a scale from 0-36, went from a mean of 2.46 (SD = 2.67) in the morning to 4.65 (SD = 4.55) in the afternoon. These were large effects in terms of explained variance, although the scores always remained low, indicating that in absolute terms people were
never very uncomfortable.
The results for this set of DVs may be summarized thus:
• Appraisals of the lighting differentiated between the lighting designs according to expectations.
• The experiment was sensitive to known effects of fatigue. • Dimming control can be very satisfactory.
2.2.2 Performance
The experimental design included two non-lighting variables to test that the DVs were sensitive as expected. The source print size for the typing task and the contrast (grey level) for the timed vision test both produced the expected results: Accurate typing was faster when the source text size was larger, and overall pattern of visual performance by contrast had the
expected shape. Performance was lowest when the target was just barely visible (a difference of one grey level), and improved rapidly but with diminishing returns for increased contrast, levelling off at a difference of eight grey levels, and improving slightly for a difference of zero grey levels when the uncertainty of response was lower. These effects are expected based on knowledge of visual processes.2 In addition, performance improved with practice (tested here as the effects of time) on the timed vision test, typing test, and measures of cognitive performance (speed and accuracy). Detailed results are in the full report. 6
Figure 6 is an exemplar of the non-lighting effects, showing the interaction effect of target contrast and time on composite visual performance. Composite visual performance improved from morning to afternoon, and followed diminishing returns as contrast increased from 1 to 16 grey levels. Moreover, the effect of contrast on composite visual performance was larger in the afternoon than the morning, as indicated by the steeper slope for the linear
regression line; this interaction effect was statistically significant (F(1, 172) = 63.75, p<.001, η2
partial = 0.27).
The tests of lighting effects did not show simple main effects of luminance distribution (contrast of Base Case 1 vs. Best Practice 1) or panel reflectance on any measure of performance, although there were a few small interaction effects in varying directions. Most of the statistically significant effects involved comparisons related to adding individual lighting control. Only these effects will be discussed here because they form an interpretable pattern over several DVs and are therefore more reliable.
Motivation was assessed as persistence at the NRC Conveyor Belt task, and was
measured at three times, once in late morning (session 2) and twice in the afternoon (sessions 3 and 4). There were three statistically significant interaction effects of lighting control on motivation in the between-groups design. (The repeated-measures design did not show comparable effects, but closer examination of the data revealed that there might have been a selection bias in which the most motivated individuals agreed to participate a second time, which would have masked any effect of lighting control.6) The three statistically significant effects for motivation were:
• Best Practice and Best Practice 1 + Switching Control contrast, interacting with Time - linear trend (F(1, 173) = 4.25, p<.05, η2partial = 0.02). Figure 7 shows that the speed of random responding remained stable from session 2 to session 4 for the Switching Control group, but declined over time for the Best Practice 1 group. Post hoc tests confirmed this interpretation.6
• Best Practice 1 and Dimming Control, interacting with Time - linear trend (F(1, 173) = 6.09, p<.01, η2partial = 0.03). As seen in Figure 8, people with Dimming Control
maintained their motivation scores across time, whereas the Best Practice 1 group declined over time. There was no main effect of lighting design, and post hoc tests confirmed that there were no differences between the two groups at any of the three sessions. It appears that the availability of dimming control acts as an inoculation against the drop in motivation that occurs over the working day.
• Best Practice 1 vs. Dimming Control X Reflectance (F(1, 173) = 4.82, p<.05, η2
partial = 0.03). Figure 9 shows the interaction. Post hoc tests revealed that the nature of the interaction was a significant difference between motivation levels for Light versus Dark partitions under the Best Practice 1 design, with motivation higher for the people in darker workstations, but no difference in motivation levels for the two partition reflectances under the Dimming Control condition.6
Vigilance also showed a statistically significant interaction of Best Practice 1 versus Dimming Control by time-linear. The multivariate test (Wilks’ Λ = 0.95, F(2, 149) = 4.22, p<.05, η2partial = 0.08) was associated with a significant univariate effect for the hit rate on the medium speeds of the conveyor belt task (F(1, 150) = 8.10, p<.01, η2partial = 0.16), and is shown in Figure 10. The post hoc tests showed that the hit rate for the Dimming Control group
increased over time. Although the means for the Best Practice 1 group dropped from sessions 2 through 4, this linear decline was not statistically significant.
Performance on the typing task was measured as correct characters entered per second. The between-groups design showed several three-way interaction effects involving lighting conditions and reflectances. These three-way interactions were small and difficult to interpret. Full details are given in the final report.6
For work structure there was a statistically significant main effect of Best Practice vs. Best Practice1 + Switching Control for the multivariate effect (Wilks’ Λ = 0.95, F(3, 171) = 3.31, p<.05, η2partial = .02) associated with a significant univariate test for the breaks between paragraphs in the typing task (F(1, 173) = 5.30, p<.05, η2partial = .03). People with a switchable desk lamp took shorter breaks (M = 1.13 sec, SD = 0.24) than those without (M = 1.23 sec, SD = 0.28).
The results for the various performance measures may be summarized thus: • Visibility, practice, and fatigue effects were found as expected.
• Individual control over lighting has performance benefits.
2.3 Discussion - Experiment 1
Experiment 1 demonstrated that people can discriminate between lighting designs in terms of comfort and in comparison to other office lighting installations with which they are familiar. For example, the Base Case 1 parabolic lighting was considered comfortable by 71 percent of the participants who experienced it but the Dimming Control lighting was considered comfortable by 91 percent of those who experienced it. Further, the Best Practice 1 installation was considered comfortable by 85 percent of subjects.
This experiment also found novel, beneficial effects of individual control on performance involving interactions with the passage of time. Boyce, Eklund and Simpson30 found no clerical work performance effects associated with having control over lighting, but did not use tasks similar to those that in this experiment showed effects. Veitch and Newsham18 did not demonstrate lighting control effects on performance using a matched design in which
participants with control and those without experienced the same visual conditions. In a within-subjects experiment in which participants had control over lighting for the last session in the working day, participants showed improved satisfaction, mood, and comfort when they had
control, but not improved performance.31
However, Experiment 1 did not deliver dramatic effects of light distribution on performance. Although disappointing, the results are in keeping with other tests of lighting design effects on office work performance. Veitch and Newsham4 found few performance effects involving planned comparisons between direct and indirect lighting systems, and the effects they observed were of comparable size to the ones found here.6 Similarly, Eklund et al.10 found no effects of light distribution on clerical work (data entry and proofreading).
The absence of effects was not a result of inadequate experimental sensitivity, as shown by the findings of expected effects of practice, fatigue, and changing visual demands (contrast and print size). This implies that although the participants did perceive the differences between the lighting distributions, this perception made very little difference to their performance of the tasks. It may be that the performance of the tasks is governed by the stimuli the tasks provide to the visual system and the luminous conditions in the immediate surrounding area, whereas the appraisal of the lighting is influenced by a wider range of considerations, among them being not only the ability to see the details necessary to do the task, but also the appearance of the office as a whole, and the appearance of the fixtures. We further probed this possibility with a replication study, in which we compared two lighting designs selected to provide more extreme, but still realistic, light distributions.
3. Experiment 2
3.1 Method
3.1.1 Setting and Furnishings
The setting and furnishings used were identical to those used in Experiment 1. 3.1.2 Experimental Design
Experiment 2 was a 2 x 2 (Lighting Condition x Panel Reflectance) factorial between groups experiment (although there were repeated measures of most tasks over the working day). Table 8 shows the schematic experimental design and achieved sample sizes. Participants were randomly assigned to one of the four experimental conditions.
3.1.3 Independent Variables and Photometry
The non-task surface luminance was varied, as for Experiment 1, by varying the fabric of the panel that faced the participant behind the computer monitor.
The were two lighting installations for Experiment 2. The comparison was chosen to represent a commonly existing, but not contemporary, installation (recessed lensed troffers, called Base Case 2 [see Figure 11]) and a common retrofit (suspended direct / indirect luminaires at a low illuminance for energy-efficiency, called Best Practice 2 [see Figure 3]). These are summarized in Table 3.
Table 9 shows the mean illuminances provided by the two lighting installations on the work surface, on the monitor screen, on the keyboard, and at the participant's eyes, in the cubicles with the light and dark panels.
3.1.4 Participant Characteristics
The recruitment procedure for participants was identical to that for Experiment 1, with one addition: People who had participated in Experiment 1 were not permitted to participate in Experiment 2. There were 107 participants (42 male, 65 female, mean age = 33 years).
3.1.5 Dependent Measures and Procedure
3.2 Results - Experiment 2
The basic model for MANOVA and ANOVA tests was a 2 x 2 (Lighting Design x Panel Reflectance) factorial design. Extensive checks of the data revealed no evidence of any problems of random assignment to experimental conditions. There was also no evidence of biased
participant expectancies in the answers to the end-of-day questions about the purpose of the experiment. Only key results appear here; details are available in the full report.6
3.2.1 Perceptions and Feelings
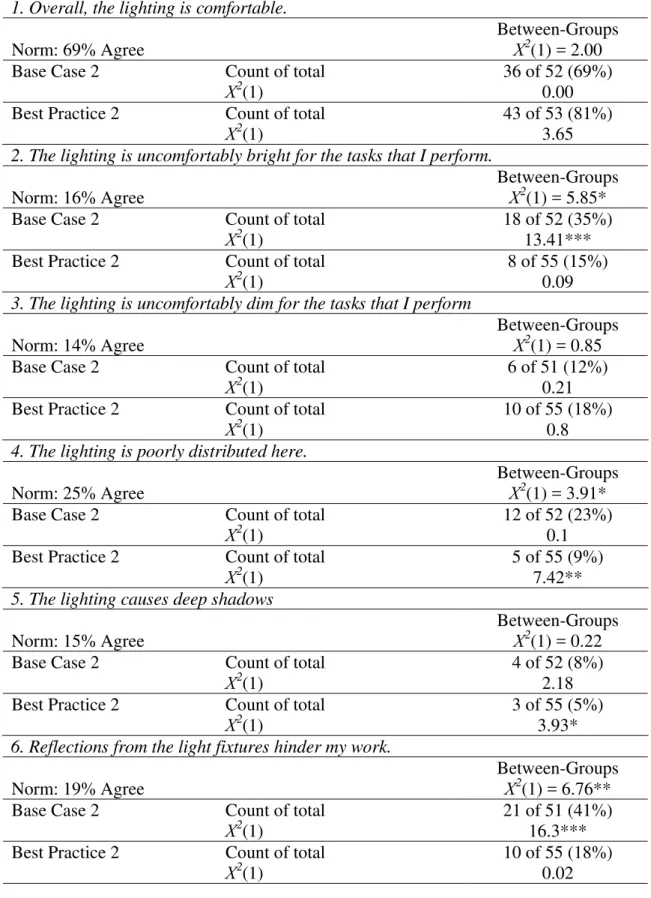
The Office Lighting Survey results, based on the afternoon judgements, appear in Table 10. Base Case 2 was not different in comfort from the norm, with 69% agreeing that “the lighting is comfortable”. Noticeably more people in the Best Practice 2 condition agreed with this
statement (81%), which is comparable to the level achieved by the Best Practice 1 condition in Experiment 1 (85%). The Base Case 2 condition was judged to be uncomfortably bright by a higher-than-expected number of people. This question also showed a significant difference between the two groups. Similarly, Base Case 2 was also more likely to be judged to cause reflections that hindered work and to have light fixtures that are too bright. Conversely, Best Practice 2 showed a lower-than-expected percentage agreement that “the lighting is poorly distributed here”. Overall it appears that people judged the Best Practice 2 condition to be better than Base Case 2.
Interestingly, however, that did not translate into between-group differences on question 10. There were no differences between the groups, nor between either group and the normative sample, on the question of whether the lighting installation was worse, the same, or better than in other places. It could be that the lower illuminance of Best Practice 2 (as opposed to Best
Practice 1) made this lighting design equivalent to other places, particularly for people in the group whose personal preferences would be for higher illuminances.
The ANOVA and MANOVA tests for the other measures of perceptions and feelings showed few statistically significant effects, but the few lighting effects are interesting.
The lighting quality scale ratings showed generally good quality but the two lighting designs were not different in their ratings on these scales. For Base Case 2, the mean lighting quality rating was 2.84 (SD = 0.82); for Best Practice 2, the mean lighting quality rating was 2.83 (SD = 0.77). The respective ratings for Bothersome Glare were: Base Case 2 M = 1.33 (SD = 1.00), Best Practice 2 M = 0.98 (SD = 0.96). Thus, in general the lighting in both designs was rated as being of good quality, and glare was not a bothersome problem. However, responses to open-ended questions about the sources of glare revealed that people in the Base Case 2
condition were more likely to say that the lighting was a source of glare or reflections on the computer screen. Thirty-eight per cent (38%) of Base Case 2 participants reported this, versus 16% of Best Practice 2 participants. These percentages confirm the pattern seen in the responses to question 6 of the Office Lighting Survey.
Turning to the analysis of the Preference concept, we see that there was a small, but statistically significant three-way interaction (Wilks’ Λ = 0.91, F(4, 100) = 2.65, p<.05, η2partial = .02), which was associated with a significant univariate test for the rating of Comfort (F(4, 100) = 7.88, p<.01, η2partial = .07) (see Figure 12). Post hoc tests (see full report 6) showed that in the morning, the Base Case 2 - Light was rated as more comfortable than the Best Practice 2 - Light. The Base Case 2 - Light and Best Practice 2 - Dark ratings both dropped significantly by the afternoon. Base Case 2 - Dark and Best Practice 2 - Light stayed the same.
This pattern can be interpreted as indicating that although Base Case 2 - Light and Best Practice 2 - Dark received higher initial ratings, they could not sustain them over time. The other
two conditions received sustained ratings over time, which is a more favourable outcome in view of the main effect of time on this variable, which showed a drop from morning to afternoon (F(1, 103) = 19.85, p<.001, η2partial = .16). We speculate that the Base Case 2 - Light appeared
comfortable in the morning because of its overall lightness, but that it dropped in comfort by the afternoon because of its potential for glare problems. Best Practice 2 - Dark, by comparison, might be have been rated as comfortable in the morning because of the combination of direct / indirect lighting and variety in surface luminances, but this degree of variety appears not to have been suitable for sustained work periods (see below, for Performance effects involving this interaction).
For the three mood scales, the only statistically significant result was a small multivariate main effect of Time with significant univariate effects for Pleasure (a drop from a mean of 4.78 (SD = 1.38) to 4.38 (SD = 1.44), F(1, 93) = 7.90, p<.01, η2partial = .08) and Dominance (increase from a mean of 3.97 (SD = 0.81) to 4.14 (SD = 0.76), F(1, 93) = 4.65, p<.05, η2partial = .05). The Dominance effect is difficult to explain as it has not been found in previous research. In addition, these participants did not show a drop in Arousal scores in the afternoon, which has been typical in previous research.4, 18
For the measures of satisfaction and well-being, there were no statistically significant effects of lighting condition or panel reflectance. Overall, most participants were satisfied with the environment: Average Environmental Satisfaction was 2.75 (SD = 0.67), and the median was 3. For Performance Satisfaction, the overall mean was 2.86 (SD = 0.64). Self-rated productivity had an overall mean of 0.47 (SD = 1.64), indicating than on average the participants believed that the environment improved their ability to work a small amount relative to most places where they usually worked. Although there were no effects of lighting design, both visual and physical discomfort got worse over the course of the day, as they had in Experiment 1 and previous research.29 The scores always remained low in relation to the possible scale maxima, indicating that in absolute terms people were never very uncomfortable.
The results for the various measurements of Perceptions and Feelings may be summarized thus:
• Appraisals of the lighting differentiated between the lighting designs. • The experiment was sensitive to known effects of fatigue.
• Lighting and interior design choices interact in influencing room appearance. 3.2.2 Performance
As in Experiment 1, we observed the expected effects of changing the visual demands of the task (contrast levels for the timed vision test and source print size for the typing task) and practice (improvements in performance from the first to last session on cognitive tasks, the timed vision test, and typing). These effects generally replicated the non-lighting effects seen in
Experiment 1 and will not be discussed further here. Consult the full report for the detailed results.6
DVs that in Experiment 1 showed effects involving individual control but not lighting design (motivation and vigilance) also did not show lighting design effects in Experiment 2. Cognitive performance showed a few statistically significant tests, all interactions, either of lighting design and reflectance, lighting design and time, or reflectance and time. We will focus this discussion on the most interesting effects, which are interactions of lighting design and partition reflectance.
The typing task showed two interesting interactions involving the comparison between Base Case 2 and Best Practice 2, one involving partition reflectance and the other involving time.
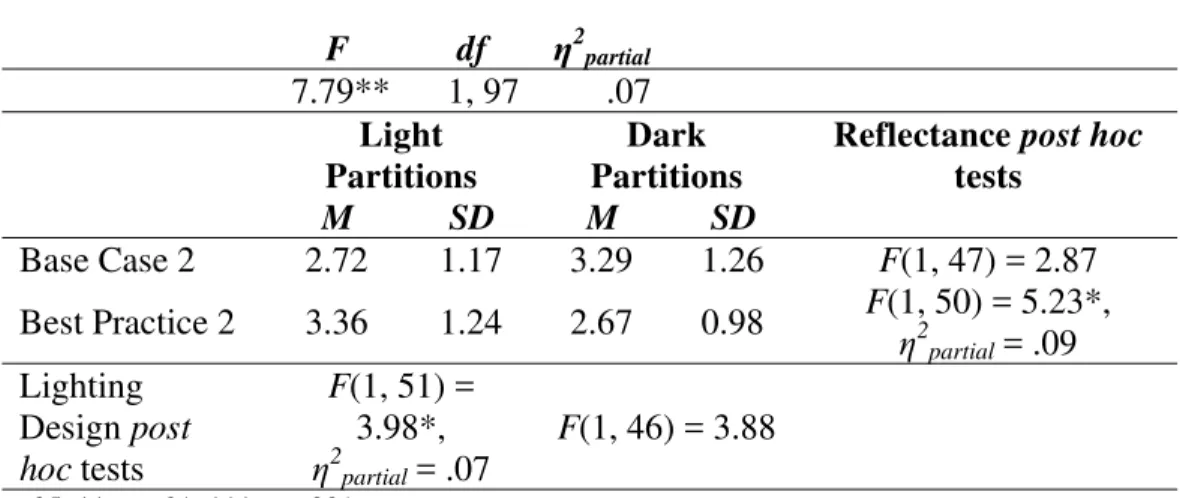
Table 11 summarizes the interaction of Base Case 2 vs. Best Practice 2 by Reflectance. The post hoc tests revealed that for Base Case 2, there was no difference between performance with light and dark partitions; whereas, for Best Practice 2, performance was better with light partitions than dark ones. Interestingly, with light partitions, performance was better under Best Practice 2, but there was no difference between the lighting conditions when the partitions were dark.
The other statistically significant interaction for the typing task was the Base Case 2 vs. Best Practice 2 X Time-Quadratic interaction, summarized in Table 12. The post hoc tests revealed that there was no quadratic effect for Base Case 2, but there was a large quadratic effect for Best Practice 2. The two groups ended up at the same place, and indeed did not show
statistically significant between-groups differences at any session. One interpretation of this pattern might be that learning took place faster for Best Practice 2 so the participants reached a plateau at Session 3 that the others did not reach until Session 4.
Although there were no effects of lighting design or reflectance on cognitive judgements, there was a lighting design effect on cognitive performance (speed and accuracy). This was an interaction of Base Case 2 vs. Best Practice 2 X Reflectance X Time-Quadratic on categorization accuracy (Table 13). In general, categorization accuracy increased over time, but for the Best Practice 2 - Dark condition there was a marked quadratic effect. Performance in this group dropped from Session 2 to Session 3, and then rebounded in Session 4. Moreover, the post hoc tests revealed that in Session 2, the Best Practice 2 - Dark condition did significantly better than the Base Case 2 - Dark, but the reverse was true in Session 3. By Session 4, all groups performed equally well. Only the Best Practice 2 - Dark condition showed a post-prandial dip in
categorization accuracy. One possible explanation might be that the higher illuminance at the occupant's eye in the other three conditions might have increased arousal sufficiently to overcome a post-lunch tendency to perform less well; without a direct measurement of physiological arousal, this remains a speculation for future research to test.
The results for the various performance measures may be summarized thus: • Visibility and practice fatigue effects were found as expected.
• Systems with an indirect component interact with partition reflectance to influence task performance.
3.3 Discussion - Experiment 2
Experiment 2 was a true replication and extension of Experiment 1. Participants demonstrated the ability to discriminate between the lighting designs, and showed most of the same patterns as in Experiment 1 of practice, fatigue, and changes in task visibility.
The lighting designs in Experiment 2 were chosen to contrast a lighting design that caused computer glare problems with one that did not. As expected, the Office Lighting Survey and the open-ended responses from the NRC Lighting Quality questionnaire both showed that the Base Case 2 condition was perceived as causing more glare than the Best Practice 2, which would be expected for a recessed prismatic luminaire installation. The Office Lighting Survey results furthermore indicated that overall the Best Practice 2 installation was perceived as better than the Base Case 2.
The present experiment had more statistical power than most previous experiments because of its larger sample size, and also differed from the others in including the partition reflectance variable and repeated measurements over an entire working day, which allowed interactions to be revealed. The two-way interaction effect on typing performance showed a fairly clear benefit for Best Practice 2 with light partitions, rather than dark. The interaction effect with time on the categorization accuracy further suggested that the Best Practice 2 with
dark partitions could create undesirable conditions at least some of the time.
4. General Discussion
These two experiments were undertaken to determine to what extent different levels of lighting quality – validated by independent lighting designers – might affect the health, well-being and task performance of office workers. They were designed to build upon the foundations of our separate labs' prior research,4, 10, 18, 30 but differed in having a greater degree of realism: Variations in lighting quality were created by using commonly-available lighting equipment in designs that strove to be typical, installed in a commercial office space. The office workers who experienced the lighting conditions were temporary office workers, with no expert knowledge of lighting.
The results are both interesting and disappointing, and generally agree with the previous research. Lighting design, within this range of variations on current office lighting installations, did not have the simple, direct effects on performance or well-being that many researchers have sought.32-34 However, there were several interaction effects that reveal more subtle, longer-term effects that are worthy of further research attention, and clear evidence that participants
discriminated between the lighting conditions.
The discrimination between lighting conditions can provide guidance for lighting design choices. Although both Base Case 1 and Base Case 2, both fully direct lighting systems, were considered comfortable by approximately 70% of participants, it is possible to satisfy more of the people. The suspended direct / indirect Best Practice 1 and Best Practice 2 lighting designs were rated as comfortable by 85 % and 81%, respectively. Dimming Control, also a suspended direct / indirect lighting system, was considered comfortable by 91%. Present-day lighting practice might satisfy many, but adopting suspended direct / indirect systems and giving individuals control over their workstation lighting will likely widen the pool of satisfied occupants.
These experiments did reveal interactions of lighting design with time, room surface reflectance, and task characteristics. The participants’ different perceptions of the lighting designs made very little immediate difference to their performance of the tasks. Traditional visibility models would predict this,2 given that all of the lighting conditions created adequate visibility of the tasks and that all of the tasks were sensitive to changes in visual demands. The interactions with time suggest the possibility of effects emerging following longer periods of exposure to a given lighting design, or in combination with other features of the work
environment.
The interaction effects suggested that there might be small benefits to a direct / indirect lighting system, depending on the illuminance, the partition reflectance, and the task. At the illuminance said to be typical of current practice (Best Practice 2), the best outcomes for the Best Practice 2 lighting mostly occurred for people in cubicles with light-coloured partitions. This finding makes sense in relation to the physical properties of direct / indirect systems and to the perception of them,35 but the interaction with room surface properties merits further attention, with extension to a broader range of reflectances.
The pattern of effects in Experiment 1 suggests that individual control over lighting can help to overcome reductions in motivation and attention that develop over the course of a
working day. Other research has not found such an effect for lighting controls,30, 31, 36 but did not involve the same array of non-lighting variables for interactions. Other investigations have found that individual control over lighting leads to improved mood and satisfaction by allowing
individuals to attain their preferred luminous conditions.13, 31 Two separate papers will address this aspect of the present experiments, one describing direct tests of the linked mechanisms map37 and one concerning the use of the individual controls and the associated lighting conditions.38
The results of these experiments have serious implications for future studies of the effects of lighting quality on the performance of office work. Successive investigations have examined the question with progressively more realistic experimental settings and with a variety of
common, carefully-designed lighting installations, but have found few simple effects of lighting design. There is little point in further direct replications of this kind. If any such effects exist, they are small, which means that a deliberate effort would be required to improve the ability to detect small effect sizes.
Whether spending more and more resources to detect smaller and smaller effects is worthwhile is a question that needs to be carefully considered by all involved, particularly when there is an alternative approach: Move the effort into the field. The results of such investigations would have a higher level of realism than is possible in a simulation experiment, which cannot fully re-create the context of a functioning workplace. Effects involving visibility occur regardless of context, but mood and motivation effects are context-dependent. Studying these latter effects requires real people in real organizations.
Field investigation would also allow the accumulation of results over an extended period of time. Lighting conditions that can be ignored for one day might become more important when one is exposed to them for many days and months. Conversely, it may be that lighting conditions that are seen as better on first acquaintance become the norm over many months and so reduce in effect. Given the results of the present study, it would be interesting to determine whether
working under well-designed lighting (particularly with some degree of individual control) could offset the ill effects of high job demands over the long run.
Finally, field research into lighting effects on people at work would allow for the possibility of measuring the effects of lighting conditions on aspects of performance and behaviour at an organizational level rather than an individual level. For instance, absenteeism, recruitment, and staff retention are important considerations to organizations. Although we know of no targeted research into lighting's effect on organizational productivity, there are other investigations that suggest that physical environmental conditions influence important organizational outcomes. Several investigations have found that satisfaction with the physical environment predicts job satisfaction and/or organizational commitment.39-41 It is logical to expect that any design choice, including lighting, that can improve environmental satisfaction should also lead to beneficial outcomes on these variables. Carefully-designed field investigations, over long periods and with large samples, could provide the evidence that many have long lusted after, that lighting quality contributes to organizational productivity.
5. References
1 Rea MS, Ouellette MJ. Relative visual performance: A basis for application. Lighting Research and Technology 1991; 23(3):135-44.
2 Boyce PR. Human factors in lighting. 2nd edition. London: Taylor & Francis, 2003. 3 Veitch JA, Julian W, Slater AI. A framework for understanding and promoting lighting
quality. J. A. Veitch, Ed. Proceedings of the First CIE Symposium on Lighting Quality . Vol. CIE-x015-1998 . Vienna, Austria: Commission Internationale de l'Eclairage Central Bureau, 1998: 237-41.
4 Veitch JA, Newsham GR. Lighting quality and energy-efficiency effects on task performance, mood, health, satisfaction and comfort. Journal of the Illuminating Engineering Society 1998; 27(1):107-29.
5 Veitch JA, Newsham GR. Determinants of lighting quality I: State of the science. Journal of the Illuminating Engineering Society 1998; 27(1):92-106.
6 Boyce PR, Veitch JA, Newsham GR, Myer M, Hunter C. Lighting quality and office work: A field simulation study. Richland, WA, USA: Pacific Northwest National Laboratory, 2003; PNNL 14506. Available for download at http://irc.nrc-cnrc.gc.ca/fulltext/b3214.1/ or
http://www.lrc.rpi.edu/researchTopics/humanFactors/productivity.asp. (09 November
2004)
7 Wyon DP. Indoor environmental effects on productivity. In: Teichman KY, Ed. IAQ '96: Paths to Better Building Environments. Atlanta, GA: American Society of Heating, Refrigerating, and Air Conditioning Engineers, 1996: 5-15.
8 Wibom RI, Carlsson LW. Work at video display terminals among office workers. In: Knave B, Wideback PG, Eds. Work with Video Display Units 86. Amsterdam, the Netherlands: Elsevier Science, 1987: 357-67.
9 Flynn JE, Hendrick C, Spencer T, Martyniuk O. A guide to methodology procedures for measuring subjective impressions in lighting. Journal of the Illuminating Engineering Society 1979; 8: 95-110.
10 Eklund NH, Boyce PR, Simpson SN. Lighting and sustained performance. Journal of the Illuminating Engineering Society 2000; 29(1):116-30.
11 Eklund NH, Boyce PR, Simpson SN. Lighting and sustained performance: Modeling data-entry task performance. Journal of the Illuminating Engineering Society 2001; 30(2):126-40.
12 Baron RA, Rea MS, Daniels SG. Effects of indoor lighting (illuminance and spectral distribution) on the performance of cognitive tasks and interpersonal behaviors: The potential mediating role of positive affect. Motivation & Emotion 1992; 16(1):1-33. 13 Newsham GR, Veitch JA. Lighting quality recommendations for VDT offices: A new
method of derivation. Lighting Research and Technology 2001; 33:97-116.
14 Bandura A. Self-efficacy mechanism in human agency. American Psychologist 1982; 37(2):122-47.
15 Barnes RD. Perceived freedom and control in the built environment. In: Harvey JH, Ed. Cognition, social behavior, and the environment. Hillsdale, NJ: Erlbaum, 1981: 409-22. 16 Becker FD. Quality of Work Environment (QWE): Effects on office workers. Prevention in
Human Services 1985-1986; 4(1-2):35-57.
17 Eklund NH, Boyce PR. The development of a reliable, valid, and simple office lighting survey. Journal of the Illuminating Engineering Society 1996; 25(2):25-40.
18 Veitch JA, Newsham GR. Exercised control, lighting choices, and energy use: An office simulation experiment. Journal of Environmental Psychology 2000; 20(3):219-37. 19 Mehrabian A, Russell JA. An approach to environmental psychology. Cambridge, MA:
The MIT Press, 1974.
20 Jones SJ. The effects of work and workplace control on employee satisfaction and performance [Unpublished Master's thesis]. Ottawa, ON: Carleton University, 1999. 21 Sundstrom E, Town JP, Rice RW, Osborn DP, Brill M. Office noise, satisfaction, and
performance. Environment and Behavior 1994; 26(2):195-222.
Ltd, 1987.
23 Feather NT. The study of persistence. Psychological Bulletin 1962; 59:94-115.
24 Newsham GR, Veitch JA, Scovil CY. Conveyor belt task: Software to test user reaction time using targets on a simulated conveyor belt. Ottawa, ON: National Research Council Canada, Institute for Research in Construction, 1995; IRC-IR-702.
25 Newsham GR, Veitch JA, Scovil CY. Typing task: Software to measure the speed and accuracy with which presented text is typed. Ottawa, ON: National Research Council Canada, Institute for Research in Construction, 1995; IRC-IR-700.
26 Boyce PR, Eklund NH. An evaluation of office lighting options. In. Proceedings of the Illuminating Engineering Society Annual Conference, Cleveland, OH, August 5-7, 1996. New York: IESNA, 1996.
27 Baron RA. Environmentally induced positive affect: Its impact on self-efficacy, task performance, negotiation, and conflict. Journal of Applied Social Psychology 1990; 20(5):368-84.
28 Kilmann RH, Thomas KW. Developing a forced-choice measure of conflict-handling behavior: The "MODE" instrument. Educational and Psychological Measurement 1977; 37(2):309-25.
29 Amick B, Robertson M, Derango K et al. An overview of a longitudinal
quasi-experimental field study to evaluate the effects of an office ergonomics training and a new chair on quality of work life, health and productivity. In: Luczak H, Cakir AE, Cakir G, Eds. WWDU 2002 - World Wide Work. Proceedings of the 6th International Scientific Conference on Work with Display Units. Berlin: ERGONOMIC Institut fur Arbeits- und Sozialforschung, Forschungsgesellschaft mbH, 2002: 365-7.
30 Boyce PR, Eklund NH, Simpson SN. Individual lighting control: Task performance, mood, and illuminance. Journal of the Illuminating Engineering Society 2000; 29(1):131-42. 31 Newsham G, Veitch J, Arsenault C, Duval C. Effect of dimming control on office worker
satisfaction and performance. In Proceedings of the IESNA Annual Conference, Tampa, FL, July 26-28, 2004 . New York: IESNA, 2004: 19-41.
32 Boyce PR, Rea MS. Lighting and human performance II: Beyond visibility models toward a unified human factors approach to performance. Palo Alto, CA: EPRI; Rosslyn, VA: National Electrical Manufacturers Association; Washington, DC: U.S. Environmental Protection Agency Office of Air and Radiation, 2001; 1006415.
33 Veitch JA. Lighting quality contributions from biopsychological processes. Journal of the Illuminating Engineering Society 2001; 30(1):3-16.
34 Veitch JA. Psychological processes influencing lighting quality. Journal of the Illuminating Engineering Society 2001; 30(1):124-40.
35 Houser KW, Tiller DK, Bernecker CA, Mistrick RG. The subjective response to linear fluorescent direct/indirect lighting systems. Lighting Research and Technology 2002; 34(3):243-64.
36 Veitch JA, Newsham GR. Exercised control, lighting choices, and energy use: An office simulation experiment. Journal of Environmental Psychology 2000; 20:219-37.
37 Veitch JA, Newsham GR, Boyce PR. Lighting quality appraisal effects on mood and well-being. Manuscript in Preparation 2004.
38 Boyce PR, Veitch JA, Newsham GR et al. Switching and dimming behaviour in offices. Manuscript in Preparation 2004.
Journal of Occupational Health Psychology 1996; 1(3):330-44.
40 Veitch JA, Farley KMJ, Newsham GR. Environmental satisfaction in open-plan
environments: 1. Scale validation and method . Ottawa, ON: National Research Council Canada, Institute for Research in Construction, 2002; IRC-IR-844.
41 Wells MM. Office clutter or meaningful personal displays: The role of office
personalization in employee and organizational well-being. Journal of Environmental Psychology 2000; 20(3):239-55
6. Acknowledgements
This investigation was supported by the Light Right Consortium, managed by Pacific Northwest National Laboratory, through contracts to Rensselaer Polytechnic Institute’s Lighting Research Center and the National Research Council of Canada’s Institute for Research in
Construction. This phase of the Light Right Consortium was supported by the Alliance to Save Energy, the Illuminating Engineering Society of North America, the International Association of Lighting Designers, the International Facility Management Association, Johnson Controls, the National Electrical Manufacturers Association, the New York State Energy Research and Development Authority, Steelcase, Inc., the US Department of Energy, and the US
Environmental Protection Agency. The Light Right Consortium and the researchers gratefully acknowledge the contributions of lighting equipment provided by Birchwood Lighting, Cooper Lighting, Day-Brite Lighting, Engineered Lighting Products, General Electric Lighting, Ledalite Architectural Products, Lightolier, Lutron, Osram Sylvania, Peerless Lighting, and Philips Lighting. Furnishings were provided by Armstrong World Industries Inc. and Steelcase, Inc.
The researchers would like to thank James Benya (Benya Lighting Design), Naomi Miller (Naomi Miller Lighting Design), Leslie Nicholls (PNNL), and Michael White (Johnson Controls) for their contributions to the project. Other staff at the National Research Council of Canada - Institute for Research in Construction who contributed to this project were Chantal Arsenault, Roger Marchand, and Clinton Marquardt. The researchers are grateful to staff from NRC's Institute for Information Technology who assisted with the development of cognitive performance tasks: Berry De Bruijn, Alain Désilets, Joel Martin, and Peter Turney. At the Lighting Research Center, Martin Overington and Owen Howlett also contributed.
Table 1. Reflectances of surface finishes
Surface Material Colour Reflectance
Ceiling acoustic tile flat white 0.88
Walls painted plasterboard flat white 0.73
Floor carpet grey 0.20
Work Surface / Storage painted metal grey 0.52
Chair Seat fabric blue 0.11
Chair Body plastic black 0.04
Cubicle Panel - Light fabric grey 0.30
Cubicle Panel - Dark fabric blue 0.05
Table 2. Experiment 1 schematic experimental design with achieved sample sizes.
Base Case 1 Best Practice 1 Best Practice 1 with Switching Control Dimming Control Light Panel N = 27 N = 25 N = 17 N = 33 Dark Panel N = 24 N = 16 N = 16 N = 23 Between-Groups
Design N = 181, randomly assigned to the 8 conditions.
Same panel reflectance for both occasions: N = 26 from Dimming Control N = 19 from Base Case 1 Repeated Measures Design
N = 45, each participant participating twice.
Note. Although more participants in the repeated measures design saw Dimming Control first, the distribution is not significantly skewed, and the design may be considered to be
counterbalanced (χ2
Table 3. Characteristics of lighting installations in both experiments.
Experiment 1 Experiment 2
Base Case 1 Best Practice 1 Best Practice + Switching
Control
Dimming Control
Base Case 2 Best Practice 2
Cubicle Area Luminaire 3-lamp, 18-cell, 76 mm deep, semi-specular, recessed, parabolic-louvered continuous suspended direct / indirect, 400 mm below ceiling same as Best Practice 1 1200 mm, 3 lamp suspended direct / indirect, 1 lamp indirect, 2 lamps direct 3-lamp, recessed, prismatic lenses Same as Best Practice 1, but dimmed to 400 lx
Layout regular array 5 rows
co-ordinated to furnishings & architecture same as Best Practice 1 centred on workstation Same as Base Case 1 Same as Best Practice 1 Lamp 32W T8, CCT=3500 K, CRI=82 1200 mm, 54W, T5 HO, CCT =3,500K, CRI = 85 same as Best Practice 1 1200 mm, 54W, T5 HO, CCT =3,500K, CRI = 85 Same as Base Case 1 Same as Best Practice 1 Ballast electronic dimming electronic dimming electronic dimming electronic dimming Same as Base Case 1 Same as Best Practice 1 Switchable Desk Lamp - - luminous shade, 40W 2D CFL (CCT = 3,500K and CRI = 82) switchable to 0W, 13W, 26W and 37W levels - - -