Publisher’s version / Version de l'éditeur:
Vous avez des questions? Nous pouvons vous aider. Pour communiquer directement avec un auteur, consultez la Questions? Contact the NRC Publications Archive team at
PublicationsArchive-ArchivesPublications@nrc-cnrc.gc.ca. If you wish to email the authors directly, please see the first page of the publication for their contact information.
https://publications-cnrc.canada.ca/fra/droits
L’accès à ce site Web et l’utilisation de son contenu sont assujettis aux conditions présentées dans le site LISEZ CES CONDITIONS ATTENTIVEMENT AVANT D’UTILISER CE SITE WEB.
Laboratory Technical Report (National Research Council of Canada. Aerospace.
Aerodynamics Laboratory); no. LTR-AL-2014-0012, 2015-06-09
READ THESE TERMS AND CONDITIONS CAREFULLY BEFORE USING THIS WEBSITE.
https://nrc-publications.canada.ca/eng/copyright
NRC Publications Archive Record / Notice des Archives des publications du CNRC :
https://nrc-publications.canada.ca/eng/view/object/?id=ff65a068-0834-41c6-8223-bedc411bfda6 https://publications-cnrc.canada.ca/fra/voir/objet/?id=ff65a068-0834-41c6-8223-bedc411bfda6
For the publisher’s version, please access the DOI link below./ Pour consulter la version de l’éditeur, utilisez le lien DOI ci-dessous.
https://doi.org/10.4224/23000249
Access and use of this website and the material on it are subject to the Terms and Conditions set forth at
Progress toward assessing the potential for the accumulation and
shedding of ice and snow for a boat-tail equipped HDV
Progress Toward Assessing the Potential for the
Accumulation and Shedding of Ice and Snow
for a Boat-Tail Equipped HDV
Progress Toward Assessing the Potential for the
Accumulation and Shedding of Ice and Snow
for a Boat-Tail Equipped HDV
Report No.: LTR-AL-2014-0012 Date: June 9, 2015
Authors: Brian R. McAuliffe
Classification: Unclassified Distribution: Limited
For: ecoTECHNOLOGY for Vehicles
Stewardship and Sustainable Transportation Programs Transport Canada
Project #: A1-001142
Submitted by: Dr. Steven J. Zan, Director R & D, Aerodynamics
Approved by: Jerzy Komorowski, General Manager, NRC Aerospace
Pages: 36 Copy No:
Figures: 17 Tables: 3
This report may not be published wholly or in part without the written consent of the National Research Council Canada
Disclaimer
This report reflects the views of the authors only and does not reflect the views or policies of Transport Canada.
Neither Transport Canada, nor its employees, makes any warranty, express or implied, or assumes any legal liability or responsibility for the accuracy or completeness of any information contained in this report, or process described herein, and assumes no responsibility for anyone’s use of the information. Transport Canada is not responsible for errors or omissions in this report and makes no representations as to the accuracy or completeness of the information.
Transport Canada does not endorse products or companies. Reference in this report to any specific commercial products, process, or service by trade name, trademark, manufacturer, or otherwise, does not constitute or imply its endorsement, recommendation, or favoring by Transport Canada and shall not be used for advertising or service endorsement purposes. Trade or company names appear in this report only because they are essential to the objectives of the report.
References and hyperlinks to external web sites do not constitute endorsement by Transport Canada of the linked web sites, or the information, products or services contained therein. Transport Canada does not exercise any editorial control over the information you may find at these locations.
Executive Summary
Through its ecoTECHNOLOGY for Vehicles II (eTV II) program, Transport Canada has com-missioned a study to investigate the potential safety implications of using boat-tails to reduce fuel consumption and greenhouse-gas emissions from heavy-duty vehicles (HDVs) on Cana-dian roads. A concern has been raised regarding the possibility for ice and snow to accumulate and shed from the cavity of a boat-tail, posing a potential safety hazard for other road users. This report describes a preliminary evaluation for the potential for ice and snow accumulation in the cavity of a boat-tail-equipped HDV.
A 2012 report to Transport Canada, prepared by the National Research Council Canada (NRC), identified no relevant scientific literature on the topic of ice or snow accumulation in cavities at the rear of a ground vehicle. The report identified that on-road observations, wind tun-nel testing, or computational fluid dynamics (CFD) simulations are three possible approaches to investigate the problem. A computational-simulation-based approach was selected for the work presented herein based on its ability to provide repeatable results and a parametric ap-proach to the investigation.
To adequately capture the transient unsteady nature of the flow-field in the base region of a heavy duty vehicle, a time-dependent high-fidelity CFD approach was selected for the project using the commercial PowerFLOW software, based on a Lattice-Boltzmann simulation envi-ronment. A simplified model of a day-cab tractor with a 53 ft dry-van trailer was used with different configurations for the trailer base and underbody. Transient-flow simulations were performed for five cases, each representing 100 km/h road speed. These cases represented different combinations of base configuration, trailer underbody roughness, and yaw angle of the wind relative to the vehicle (0◦or 8◦). Two boat-tail configurations were examined: a 4 ft 3-panel boat-tail, and a 4 ft 4-panel boat-tail. For each simulation, 5.5 seconds of real-world time were simulated, with transient flow fields saved and used for analysis at a rate of 100 Hz. Results of the CFD simulations provided evidence of the manner in which boat-tails modify the flow field surrounding an HDV. In the near wake region, the flow is sucked upwards towards the base, but with a lower wind speed for the boat-tail cases than for the baseline (no
or freezing rain to occur. A literature survey identified that the precipitation of interest for the phenomena of snow build-up in the base region of a vehicle is that which is kicked-up by the tires, and that these particles are smaller than typical snow flakes. As an initial investigation into the potential for ice and snow accumulation in the base region of the vehicle, a range of potential particle properties (size, density, drag) were investigated using the averaged flow-field from each simulation. Particles were emitted from a vertical plane located immediately downwind of the trailer wheels, and oriented perpendicular to the direction of vehicle motion, as this was found to be the only region of flow from which the particles can become entrained in the vehicle wake. It was found that small and light particles are lifted into the wake but do not impinge on the surface of the HDV. Conversely, none of the larger and heavier particles are lifted into the wake. For the range of particle properties examined, those that showed the po-tential for impingement on the base of the HDV exhibited drag-to-weight ratios on the order of 200. A corresponding set of particle properties that represent the size of particles found in the wakes of vehicles on Canadian roads (as identified by the literature survey) were selected for use in a quasi-static particle-tracking analysis that provides the same long-term particle impingement patterns as would a temporally-resolved transient simulation.
Results of the quasi-static particle tracking analyses showed that the greatest numbers of par-ticles impinge on the base of the HDV for the no-boat-tail case, concentrated on the upper surface of the back face of the trailer. The 3-panel boat-tail provides the lowest level of particle impingement. Adding the fourth, lower panel to the boat-tail provides an added surface on which snow particles impinge and can accumulate. This lower horizontal panel provides the greatest concern for potential snow build up, and a rudimentary estimate shows the potential for 4 kg of snow to accumulate per hour on this surface.
The identification of sufficient accumulation of snow on a boat-tail lower surface was based on assumptions regarding the particle properties kicked-up behind HDVs. It is not clear whether the conditions evaluated, which represent a worst case condition, are prevalent on Canadian roads during the winter. It is advisable that on-road observations be performed during var-ious adverse winter conditions for a 4-panel boat-tail to identify the true potential for snow accumulation. It is also recommended that the effect of side-skirts on the potential snow accu-mulation in a boat-tail be evaluated.
Table of Contents
Executive Summary . . . vii
List of Figures . . . x
List of Tables . . . x
Nomenclature . . . xi
1. Introduction 1 1.1 Background . . . 1
1.2 Project Objectives and Outcomes . . . 2
1.3 Previous Work and Current Approach . . . 2
2. Computational Setup and Procedures 5 2.1 Simulation Software . . . 5
2.2 HDV Model and Computational Domain . . . 6
2.3 Domain Discretization and Boundary Conditions . . . 8
2.4 Simulation Time and Convergence . . . 9
2.5 Approach for Unsteady Snow and Ice Simulation . . . 9
2.6 Simulation Cases . . . 11
3. Analysis and Results 13 3.1 Influence of Boat-Tails on the Wake Structure . . . 13
3.2 Selection of Snow and Ice Properties . . . 16
List of Figures
2.1 Simplified HDV model for simulations . . . 6
2.2 3-sided boat-tail configuration . . . 7
2.3 4-sided boat-tail configuration . . . 7
2.4 Simplified HDV model with rough trailer underbody . . . 8
2.5 Discretized voxel mesh surrounding model . . . 9
3.1 Mean wind speed and streamlines at HDV centreline for Case 1 through 4 . . . 14
3.2 Mean wind speed and streamlines at a height of 0.5 m for Case 1 through 5 . . 15
3.3 Particle emitter plane . . . 17
3.4 Sample particle traces in time-averaged flow-field for Cases 1 through 4 - Over-head View . . . 20
3.5 Sample particle traces in time-averaged flow-field for Cases 1 through 4 - Side View . . . 21
3.6 Sample particle traces in unsteady flow-field for Cases 1 through 5 . . . 23
3.7 Hit point distributions from quasi-static analysis for Cases 1 through 5 . . . 24
A.1 Particle traces in time-averaged flow-field for Case 1 . . . 32
A.2 Particle traces in time-averaged flow-field for Case 2 . . . 33
A.3 Particle traces in time-averaged flow-field for Case 3 . . . 34
A.4 Particle traces in time-averaged flow-field for Case 4 . . . 35
A.5 Particle traces in time-averaged flow-field for Case 5 . . . 36
List of Tables
2.1 Simulation cases . . . 113.1 Hit-point accumulations based on time-averaged flow-fields . . . 18
Nomenclature
Symbols:
D particle diameter
ρ particle density
Acronyms:
CFD computational fluid dynamics DES detached eddy simulation eTV ecoTECHNOLOGY for Vehicles GHG greenhouse gas
HDV heavy duty vehicle LES large eddy simulation NRC National Research Council RNG re-normalized group theory TC Transport Canada
U-RANS unsteady Reynolds averaged Navier Stokes VLES very large eddy simulation
1. Introduction
1.1 Background
Transport Canada, through its ecoTECHNOLOGY for Vehicles (eTV) program, undertakes testing and evaluation of current and emerging vehicle technologies. The program will help inform various stake-holders that are engaged in the development of regulations, codes, stan-dards, and products for the next generation of advanced light and heavy-duty vehicles. The addition of a boat-tail to the base of a heavy-duty vehicle (HDV) has been shown to gen-erate a reduction in vehicle drag on the order of 5%, resulting in a corresponding reduction in fuel consumption per vehicle on the order of 3000 L/year (Patten et al., 2010). The term boat-tail refers to a kit of extension panels or fairings that are mounted to the rear of a trailer. The fuel savings is accomplished through streamlining of the rear of the vehicle, thus guiding the flow inwards towards the centre of the vehicle wake. This increases the average pressure on the aft end of the vehicle, providing a smaller pressure difference between the front and rear faces of the vehicle in the direction of motion, and hence a lower aerodynamic drag force. Transport Canada, through its eTV II program, is interested in investigating safety implica-tions of using boat-tail-equipped HDVs on Canadian roads. In a report prepared for Transport Canada in 2010 (Patten et al., 2010), and further emphasized in a report for Transport Canada’s eTV II program in 2012 (Patten et al., 2012), NRC identified that the use of boat-tails affects the flow-field behind a tractor trailer in a significant-enough manner that it warrants investigation into safety issues surrounding the implications to other road users. As such, in 2012 NRC pro-posed a project to study the safety implications associated with the potential accumulation of ice and snow for a boat-tail-equipped HDV. In the first year of the project, a review of possible methods to investigate this issue was performed. In this second year of the project, a first step towards investigating the potential for accumulation of ice and snow was performed, and is described in this report.
1.2 Project Objectives and Outcomes
The primary objective of the project is to evaluate safety implications associated with the use of boat-tails, in particular the possibility of ice and snow accumulating within the boat-tail, and subsequently shedding from the vehicle in the presence of following vehicles. The goal is to identify whether the use of boat-tails would pose greater safety concerns for vehicles travelling in the wake of a boat-tail-equipped HDV.
This project will support the following two eTV II program outcomes:
• Support the development of advanced vehicle technology safety outcomes: test results will provide Transport Canada (TC) with recommendations regarding safety implica-tions of using boat-tails on Canadian roads.
• Support for the development of non-regulatory codes and standards: test results provide quantitative guidance so that industry can optimize product development for Canadian conditions.
1.3 Previous Work and Current Approach
In the first year of the project (McAuliffe et al., 2013b), a preliminary study was undertaken to examine what, if anything, has been done to address the issues of snow and ice accumulating and shedding from the cavities of boat-tails.
A literature survey was undertaken. No relevant work on the issue of snow and ice accumula-tion and shedding from the back of an HDV was found. A boat-tail manufacturer has claimed there are no such issues, but the lack of boat-tail use in Canada precludes such conclusions from being adopted for Canadian-winter conditions. Snow and ice accumulation has been the focus of work related to aircraft, buildings and bridges, power-conductor cables, and engine ingestion for ground-vehicles.
Three approaches were identified for examining the problem of snow and ice for boat-tail-equipped HDVs:
1. On-road observations during a Canadian winter;
2. Experimental testing using a conventional or climatic wind tunnel with appropriate pre-cipitation simulation; and
3. Computational simulation using ice and snow accretion models.
Of these approaches, each was shown to have their benefits and drawbacks and likely a combi-nation of two or all three will provide an answer to the problem of snow and ice accumulation and shedding for boat-tail-equipped HDVs.
In this second year of the project, a first step towards identifying the potential for ice and snow accumulation and shedding has been performed using a computational simulation approach. This approach was selected, in contrast to its experimental counterparts listed above, because
it provides an efficient parametric approach for examining a variety of wind and precipita-tion properties that represent various ice and snow condiprecipita-tions. The uncertainty associated weather variability precludes the use of on-road tests to identify worst-case conditions. Con-versely, conventional or climatic wind-tunnel testing can provide a parametric approach to precipitation conditions, but at a much higher cost than a simulation approach.
In a previous report to Transport Canada regarding boat-tails (Patten et al., 2010), stagnation regions (areas with little or no air movement) were identified within the boat-tail cavity on an HDV based on computational fluid dynamics (CFD) simulations. These stagnation re-gions were identified as potential sites for precipitation accumulation. The simulations that provided these results were performed using steady-flow computations. While cost-effective for an initial study of the problem, steady-flow computations imply that the effects of wind fluctuations in the HDV wake are taken into account through models which simulate their influence on the mean wind patterns. Thus the flow-field predictions are incomplete, espe-cially for a bluff-body such as an HDV wake. Unsteady-flow computations that resolve the fluctuating nature of the winds will provide more accurate insight to the potential for ice and snow accumulation. For example, a stagnation region identified in a steady-flow simulation could be the result of strong unsteady wind patterns that change directions periodically and average, over time, to a net low-speed flow region. Under these circumstances, there may be a lower potential for precipitation accumulation than what was inferred by Patten et al. (2010). Conversely, modelling simplifications inherent to typical turbulence models for steady-flow simulations often do not predict the correct time-averaged flow-fields for large separated flow regions such as those at the back of an HDV, and therefore the presence, or lack, of stagnation regions in the wake of such a simulation has a high uncertainty.
Unsteady flow simulations for an HDV with and without a boat-tail have been performed to understand better the unsteady flow structure in the cavity of a boat-tail and whether there is a potential for snow and/or ice accumulation. Flow-field simulations were performed with the PowerFLOW CFD software, the unsteady results of which were used with a particle-tracking simulation environment to identify if and where particles impinge the surface. By quantifying the particle impingements over a given period of time, a measure of the potential accumulation of ice and/or snow on the back face of the trailer can be determined. The post-processing particle-tracking procedures were performed for different sets of particle properties (mass, size, drag) that, based on a literature survey, represent conditions encountered by HDVs on Canadian roads.
The problem definition and computational setup are described in Section 2 and the results of the analysis are presented in 3, with conclusions provided in Section 4.
2. Computational Setup and Procedures
2.1 Simulation Software
The current project required time-resolved unsteady flow-fields in the wake of an HDV, from which particle tracking algorithms can be used to predict the path of motion of simulated ice/snow particles. Experimental techniques for the measurement of such flow-fields are still in their infancy. Unsteady Computational Fluid Dynamics (CFD) approaches are most appro-priate for these purposes because they can provide the entire flow-field solution at a given instant in time, and track the evolution of the changing flow structures. Conventional CFD techniques based on solutions to the Navier-Stokes equations can provide such time depen-dent results, but strong consideration must be given to the level of turbulence modelling used. Unsteady Reynolds-Averaged Navier-Stokes solutions (U-RANS) can provide efficient solu-tions by simulating some of the large-scale unsteady structures in a given flowfield. However, in the wake of a ground vehicle, there is no distinct separation of scales between the large-scale unsteady wake motions and the smaller-large-scale turbulence in the flow, as required for ade-quate representation from U-RANS solutions. Direct Numerical Simulation (DNS) approaches will provide all spatial and temporal scales of the flow, down to the dissipation length scales smaller than the eye can see, but require supercomputers to solve simpler problems than the wake of an HDV. Between these extremes fall the Large-Eddy-Simulation (LES) and Detached-Eddy-Simulation (DES) techniques. LES provides higher resolution towards the DNS end of the spectrum, and DES makes use of some of the efficiencies of turbulence models from U-RANS approaches. Regardless of whether a DES or LES approach is most appropriate, each has a laborious process for discretizing the flow domain to ensure adequate spatial resolution in the flow area of interest.
In recent years, a new CFD method has emerged as an alternative to conventional CFD tech-niques, that has been found to provide the accuracy and fidelity required for bluff-body-type flows, but with a simpler and more efficient discretization strategy. Lattice Boltzmann meth-ods are based on a discrete form of kinetic theory that, on a statistical level, tracks the motion and collision of fluid particles within the discretized grid/lattice. The method conserves mass,
The PowerFLOW software provides a turbulence simulation based on the LES approach, here called Very Large Eddy Simulation (VLES), that is similar in fidelity to the DES approach for conventional CFD. Large-scale turbulent motions, on the order of the grid/lattice size or larger, are resolved directly. In a Lattice-Boltzmann environment, the grid/lattice volumes are called voxels. Sub-voxel sized turbulence is modelled through a conventional turbulence-modelling approach. The RNG k-ǫ turbulence model is implemented with adaptations for dynamically-adjusted length-scales and make use of wall functions to allow coarser grids in well-behaved near-wall regions of the boundary layers.
2.2 HDV Model and Computational Domain
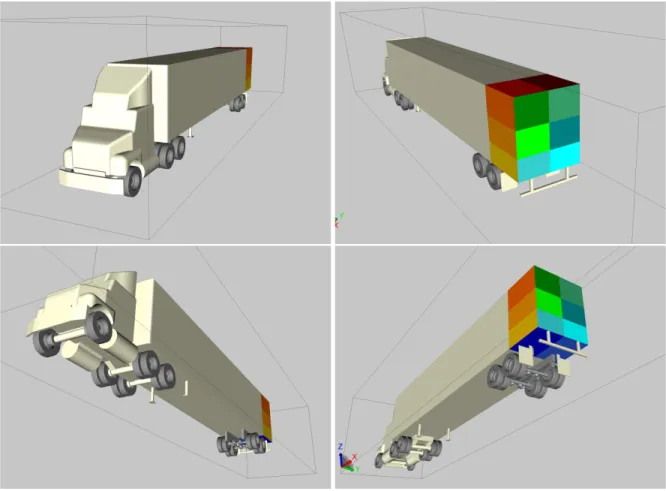
For the purposes of the current project, a simple but representative HDV model was required. In a previous study for Transport Canada regarding boat-tails (Patten et al., 2012), conven-tional steady-flow CFD was performed with a representation of the NRC 10%-scale HDV wind-tunnel model. This wind tunnel model has been used for another phase of the cur-rent project (McAuliffe, 2013a). The simplified HDV model is shown in Figure 2.1. The model
represents a day-cab tractor with only a roof fairing acting as an aerodynamic enhancement, matched to a 53 ft dry-van trailer. The tractor is a solid model, and therefore cooling flow was not represented in the model. The coloured surfaces on the aft end of the model show surfaces added for the purpose of quantifying particle impingement locations, described later.
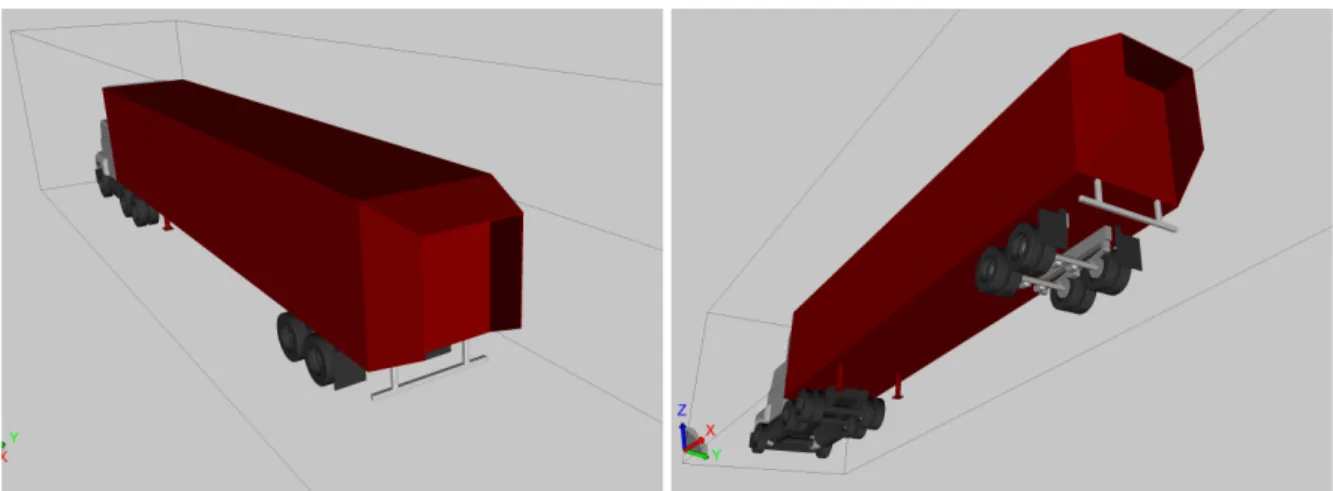
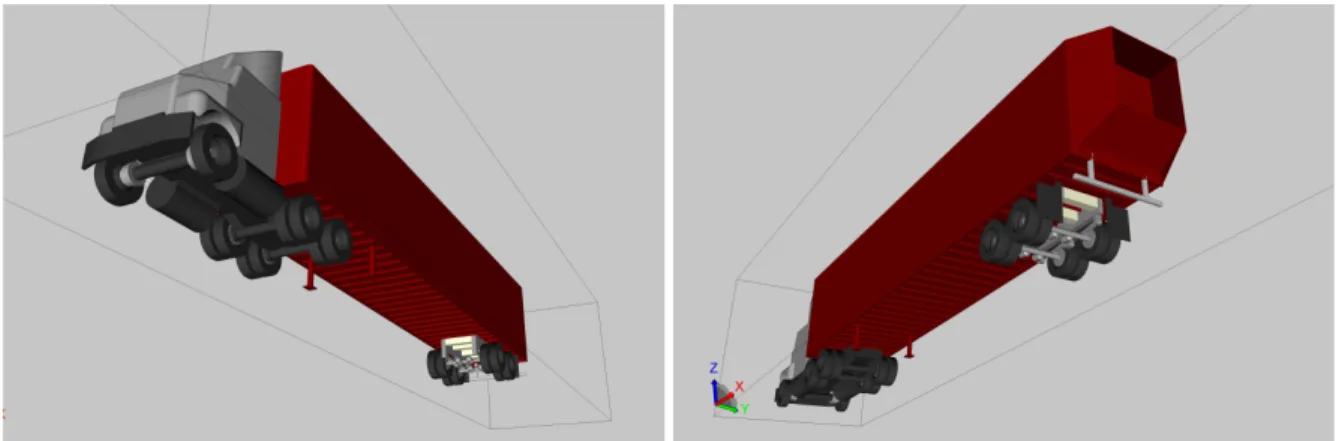
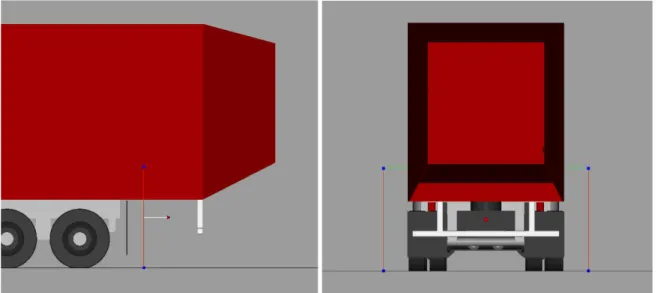
The model is 19.44 m (64.1 ft) long, 2.6 m (8.5 ft) wide, and 4.11 m (13.5 ft) tall. The flow domain used for the simulations was 169.0 m long, extending 45.7 m ahead of and 103.8 m behind the vehicle, 104.5 m wide, and 138.2 m high. These distances represent +2.4/-5.4 vehicle-lengths long,±19.6 vehicle-widths on either side, and 33.7 vehicle-heights high. These domain dimensions were based on best practices developed for HDV simulations with PowerFLOW. Two configurations of boat-tails were examined: a 3-panel (top + sides) and a 4-panel (top + sides + bottom). These boat-tail configurations are shown in Figures 2.2 and 2.3, respectively. These boat-tails have an extension from the back face of the trailer of 1.22 m (4 ft) with a inward taper angle of 15◦. The lower panel of the 4-panel boat-tail is vertically offset by 0.30 m
(1 ft) and also has a taper angle of 15◦. This offset panel is similar to some commercial boat-tail
Figure 2.4:Simplified HDV model with rough trailer underbody concepts, as well as some concepts developed by NRC in the past.
A second version of the model with a representative trailer underbody was used for some of the simulations. A rough underbody was added to the trailer to represent better the resistance to flow that can affect the wake. The rough underbody is shown in Figure 2.4, and includes thin and shallow lateral ribs on the lower surface of the trailer and thick lateral ribs in the space between the suspension components of the trailer bogie.
2.3 Domain Discretization and Boundary Conditions
Spatial discretization of the computational domain is based on the smallest specified voxel size of 6 mm, which was specified in regions of high curvature around the tractor model. For regions requiring a lower voxel density, generally at greater distances from the model surfaces, the voxel density is coarsened. The nature of the regular rectilinear voxel structure provides a doubling of the voxel width with each level of coarsening. Figure 2.5 shows the voxel distributions at the centreline and mid-height of the HDV model. In the region of interest for the current study, that being the near-wake region at the base of the HDV, the voxel size is 12 mm. The voxel count for the zero-cross wind cases was 67×106and that for the cross-wind case was 95×106(see Section 2.6 for description of cases).
The boundary conditions were specified as follows:
• Inlet Plane: wind speed of 27.8 m/s (100 km/h) in model longitudinal axis direction; • Outlet Plane: static pressure, free flow direction;
• Ground Plane: speed relative to model longitudinal axis of 27.8 m/s (100 km/h); • Top Plane: frictionless wall;
• Side Walls: frictionless wall;
Figure 2.5:Discretized voxel mesh surrounding model
• HDV model wheels: rotating surface conditions (54.72 rad/s) with 2 mm surface rough-ness.
2.4 Simulation Time and Convergence
Based on the flow speeds and minimum voxel size, a time step for the simulation of 2.53×10⁻⁵s was used. The flow-field took approximately 0.5 s of real time (20,000 time steps) to eliminate any non-physical transients associated with the initial conditions. A subset of the flow-field was sampled to provide flow-field data at a rate of 200 Hz over a period of 5.5 s (1100 sam-ple flow-fields). For the detailed analysis, every second flow-field was used, representing a 100 Hz sampling rate. Vehicle soiling studies using PowerFLOW have shown 100 Hz to be sufficient to capture the dynamic motions of water and mud particles in the flow (Gaylard and Duncan, 2011; Jilesen et al., 2013). In addition, the flow-field averaged over the 5.5 seconds was calculated and saved.
• The algorithm assumes that particles are solid spheres that do not collide, combine, or break-up.
• A fourth-order Runge-Kutta integration scheme is used to solve the equations of motion of each particle.
• The drag-coefficient is defined by an empirical equation that matches measurements for smooth spheres up to a Reynolds number of approximately 3×10⁵.
The PowerVIZ particle-tracking setup provides different options for evaluating the trajectories of particles in the domain, given a velocity field. Emitter regions must be specified as boxes of specified height, width, length, and location from which particles will be released into the flow-field. From these regions, the two options are available for the emission and tracking of particles:
1. Static Particle Tracking: Particle emission locations are specified within the emitter re-gion by specifying the number of emission locations in each coordinate direction, spaced evenly. Particles are assumed to be aligned with the flow direction and emitted at the local flow speed. The specified particle properties are used to determine the particle path/trace in space for each emission point. This method provides a solution time on the order of seconds to calculate the particle traces.
2. Dynamic Particle Tracking: A time-dependent simulation is performed in which par-ticles are released randomly in space and time within the emitter region. The temporal evolution of each particle location is tracked. This option also provides the ability to vary stochastically the particle properties and their emission velocities during the simulation, providing results that better predict the random nature of particle distributions.
The solution to both options is a set of particle traces and a set of surface hit points.
These two options assume a single flow-field. The purpose of the current project is to evaluate the variability in snow/ice accumulation from the unsteady flow environment. The dynamic particle tracking algorithm can be used such that the flow-field is updated during the particle-tracking integration to reflect the actual time-varying nature of the particle paths, and therefore provide a time history of surface hit points from which a time-averaged distribution of hit points can be calculated. Conversely, the static particle tracking option can be performed for each time step of the solution data, and subsequently compiled under the assumption that this quasi-static approach provides the correct long-term distribution of surface hit points as would the dynamic simulation. Gaylard and Duncan (2011) showed that this quasi-static approach reproduced well the soiling patterns on sedan and SUV passenger vehicles.
For a given number of emitted particles, the dynamic-particle-tracking analysis requires a lengthier solution time than does the static particle tracking analysis. To obtain a sufficient particle hit-point distribution, simulation times on the order of two days would be required, using a high-performance desktop computer. The static particle tracking approach provides quasi-steady hit-point distributions in a time period on the order of 5 hours using the same data set. The major proportion of these simulation times result from reading into memory each subsequent time step.
Based on the ability of the quasi-static approach to reproduce soiling patterns on passenger ve-hicles, combined with the shorter simulation times, this quasi-static particle tracking approach was used in the current study for the unsteady-flow analyses.
2.6 Simulation Cases
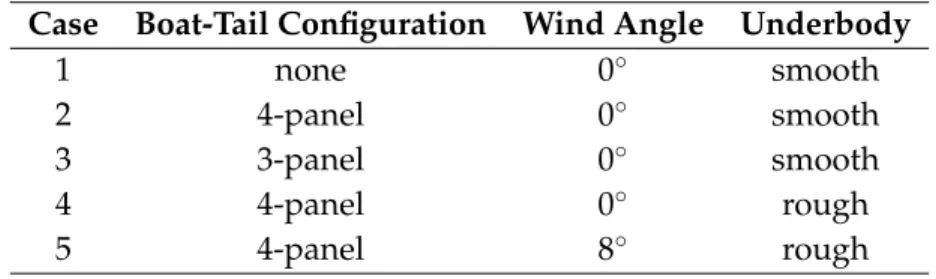
Due to the cost associated with PowerFLOW simulations, a limited number of cases could be performed to evaluate the potential for ice/snow accumulation on a boat-tail-equipped HDV. Five simulation cases were performed as listed in Table 2.1. The first three cases provide three configurations for the aft end of the trailer. Comparison of Cases 1, 2, and 3 provides a relative measure of the potential accumulation with and without boat-tails. Comparison of Cases 2 and 4 provides a relative measure of the difference between underbody roughness levels. Comparison of Cases 4 and 5 provides a relative measured of the effect of wind angle.
Table 2.1:Simulation cases
Case Boat-Tail Configuration Wind Angle Underbody
1 none 0◦ smooth
2 4-panel 0◦ smooth
3 3-panel 0◦ smooth
4 4-panel 0◦ rough
3. Analysis and Results
3.1 Influence of Boat-Tails on the Wake Structure
The current project was initiated based on steady-state CFD results that showed significant modifications to the structure of the wake behind an HDV when equipped with a boat-tail. Scale-model wind-tunnel results from another phase of the current project identified trends in the dynamic wake properties due to the addition of a boat-tail, and showed an amplification in the strength of the vortex-shedding phenomenon in the wake when a boat-tail is added (McAuliffe, 2013a). The wind tunnel tests were performed at 10% scale, in a fixed-floor wind tunnel with stationary wheels. The model scaling is not expected to affect the results between real-world and the wind tunnel, however it was unclear whether the different ground/wheel conditions would impact the wake structure. The current simulations provide additional data from which these effects can be evaluated to some extent. The current analysis provides a qualitative comparison of the simulation results with each other and with the wind tunnel measurements of McAuliffe (2013a).
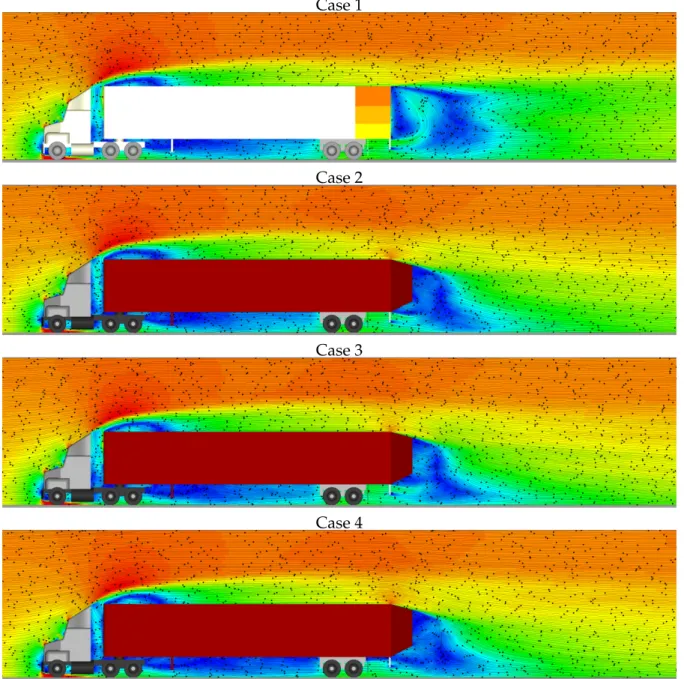
Figure 3.1 shows the mean wind speed patterns at vehicle centreline for Cases 1 through 4. As noted in McAuliffe (2013a), and reflected in the current data set, the boat-tail directs the flow at the base of the vehicle towards the ground, as evident from the greater downward angle of the streamlines in the wake after about 1 vehicle height from the base. In the near wake region, within about 1 vehicle height from the base, flow is directed upwards towards the base, but with a lower wind speed (darker blue for boat-tail cases). The three boat-tail cases show similar flow patterns in the near wake, with slight differences in the shape, strength and location of the vortex (rotating flow) below the boat-tail and immediately downwind of the crash guard. The 4-panel configurations (Cases 2 and 4) show this vortex situated well below the boat-tail, whereas the 3-panel boat-tail configuration (Case 3) shows the vortex situated higher and within the boat-tail cavity. The 3-panel case also shows higher wind speeds for the flow entering the boat-tail cavity. Not shown here is that the flow that enters the boat-tail at centreline exits towards the sides. The rough underbody case (Case 4) shows lower wind speed below the trailer and in the near wake below the boat-tail, with the core of the vortex
Case 1
Case 2
Case 3
Case 4
Figure 3.1:Mean wind speed and streamlines at HDV centreline for Case 1 through 4 (blue -low speed, red - high speed)
the wind tunnel simulation do not have any significant effect on the differences in the wake structure between boat-tail and non-boat-tail configurations. The cross-wind case (Case 5) shows high-speed wind impinging on the trailer wheel set with relatively high speed air mov-ing through the centre of the wheel bogie assembly. The vehicle wake is much larger for the cross-wind condition.
Case 1
Case 2
Case 3
Case 4
3.2 Selection of Snow and Ice Properties
The initial step to understand the potential for the accumulation and shedding of ice and snow was to identify the snow and ice properties of importance. Takamura and Saito (2008) performed an on-road investigation over Canadian roads to examine the properties of snow of importance for modelling the ingress of snow in air intake systems. Their study described, based on a literature survey, typical sets of snow properties that fall from the sky, and subse-quently showed that the properties of snow experienced by vehicles on the road are different from what is generated in the atmosphere and settles on the ground. They noted that the snow of importance for road vehicles is primarily that which has been kicked-up by other vehicles. Typical falling snow will have flake/particle diameters on the order of 1.5 to 4 mm and densi-ties (assuming solid spherical shapes) on the order of 2 to 12 kg/m3. Through measurements of the size and number of particles, Takamura and Saito (2008) measured distributions of par-ticle sizes and found mean diameters on the order of 0.1 to 0.2 mm with only a small fraction exceeding 0.5 mm. No explanation was given as to why the particles were smaller but a hy-pothesis is that the mechanical process that kicks-up the snow causes the particles to break up into smaller particles. Takamura and Saito (2008) did not perform any measurement of the mass or density of the snow particles. The values they provide (noted above) are reproduced from previous work.
For the purpose of the current study, the Takamura and Saito (2008) study and its literature review was used as the basis for defining the particle properties to use in the particle tracking simulations. It has been assumed that snow is the more prevalent type of precipitation to encounter for the problem of accumulation at the aft end of an HDV. Under conditions of ice falling from the sky (hail or sleet), vehicles will not be travelling at a sufficient speed for a long enough period of time to worry about such precipitation being kicked-up and accumulating in a boat-tail. The same argument is made regarding freezing rain. Other safety concerns would prevent HDVs from travelling at sufficient speeds for any accumulation of ice or freezing rain to occur. However, HDVs regularly travel at highway speeds on Canadian roads in snowy conditions.
Due to the large range of possible particle properties, from falling snow or kicked-up snow, combined with the lengthy particle-tracking simulation times using the unsteady flow-fields (order of 5 hours each), a preliminary analysis was performed using the time-averaged flow-fields to identify specific particle properties of greatest concern for the accumulation of ice or snow in boat-tail cavities. For each of the 5 simulation cases, 15 steady-flow particle-tracking analyses were performed. These consisted of combinations of five particle diameters (0.2, 0.5, 1.0, 2.5, and 4.0 mm) and three particle densities (10, 50, and 100 kg/m3). The PowerVIZ Particle Tracking algorithm was problematic for low particle densities below 10 kg/m3 and some diameters below 1 mm, due to large numbers of particle remaining in the flow-field without impingement, thus creating increased memory requirements during the simulations. For these conditions, the software would either crash during the particle-tracking simulation, or it would crash while attempting to export the particle-trace images. Although densities of 50 and 100 kg/m3are high relative to typical densities of snow from the sky, they may be representative of the densities of particles kicked-up behind vehicles. Such kicked-up particles may have higher densities because they no longer have their dendritic forms and have broken
Figure 3.3:Particle emitter plane (blue dots at corners)
up into their constituent solid parts. Some may be compacted and melted and refrozen or partially re-frozen during this process as well, changing the particle densities and sizes. A density of 100 kg/m3is also an order of magnitude below that of solid ice, which has a density of approximately 920 kg/m3, and is therefore still representative of ice crystals that are not completely solid.
Initial checks with both the time-averaged and unsteady flow-fields showed that, with and without a boat-tail, particles that have the possibility of impinging on the back face of the HDV or inside the boat-tail emanate from below the vehicle. Particles adjacent to the sides and the top of the vehicle have sufficiently high momentum that they do not become entrained in the near wake at the base of the vehicle. Therefore, to simplify the simulations and reduce the simulation times, a single emitter plane was placed below the trailer 1 m upwind of the trailer base, as shown in Figure 3.3. The plane was 3.4 m wide and 1.7 m high. Particles were released at the emitter plane from an array of points 50 wide and 25 high. After neglecting the point locations inside the solid geometry, a total of 946 equally-spaced particles were released during each simulation.
For the purpose of evaluating the potential for particle impingement and accumulation asso-ciated with boat-tails, particle hit points were summed only for the aft face of the trailer and the surfaces of the boat-tails. The outward facing surface of the side and top panels of the
Table 3.1:Hit-point accumulations based on time-averaged flow-fields, from 946 emitted par-ticles ‐ Case 1: No Boat‐Tail ‐ Smooth Underbody ‐ 0deg 2 highest hit‐point counts for case Diameter [mm] 0.2 0.5 1.0 2.5 4.0 other conditions with hitpoints 10 5 1 1 0 0 potential candidates 50 2 0 0 0 0 selected condition 100 0 1 0 0 0 Case 2: 4‐Panel Boat‐Tail ‐ Smooth Underbody ‐ 0deg 0 2 0 5 1 0 2 5 4 0 Dens ity [kh/m3] Diameter [mm] 0.2 0.5 1.0 2.5 4.0 10 0 5 9 7 10 50 2 9 8 0 0 100 7 9 3 0 0 Case 3: 3‐Panel Boat‐Tail ‐ Smooth Underbody ‐ 0deg 0.2 0.5 1.0 2.5 4.0 Dens ity [kh/m3] Diameter [mm] 0.2 0.5 1.0 2.5 4.0 10 0 0 0 0 0 50 0 0 0 0 0 100 0 0 0 0 0 Case 4: 4‐Panel Boat‐Tail ‐ Rough Underbody ‐ 0deg 0.2 0.5 1.0 2.5 4.0 Dens ity [kh/m3] Diameter [mm] 10 2 2 2 5 0 50 1 2 7 0 0 100 3 7 0 0 0 Case 5: 4‐Panel Boat‐Tail ‐ Rough Underbody ‐ 8deg 0.2 0.5 1.0 2.5 4.0 10 2 5 9 17 24 Diameter [mm] Dens ity [kh/m3] y ] 10 2 5 9 17 24 50 3 12 12 0 0 100 9 19 21 0 0 Dens ity [kh/m3]
highlighted conditions represent all others for which hit points were detected. It is evident that only a small number of the 946 particles impinge on the aft surfaces of the vehicle us-ing the time-averaged flow-fields, with or without a boat-tail. The baseline vehicle without a boat-tail shows some hit points for small and light particles. No hit points were found for the 3-panel boat-tail. In general, Table 3.1 shows that the largest number of hit points for the 4-panel boat-tail occurs for smaller heavier particles and for larger lighter particles. Particle-trace images for most of the conditions of Table 3.1 are shown in Appendix A, except for those for which the PowerVIZ software crashed during the image export process.
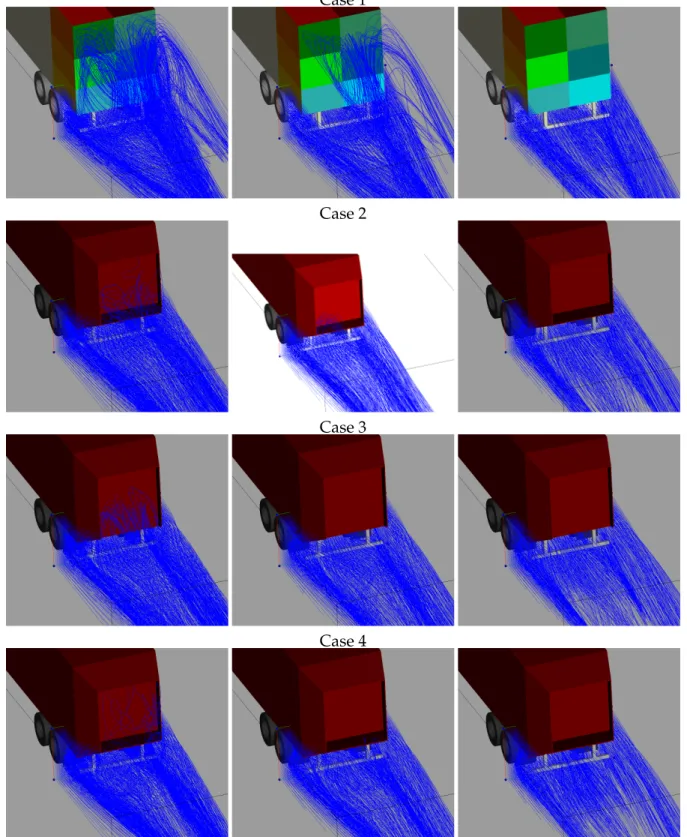
The dashed boxes in Table 3.1 represent a set of conditions that were identified as potential candidates for the detailed analysis. These candidate sets of properties are representative of the highest number of hit points for the 4-panel boat-tail configurations. Although the non-boat-tail and 3-panel non-boat-tail cases do not show significant hit points for these cases, the behaviour of the particles in the flow fields for these cases show the same trends as with the 4-panel boat-tails. Figures 3.4 and 3.5 show the particle traces for Cases 1 through 4 for three sets of particle properties. Figure 3.4 shows a downward view into the wake, and Figure 3.5 shows a side view. The non-boat-tail case shows the greatest number of particles lifted in to the wake, at least for particle properties in the left and middle columns, however these conditions do not result in significant particle impingements. The exposed nature of the flow adjacent to the base ensures that higher wind speeds carry the particles away from the surface. The low wind speeds in the boat-tail cavities provide an environment where the momentum of the particles overcomes the wind forces and the particles impinge on the surface. None of the cases show the large heavy particles (right column) lifted into the wake. The manner in which the boat-tail changes the flow patterns in the near wake, by directing the mean flow downwards instead of upwards, reduces the potential for particle to be lifted into the wake. Of note is that particles in the wake of the 3-panel boat-tail are not lifted as high in the boat-tail cavity as they are for the 4-panel boat-tail, likely a result of the modified wake as identified earlier in Section 3.1.
By comparing the numbers of hit points in Table 3.1 with the particle traces in Appendix A, it appears that sufficient numbers of small and light particles are lifted into the wake but do not impinge on the surface. Conversely, none of the larger and heavier particles are lifted into the wake. For the particle properties examined, a calculation of the ratio of drag force on each particle (assuming a representative wind speed in the wake of half of the vehicle speed) to its weight reveals that the conditions with the greatest impingement for the 4-panel boat-tail (Cases 2, 4 and 5) have such ratios on the order of 200. The lightest and smallest particles that are lifted but do not impinge have values on the order of 1000 or more, and the largest heaviest particles that are not lifted have values much lower than 100. Of the three
Case 1
Case 2
Case 3
Case 4
Figure 3.4:Sample particle traces in time-averaged flow-field for Cases 1 through 4 - Overhead View (left: D = 0.5 mm - ρ = 10 kg/m3, middle: D = 1.0 mm - ρ = 50 kg/m3, right: D = 2.5 mm - ρ = 100 kg/m3
Case 1
Case 2
Case 3
3.3 Particle Accumulations from Unsteady Flow Field
Using the selected particle properties (D = 0.5 mm - ρ = 100 kg/m3), the quasi-static approach for evaluating the potential accumulation of snow particles (described in Section 2.5) on the base of an HDV was performed. For the analysis, flow-fields sampled at 100 Hz for a time period of 5.5 seconds were used. This provided 550 flow-fields per case, and therefore a total of 520,300 particles tracked through each simulation case.
Figure 3.6 shows, for each case, four sample particle-trace images. It is evident that the greatest numbers of particles are lifted into the wake for the no-boat-tail configuration. There are no significant differences in the variation of particle traces for the three boat-tail cases at 0◦wind
angle, especially when compared to the no boat-tail case. The 8◦ wind angle case shows a greater number of particles lifted into the wake. As with the 0◦wind angle cases, the particles
that are lifted into the wake for the 8◦ case emanate from the flow region below the vehicle
and not from the wake to the side of the trailer.
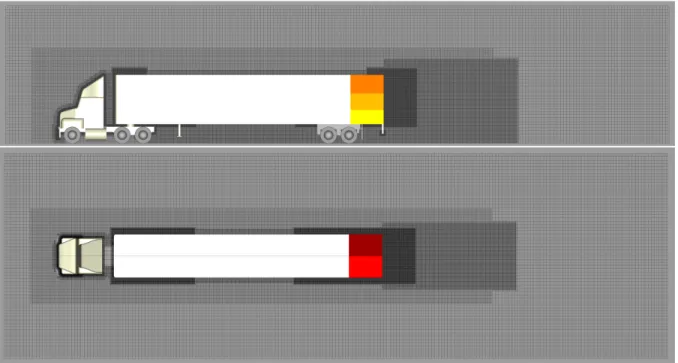
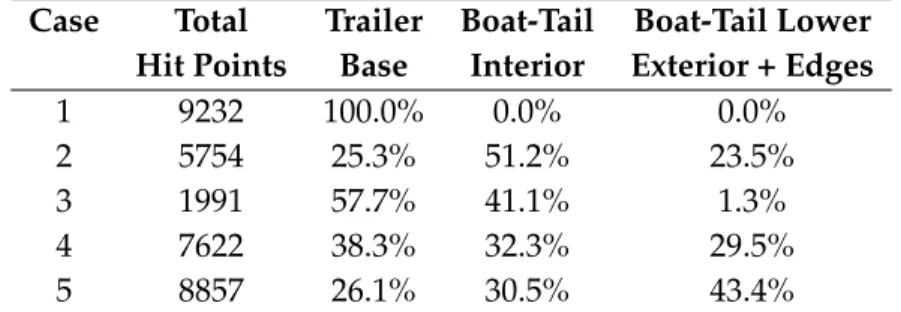
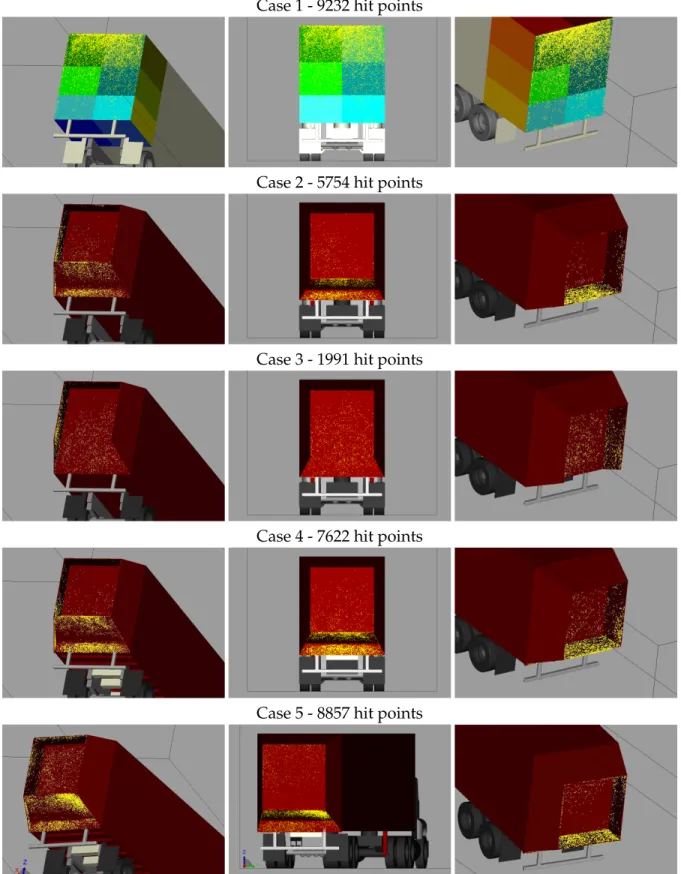
The particle impingement locations from the quasi-static analyses are shown in Figure 3.7 for the five cases, and the numbers and distributions of hit-points are tabulated in Table 3.2. From Figure 3.7, it is evident that without a boat-tail the accumulation of particles occurs at the top of the trailer base. This is consistent with the particle-trace images that show particles lifted high into the wake. With a boat-tail, the accumulation predominantly occurs on the lower aft surfaces, again consistent with the particle traces and with the downward direction of the wake as a result of the boat-tail.
Based on the 4-panel boat-tail with smooth underbody as a reference case (Case 2), 60% greater accumulation occurs if the boat-tail is removed (Case 1), and 65% lower accumulation is ob-served if the lower panel of the boat-tail is removed (Case 3). This provides evidence that a boat-tail will result in lower total accumulation of snow particles, especially for boat-tails without a lower panel. However, in comparing the distributions of snow-particle accumula-tion, the largest proportion of particle hit points for the 4-panel boat-tail case are on the inside surface of the lower panel (43% of all hit points for Case 2). Due to the flat nature of this panel, these particles have a much greater chance of remaining in place and accumulating over a long
Table 3.2:Hit point summary from quasi-static analysis for Cases 1 through 5 for D = 0.5 mm and ρ = 100 kg/m3
Case Total Trailer Boat-Tail Boat-Tail Lower Hit Points Base Interior Exterior + Edges
1 9232 100.0% 0.0% 0.0%
2 5754 25.3% 51.2% 23.5%
3 1991 57.7% 41.1% 1.3%
4 7622 38.3% 32.3% 29.5%
Case 1
Case 2
Case 3
Case 4
Case 1 - 9232 hit points
Case 2 - 5754 hit points
Case 3 - 1991 hit points
Case 4 - 7622 hit points
Case 5 - 8857 hit points
Figure 3.7:Hit point distributions from quasi-static analysis for Cases 1 through 5 for D = 0.5 mm and ρ = 100 kg/m3
period to form larger accretions that may shed from the cavity. Particles on the vertical sur-faces are less likely to remain in place and accumulate over time, as evidenced by no-boat-tail HDVs currently operating on Canadian roads in the winter.
When comparing the smooth-underbody to the rough-underbody cases (Cases 2 and 4), a lower proportion of snow particles impinge on the inner surface of the boat-tail cavity with a rough underbody. A greater proportion accumulates on the lower surface of the lower panel, as well as on the lower base surface below this panel. This can be explained by the lower mean wind speeds at the trailer base for the rough underbody case, resulting in the larger and lower recirculation vortex, described in Section 3.1, that delivers less particles into the boat-tail cavity. The rough underbody case shows 32% more impingement locations on the lower base and boat-tail than for the smooth underbody case. The higher mean wind speed in the lower region of the smooth-underbody wake carries the particles through the wake region quicker, and therefore the higher momentum of the particles have a greater potential to overcome the lifting effect and follow the flow through the far wake.
The difference in impingement rates observed between the two underbody roughness condi-tions, which is affected by the wind speed below the base of the HDV, leads to the question of whether the presence of side skirts, which also reduce the underbody flow rates, would influ-ence the impingement patterns and rates. As shown here, the lower underbody wind speed case (rough underbody - Case 4) shows greater impingement rates, and therefore side-skirts may impede the accumulation of snow on the lower inner surface of the boat-tail cavity. Under cross-wind conditions, the rough underbody case showed an increase in particle im-pingements of 16%. Inside the boat-tail cavity, the particles impinge higher on the vertical surfaces, however, the density of particle accumulation is not vastly different than the no-cross-wind case. The greatest difference is found on the underside of the lower panel. Here, a higher density of impingements occurs towards the downwind side, with four times the number of hit points on this lower boat-tail surface compared to the zero-cross-wind case.
3.4 Long Term Accumulation Estimate
Using the particle impingement results from the previous section, combined with an estimate of the particle distribution density kicked-up behind vehicles on the road, an estimate of the long-term accumulation of snow in the boat-tail can be developed. The steps towards devel-oping the current estimate are:
particle spacing of 0.074 m.
3. Assuming this particle distribution is emitted every 0.014 m of convecting flow (equiva-lent to 28 m/s, as defined above) leads to 53×106particles emitted from the simulation plane per second.
4. The hitpoint quantities in Table 3.2 are based on particle traces from 550 unsteady flow-fields, which is equivalent to 520,300 particles emitted throughout each simulation. As-suming the zero-cross-wind rough-underbody case with 7622 hitpoints, 1.5% of the emit-ted particles therefore impinge on the aft end of the HDV and boat-tail. It is thus as-sumed that approximately 0.77×10⁶of the 53×106particles will impinge per second. 5. Of the surfaces on which particles impinge, the top surface of the lower boat-tail panel
is of most concern for accumulation. This surface represents 24% of the total particle impingements for Case 4, and therefore it is estimated that approximately 0.18×10⁶ par-ticles will impinge on this surface per second.
6. The particles used in the simulation have a mass of 6.5×10⁻⁶kg. The total accumulation of mass per second on the lower boat-tail panel is then estimated to be 0.00117 kg/s or 0.0702 kg/min or 4.2 kg/h.
This rudimentary estimate shows the potential for 4 kg of snow to accumulate per hour inside a 4-panel boat-tail cavity on the top surface of its lower panel. As described with regards to the time-averaged results, other particle-property combinations provide similar drag-to-weight distributions. The larger particles with lower density have particle masses an order of magnitude higher than those used in the quasi-static simulation, which would provide an even higher accumulation rate than 4 kg/h.
Although the estimate above does not provide definitive evidence that snow can accumulate within the cavity of a boat-tail at a rate of 4 kg/h, it does provide evidence for the potential of this to occur.
4. Conclusions
In an effort to evaluate the potential safety hazards of snow and ice accumulating and shed-ding from the cavities of boat-tails, a preliminary study has been undertaken to examine whether there is a potential for ice and/or snow to accumulate in the cavity of a boat-tail-equipped HDV. Arguments have been made that snow is more likely to accumulate in a boat-tail than ice due to operational and road-safety considerations, and therefore this study has focussed on the potential for snow accumulation while a vehicle is travelling at highway speeds. Unsteady CFD simulations of an HDV, with and without boat-tails, were performed from which the unsteady flow-fields were used with a particle-tracking algorithm to identify possible impingement and accumulation sites. The main findings of the study are:
1. Particles that can impinge on the base of an HDV emanate from below the vehicle and therefore snow kicked-up from the wheels is the dominant source of snow for an im-pingement analysis;
2. Particles with drag-to-weight ratios on the order of 200 provide the greatest accumula-tion on the base of an HDV;
3. The quasi-static particle-tracking analysis provided larger distribution patterns of parti-cles than those based on time-averaged results;
4. The baseline HDV configuration without a boat-tail showed the greatest level of im-pingement sites, predominantly at the top of the trailer base;
5. The 3-panel boat-tail showed the lowest level of impingement, with low-density im-pingement sites spread out over the vertical surfaces within the boat-tail cavity;
6. Greater flow resistance in the underbody region, resulting from a rough trailer under-body, leads to lower wind speeds at the base of the HDV and influences the location of highest impingement, moving it from within the boat-tail cavity to the bottom surface of the lower boat-tail panel, and also increases impingement rates;
References
Exa PowerVIZ (2012), “PowerVIZ User’s Guide - Release 4.4 Revision 2,” , Exa Corporation. Gaylard, A. P. and Duncan, B. (2011), “Simulation of Rear Glass and Body Side Vehicle Soiling
by Road Sprays,” SAE Int. J. Passeng. Cars - Mech. Syst., 4, pp. 184–196.
Jilesen, J., Gaylard, A. P., Duncan, B., Konstantinov, A. and Wanderer, J. (2013), “Simulation of Rear and Body Side Vehicle Soiling by Road Sprays Using Transient Particle Tracking,” SAE Int. J. Passeng. Cars - Mech. Syst., 6, pp. 424–435.
McAuliffe, B. R. (2013a), “Aerodynamic Safety Implications for a Passenger Vehicle Travelling in the Wake of a Boat-Tail Equipped HDV,” NRC Report No. LTR-AL-2013-0014, National Research Council Canada.
McAuliffe, B. R., Szilder, K. and Oleskiw, M. (2013b), “Methods to Investigate Safety Impli-cations Associated with the Accumulation and Shedding of Ice and Snow for a Boat-Tail Equipped HDV,” NRC Report No. LTR-AL-2013-0027, National Research Council Canada. Patten, J., McAuliffe, B. R., Mayda, W. and Tanguay, B. (2012), “Review of Aerodynamic Drag
Reduction Devices for Heavy Trucks and Buses,” No. CSTT-HVC-TR-205, National Re-search Council Canada.
Patten, J., Poole, G., Mayda, W. and Wall, A. (2010), “Trailer Boat Tail Aerodynamic and Colli-sion Study,” No. CSTT-HVC-TR-169, National Research Council Canada.
Takamura, A. and Saito, I. (2008), “Prediction Snow Ingress into Air Intake System,” SAE International Journal of Passenger Cars - Mechanical Systems, 1, pp. 200–207.
A. Particle Trace Images for Time-Averaged
Flow Fields
The particle trajectories for the time-averaged particle tracking simulations are shown in Fig-ures A.1 through A.5 for the five CFD simulation cases.
D = 0.5 mm - ρ = 10 kg/m3 ρ= 50 kg/m3 ρ= 100 kg/m3
D = 1.5 mm - ρ = 10 kg/m3 ρ= 50 kg/m3 ρ= 100 kg/m3
D = 2.5 mm - ρ = 10 kg/m3 ρ= 50 kg/m3 ρ= 100 kg/m3
D = 4.0 mm - ρ = 10 kg/m3 ρ= 50 kg/m3 ρ= 100 kg/m3
D = 0.5 mm - ρ = 10 kg/m3 ρ= 50 kg/m3 ρ= 100 kg/m3
D = 1.5 mm - ρ = 10 kg/m3 ρ= 50 kg/m3 ρ= 100 kg/m3
D = 2.5 mm - ρ = 10 kg/m3 ρ= 50 kg/m3 ρ= 100 kg/m3
D = 0.5 mm - ρ = 10 kg/m3 ρ= 50 kg/m3 ρ= 100 kg/m3
D = 1.5 mm - ρ = 10 kg/m3 ρ= 50 kg/m3 ρ= 100 kg/m3
D = 2.5 mm - ρ = 10 kg/m3 ρ= 50 kg/m3 ρ= 100 kg/m3
D = 4.0 mm - ρ = 10 kg/m3 ρ= 50 kg/m3 ρ= 100 kg/m3
D = 0.5 mm - ρ = 10 kg/m3 ρ= 50 kg/m3 ρ= 100 kg/m3
D = 1.5 mm - ρ = 10 kg/m3 ρ= 50 kg/m3 ρ= 100 kg/m3
D = 2.5 mm - ρ = 10 kg/m3 ρ= 50 kg/m3 ρ= 100 kg/m3
D = 2.5 mm - ρ = 10 kg/m3 ρ= 50 kg/m3 ρ= 100 kg/m3
D = 4.0 mm - ρ = 10 kg/m3 ρ= 50 kg/m3 ρ= 100 kg/m3