Publisher’s version / Version de l'éditeur:
Marine technology, 43, 1, pp. 1-10, 2006
READ THESE TERMS AND CONDITIONS CAREFULLY BEFORE USING THIS WEBSITE. https://nrc-publications.canada.ca/eng/copyright
Vous avez des questions? Nous pouvons vous aider. Pour communiquer directement avec un auteur, consultez la première page de la revue dans laquelle son article a été publié afin de trouver ses coordonnées. Si vous n’arrivez pas à les repérer, communiquez avec nous à PublicationsArchive-ArchivesPublications@nrc-cnrc.gc.ca.
Questions? Contact the NRC Publications Archive team at
PublicationsArchive-ArchivesPublications@nrc-cnrc.gc.ca. If you wish to email the authors directly, please see the first page of the publication for their contact information.
This publication could be one of several versions: author’s original, accepted manuscript or the publisher’s version. / La version de cette publication peut être l’une des suivantes : la version prépublication de l’auteur, la version acceptée du manuscrit ou la version de l’éditeur.
Access and use of this website and the material on it are subject to the Terms and Conditions set forth at
Numerical study of hub taper angle on podded propeller performance
Islam, M.; Veitch, B.; Bose, N.; Liu, P.
https://publications-cnrc.canada.ca/fra/droits
L’accès à ce site Web et l’utilisation de son contenu sont assujettis aux conditions présentées dans le site LISEZ CES CONDITIONS ATTENTIVEMENT AVANT D’UTILISER CE SITE WEB.
NRC Publications Record / Notice d'Archives des publications de CNRC:
https://nrc-publications.canada.ca/eng/view/object/?id=d0aa9459-f449-4412-9134-c900299c7ebc https://publications-cnrc.canada.ca/fra/voir/objet/?id=d0aa9459-f449-4412-9134-c900299c7ebc
Numerical Study of Effects of Hub Taper Angle on the
Performance of Propellers Designed for Podded
Propulsion Systems
Mohammed Fakhrul Islam,
1Brian Veitch,
2Neil Bose,
3and Pengfei Liu
4ABSTRACT
Presently, the majority of podded propulsion systems are of the pulling type, because this type provides better hydrodynamic efficiency than the pushing type. There are several possible explanations for the better overall performance of a puller type podded propulsor. One is related to the difference in hub taper angle. Puller and pusher propellers have opposite hub taper angles, hence different hub and blade root shape. These differences cause changes in the flow condition and possibly influence the overall performance. The current study focuses on the variation in performance of pusher and puller propellers with the same design of blade sections, but different hub taper angles. A hyperboloidal low order source-doublet steady/unsteady time domain panel method code, PROPELLA, was modified and used to evaluate effects of hub taper angle on the open water propulsive performance of some fixed pitch screw propellers used in podded propulsion systems. Major findings include good agreement between predictions using the modified code and measurements, significant effects of hub taper angle on propulsive performance of tapered hub propellers and noticeable effects of hub taper angle on sectional pressure distributions of tapered hub propeller blades. These findings shed some light on the design and development of an optimized pusher propeller with better propulsion performance and substantially lower fluctuation forces on the strut.
INTRODUCTION
Although research has been done on podded propellers for over three decades, this propulsion system type was introduced to the marine industry only a little over a decade ago. Since then, it has obtained wide acceptance as a main propulsion system for a variety of large commercial vessels, notably for large cruise ships and ferries where manoeuvrability at low speed is very important. _____________
1
Ph.D. Candidate, Ocean & Naval Arch. Engg., Faculty of Engg. and Applied Sc., Memorial University of Newfoundland, Canada.
2
Associate Professor, Ocean & Naval Arch. Engg., Faculty of Engg. and Applied Sc., Memorial University of Newfoundland, Canada.
3
Professor and Canada Research Chair in Offshore and Underwater Vehicles Design, Ocean & Naval Arch Engg., Faculty of Engg. and Applied Sc., Memorial University of Newfoundland, Canada.
4
Associate Researcher, Institute for Ocean Technology, National Research Council Canada.
Basically, a podded propulsion system consists of a fixed pitch propeller driven by an electric motor through a short shaft. The shaft and the motor are located inside a pod shell. The pod unit is connected to the ship's hull through a strut and slewing bearing assembly. This assembly allows the entire pod unit to rotate and thus the thrust developed by the propeller can be directed anywhere over 360° relative to the ship.
The podded propeller arrangement eliminates the requirement for a rudder and additional appendages such as shaft brackets. This arrangement results in lower appendage drag, hence lower power consumption (Triantafyllou et al. 2003). The shorter shaft also helps in reducing noise and vibration. When a podded propeller in puller configuration is used, the propeller works in more uniform flow, which reduces load variations and risk of cavitation (Rains and Vanlandingham 1981). These systems
also yield much better manoeuvrability than conventional screw propellers (Toxopeus and Loeff 2002), which is more important in confined water operation. Despite these advantages, podded propulsion systems have some disadvantages, such as high capital cost (Triantafyllou et al. 2003), sometimes the bearing failure (Carlton 2002) and some other structure problems (such as structural risks of fatigue failure and vibration of a heavy unit suspended on a strut) confronted while operating in oblique flow conditions (Carlton 2002).
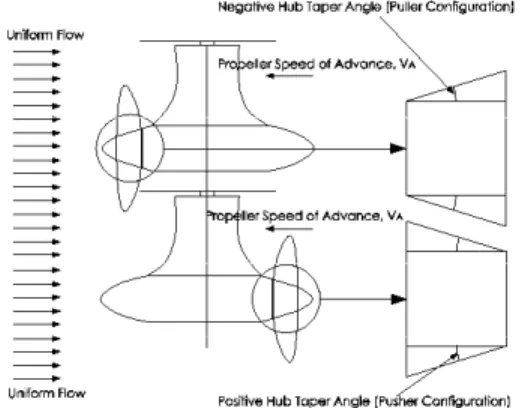
Two types of podded propulsion systems are used: puller and pusher. The general arrangement of these two systems is shown in figure 1. Presently, the majority of commercial vessel installations are the puller type. Although a number of model and full-scale tests, and some numerical work have been done, there are still knowledge gaps, especially in the understanding of their hydrodynamics. Islam (2004) provided a comprehensive literature review of the experimental and numerical work on podded propulsion systems.
One of the main features that distinguish a puller propeller from a pusher propeller is the hub geometry. To streamline the pod profile, the hub of the propeller must be tapered. That is, a more conically shaped hub is usually used for a podded propeller, rather than the straighter or cylindrical hub used in conventional fixed pitch propellers. The pusher and the puller podded propellers have opposite hub taper angle. Figure 1 shows the difference of the two types of podded propulsion systems and the definition of hub taper angle.
Fig. 1 Podded Propulsion Systems; puller and pusher podded propulsion system; definition of hub taper angle.
The flow field around the propeller changes because of the introduction of the tapered hub. This results in changing the propulsive performance of the propeller as compared to performance of a straight hub propeller. As far as is known by the authors, there has not been any numerical or experimental work reported to date which studies the effects of root
hub taper angle for a wide range (ranging from +25° to -25°) on propeller performance. Some research work has been done on propeller boss cap fins (Ouchi 1988, Black et al. 2000), which are fitted to tapered hub cones behind the propeller boss. These papers addressed the effects of boss cap fins on propeller performance but did not address the effect of hub taper angle. The numerical prediction of effects of hub taper angle on the propulsive performance of propellers designed for podded propulsion systems is the main focus of this research work.
The aim is to provide information that will be of use as a guide to podded propeller design over a wide range of open water conditions and will form a suitable basis of comparison for future work. The modified panel method code, PROPELLA, was first validated against experimental measurements of four propellers of pusher and puller types. The propulsive characteristics of the pusher and puller propellers were then predicted to get a suitable basis of comparison. This comparison helped to study the effect of taper angle on performance. The predicted pressure distributions of blade sections at different radial positions for the two types of propeller are also presented to study the effect of hub taper angle on pressure distributions.
METHODS
The low order source-doublet, steady/unsteady time domain panel method, PROPELLA, was modified and used to predict hydrodynamic performance of screw propellers with various configurations. The structure, functionalities, implementation and demonstration of the code are discussed in detail in Liu (2003). A brief description of the numerical model of the multiple-body and multiple-path panel method used in the code is given in Liu (1996). The geometry part (Liu et al. 2001(a)) of the code was extended to include hub taper angle. The blade planform, especially around the root section, as well as the hub geometry, changes because of this inclusion. Several functions were written to take care of all these changes. All of these functions are used after all coordinates of corner points of the blade panels are obtained in the original code. The various steps that were followed to include hub taper angle into the propeller geometry are outlined as follows.
Step 1: A restriction to the hub taper angle was imposed in such a way that the angle can never exceed 25° both of pusher and puller configurations. A taper angle more than 25° usually results in impractical shaft diameter (too large for the pusher propeller and too small for the puller propeller).
Step 2: The radial positions of all corner points of all panels of the key blade at each spanwise and chordwise location are obtained. At the blade root section the formulations that were used for this purpose are
)
_
tan(
RH
Angle
c
r
r
TE=
h+
r×
………….(1))
_
tan(
1x
RH
Angle
r
r
i=
i−+
Dist×
……….(2) where, in equation (1), rTE is the radial position of theblade root at the trailing edge, rh is the straight hub
radius, cr is chord length at the blade root section and
RH_Angle is the hub taper angle. In equation (2), ri is
the blade root section radius at different chordwise location i and xDist is the chordwise distance of the
panel corner points from the trailing edge. The radial locations of all other corner points for other spanwise locations above the blade root section are obtained by adding the panel distance in the spanwise direction to the root section radii. A similar calculation was done to get all radial locations of corner points on other blade(s) (called dummy blades).
Step 3: A standard cubic spline interpolation function was used to get all the coordinates (all x, y and z coordinates) both on the blade face and back corresponding to the new radial locations for both key and the dummy blade(s). Figure 2 shows the blades of the model propeller after modification due to the inclusion of hub taper angle in the code. This and other discretized pictures are viewed in GPPPP (Liu 2002).
Fig. 2 Discretized blades of a right-handed propeller after inclusion of taper angle.
Step 4: In the next step, the straight hub was modified to a conical hub having the surface inclination angle equal to the hub taper angle. The correct connectivity of the blades and hub surface interface was maintained. The angle, ș, subtended between the blade face corner points and the
subsequent blade back is obtained using the cosine law.
+
+
=
−ab
c
b
a
2
cos
2 2 2 1θ
……….(3) where,( ) ( )
2 2 j j face facez
y
a
=
+
( ) ( )
2 2 j j back backz
y
b
=
+
(
) (
2)
2 j j jj face back face
back
y
z
z
y
c
=
−
+
−
where, j facey
is the y coordinate of the jth panel corner points at the blade root section on the face side,j
face
z
is the z coordinate of the jth panel corner points at the blade root section on the face side,j
back
y
is the y coordinate of the jth panel corner points at the blade root section on the back side, andj
back
z
is the z coordinate of the jth panel corner points at the blade root section on the back side.The panel corner points of the tapered hub at two sides (face and back) of the blade root section interface are forced to be equal to that of the blade root section face and back. This ensures a good connectivity at the interface. Other hub corner points (three coordinate points, e.g.
ijk hub
x
, ijk huby
and ijk hubz
) between blades are obtained using the following formulations.(
)
)
1
(
_
−
−
+
=
j
BTntv
No
x
x
x
x
ik ik ik ijk face back face hub ……... (4)(
)
(
1
)
sin
+
×
−
×
=
r
D
j
y
i jkijk cur i angle
hub
α
……(5)(
)
(
1
)
cos
+
×
−
×
=
r
D
j
z
i jkijk cur i angle
hub
α
.…(6)Here, in equations (4, 5 and 6) , i = 1….N_Blade, j = 1…..No_BIntv + 1 and k = 1…..NCS_D and
(
)
)
1
(
_
−
−
+
=
j
BTntv
No
r
r
r
r
ij ij ij ij face back face cur(
) (
2)
2 j ij ij face face facey
z
r
=
+
( ) ( )
2 2 ij ij ij back back backy
z
r
=
+
Also, in these equations
α
iis the angular position of panel corner points at the blade root section for different blade positions, which takes into account the four quadrants,i
angle
D
is the angle subtended by each panel at the hub to the propeller geometric center,N_Blade is the total number of blades on the propeller, No_BIntv is the number of intervals between blades and NCS_D is number of chordwise intervals in dummy blades.
Figure 3 shows only the discretized hub of the model propeller after the taper angle has been included. Figure 4 shows a comparison of two propellers. Figure 4-a is the geometry with no taper angle (straight hub) and figure 4-b is the geometry after inclusion of a positive taper angle. The blade-hub fillet was not considered in the propeller modeling. No study has been seen on the effect of a blade-hub fillet on podded propeller performance. Studies had been carried out on the effect of the blade-hub fillet geometry on the cavitation performance (Walker 1995) and panel method simulations have included the effect of root fillets (Johnson et al. 1991).
Fig. 3 Discretized hub of a right-handed propeller after inclusion of taper angle (positive angle for right-handed
propeller).
Fig. 4Comparison of two propellers geometry, (a) model propeller with straight hub. (b) model propeller with tapered hub.
RESULTS AND DISCUSSIONS
In the current study, four model propellers were studied, two of which were designed for a puller podded system and the other two for a pusher podded system. The propellers have the same design blade sections with different hub taper angles. Islam (2004)
provided all the geometric details of the model propellers. The four propellers have a hub taper angle of 15° (right handed pusher configuration, Push+15), 20° (right handed pusher configuration, Push+20), -15° (left handed puller configuration, Pull-15), -20° (right handed puller configuration, Pull-20). Figure 5 shows a photograph and a rendered view (viewed in GPPPP) of the model propellers.
Fig. 5 Four model propellers (Top- actual physical model; Bottom- rendered model). Figure (a), (b), (c), (d) are the propellers with hub taper angles of +15° (push), +20° (push),
-15° (pull), -20° (pull), respectively.
VALIDATION OF THE MODIFIED CODE The extended code was validated against experimental results (Islam et al. 2004). The measurements consist of open water tests of three propellers with the same design blade sections (except hub taper angle). The model propellers have hub taper angles of 15° and 20° for pusher configurations and –15° for puller configurations. The prediction of the propeller with –20° hub taper angle was validated against measurements from a cavitation tunnel under atmospheric pressure
conditions. The experiments were carried out at the Institute for Ocean Technology (IOT) Towing tank and Cavitation Tunnel facilities.
For the purpose of calculations, the simulation parameters that were used are summarized in table 1. Table 2 summarizes the total number of simulations done for validation purposes. According to table 2, the total number of runs is 32 (so is the number of input files). In each run the executable needs one input file. All the runs were made using a batch process. The runs were performed in a Proliant (Compaq 82 ML570 (4xP3 700MHz Xeon w/512 cache) with 4GB of RAM) server (Windows 2000 server operating system) and an Alpha ESXX server (DS20E (2x667MHz) with 4GB of RAM). On average it took around one hour for each run in both machines when the simulation parameters as indicated in table 1 were used.
Table 1 List of parameters used in the code for the predictions of propeller performance.
Parameters Push+15 Push+20 Pull-15 Pull-20
Spanwise Grid
Type Uniform Uniform Uniform Uniform
Chordwise Grid Type Uniform Uniform Uniform Uniform No. of Spanwise
Intervals (Blades) 12 12 12 12
No. of Chordwise
Intervals (Blades) 16 16 16 16
Front hub cone length 1.7D 1.7D 1.25D 1.25D
Real hub cone length 3.0D 3.0D 3.0D 3.0D
No. of axial intervals
(Front hub) 8 8 6 6
No. of axial
Intervals (Rear hub) 12 12 12 12
No. of circular
intervals (Front hub) 24 24 24 24
No. of circular
intervals (Rear hub) 24 24 24 24
No. of intervals
between blades 6 6 6 6
Hub taper angle 15° 20° -15° -20°
No of revolutions 3 3 3 3
Time steps per
revolution 60 60 60 60
Table 2 Number of simulation performed for the validation of the extended code.
Simulation Parameters Number of Simulations Propeller Type 4 (2 pusher & 2 puller) Advance Coefficient, J 8 (0.00-1.15)
The experimental results for the four propellers were collected and analyzed in terms of propeller thrust coefficient, KT, propeller torque coefficient,
10KQ, propulsive efficiency, Ș and propeller advance
coefficient, J. Figures 6 through 9 show comparisons of propeller open water performance between measurements and predictions for model propellers,
Push+15, Push+20, Pull-15 and Pull-20, respectively. A discussion on the uncertainty of the experimental results is given in Islam et al. (2004).
It can be seen that predictions of open water propulsive performance are close to measurements for a wide range of advance coefficient. This is true for the pusher and puller propellers. For KT and KQ, it
is observed that the corresponding predicted values approach the measurements closely for a wide range of advance coefficient from the bollard pull condition (J=0.0) to an advance coefficient, J = 1.0 (covers most of the operating range of any practical propeller). In the case of the pusher propellers (figures 6 and 7), for an advance coefficient of close to zero (J = 0.0-0.2), the calculated values are very close to the measurements. For an advance coefficient of more than 1.0, the calculated values are slightly higher than the measurements. For a moderate advance coefficient range (J=0.20-0.80), the calculated values are slightly lower than the measurements. The predictions for the puller propeller, Pull-15, are closer to the corresponding measurements (see figures 8). In this case the predicted values are lower than the measurements for high J values. The predicted thrust and torque for the puller propeller, Pull-20, are lower than the corresponding measurements (see figures 9). The wake roll-up and relaxation model (Liu et al. 2002) was not enabled as it consumes too much CPU time and this might reduce thrust and torque at very high advance coefficients.
Fig. 6 Comparison of the measured (Expt) and predicted (Propella) propulsive characteristics of the model propeller,
Fig. 7 Comparison of the measured (Expt) and predicted (Propella) propulsive characteristics of the model propeller,
Push+20, with hub taper angle of 20° (push configuration).
Fig. 8 Comparison of the measured (Expt) and predicted (Propella) propulsive characteristics of the model propeller,
Pull-15, with hub taper angle of -15° (pull configuration).
Fig. 9 Comparison of the measured (Expt) and predicted (Propella) propulsive characteristics of the model propeller,
Pull-20, with hub taper angle of -20° (pull configuration).
The comparison of performance between the measurements and the predictions are provided in table 3. Here the positive numbers represent the fact that the predicted values are higher than the measurements and visa versa. All numbers are percentages based on measurements. The predicted thrust and torque are slightly lower than that of the corresponding measured values for moderate advance coefficients (J = 0.2-0.6) and higher for low advance coefficients (J = 0.0-0.2). This is true for both Push+15 and Push+20 (see figures 6 and 7). The code is a potential flow code but a simplified empirical formulation was used to take into account the viscous effects in terms of skin friction. A more realistic formulation to take into account the viscous effects might improve the predictions further.
Table 3 Comparison of propulsive performance of the four model propellers between predictions and measurements. Here the
positive numbers represent the fact that the predicted values are higher than the measurements and visa versa. All numbers are
percentages based on measurements.
Push+15 Push+20 Pull-15 Pull-20
J Kt Kq Kt Kq Kt Kq Kt Kq 0 -1.51 3.75 -3.06 -1.07 -2.25 1.92 - - 0.2 -4.24 -0.41 -4.23 -2.14 -2.67 -1.09 - - 0.4 -3.83 -2.76 -4.07 -5.58 -6.35 -4.44 -6.04 -5.43 0.6 -2.41 -5.88 -2.53 -9.40 -8.98 -6.62 -12.37 -10.28 0.8 -0.26 -8.70 -0.62 -12.48 -15.33 -9.59 -16.41 -13.45 1 20.40 -4.19 23.14 -10.79 -53.80 -12.27 -80.89 -27.50
It should be noted that the current panel method code predicts propulsive performance accurately for a wide range of advance coefficients starting from highly loaded conditions (low J values, J = 0.0), where the speed of advance is very low resulting in a high angle of attack, to a lightly loaded condition (high J values, J = 1.0).
EFFECTS OF HUB TAPER ANGLE ON PERFORMANCE
The effects of hub taper angle on propulsive performance of the model propeller are evident when performance of the propellers of same design blade sections with different taper angles is compared in terms of KT, KQ and Ș, for a wide range of J. Figures
10 and 11 show the predicted values of open water propulsive performance for hub taper angles of 15° push and –15° pull configurations and of 20° push and –20° pull configurations, respectively. Propulsive performance for a straight hub propeller is included in these figures to emphasize how the hub taper angles influence propulsive performance.
From Figure 10 it is apparent that the hub taper angle has more influence on KT and KQ at highly
loaded conditions (low J values, J <= 0.4) and lightly loaded conditions (high J value, J >= 0.9) than for moderately loaded conditions (J = 0.4~0.9). For the same 15° hub taper angle, the push propeller produced less thrust than the pull propeller (for J=0.0-0.6). A quantitative study of the effects of hub taper angle on propulsive performance (KT, KQ and Ș)
for a practical range of J=0.0 to J=1.0 is summarized in table 4. According to the table at J=0.0 (bollard pull condition) an increase of 10% of KT and an
increase of 2% of KQ were predicted for the Pull-15
propeller as compared to that of the Push+15 propeller. The corresponding measured values were 7% and 4%, respectively. The percentage change of KT and KQ decreases as J is increased and at high J
the values become negative. In other words, at high J, the performance of a puller propeller gets worse than the pusher ones. Quantitatively, at J=1.0, a decrease of 68% of KT and a decrease of 13% of KQ were
predicted for the Pull-15 propeller as compared to that of the Push+15 propeller. The corresponding measured values (decrease) were 5% and 12%, respectively. A similar study was made for the Pull-20 and Push+Pull-20 propellers as shown in table 4.
Fig. 10 Numerical results showing the effects of hub taper angle on the propulsive performance of propellers with hub taper angles
of 0°, 15° and –15°.
Fig. 11 Numerical results showing the effects of hub taper angle on the propulsive performance of propellers with hub taper angles
of 0°, 20° and –20°.
Table 4 Quantitative studies of effects of hub taper angle on propulsive at different Js. Here the positive numbers represent the fact that the predicted values of the puller propeller are higher than the basis propeller (pusher propeller) and visa versa. All numbers are percentages based on the performance of the pusher propellers.
Predictions Measurements J Kt Kq η Kt Kq η 0.00 10.39 1.73 0.00 6.58 3.56 0.00 0.20 8.57 3.47 4.96 6.82 4.18 2.53 0.40 4.63 3.46 1.47 7.45 5.28 2.06 0.60 0.24 3.74 -3.39 6.81 4.57 2.14 0.80 -11.27 0.42 -12.76 3.02 1.42 1.58 P ull-15 vs. P ush+15 1.00 -68.20 -13.44 -46.47 -17.13 -5.48 -12.33 0.00 11.19 2.76 0.00 - - - 0.20 9.50 4.90 -1.58 - - - 0.40 5.16 4.36 -0.91 7.36 4.18 3.05 0.60 -0.98 3.74 -0.04 10.19 4.75 5.20 0.80 -17.30 -3.73 0.10 -0.45 -2.66 2.27 P ull -20 vs. P ush+20 1.00 -91.49 -34.33 -71.25 -38.30 -19.19 -23.65
That an increase in propulsive performance for a propeller with negative hub taper angle and a reduction in propulsive performance for a propeller with positive taper angle occurs may be attributed to the change in leading and trailing edge area to the tapered hub propellers. When pressure distributions of blade sections are examined, it appears that the majority of total thrust produced by the propeller blades is produced in the leading edge area. For propellers with positive taper hub angle some blade portion around the leading edge near the blade roots is chopped off and some blade portion around the trailing edge is added, resulting in lower total thrust produced by the propeller as compared to that of a straight hub propeller. The reverse case is true for propellers with negative hub taper angle. A further discussion on this is provided when the effect of hub taper angle on sectional pressure distributions is discussed in the next section.
EFFECTS OF HUB TAPER ANGLE ON SECTIONAL PRESSURE DISTRIBUTION Pressure distribution in terms of pressure coefficient, Cp, at the blade root section, the section at 0.20R and the section at 0.75R radial positions were predicted for a wide range of advance coefficient in open water conditions for the Push+15 and Pull-15 propellers. The predictions of pressure distributions were analyzed in order to identify the variations of propulsive performance of the propellers, which vary only in hub geometry. It was observed that because of the variation of hub taper angle the pressure distribution around blade sections varied, which influences the average propulsive performance.
The predictions for the pressure distribution in terms of pressure coefficient, Cp, around the blade root section (pressure side, PS as well as suction side, SS) for an advance coefficient of J = 0.20 are shown
in figures 12, 13 and 14 for the propellers with hub taper angles of 0°, 15°, and –15°, respectively. The blade root sections for each of these propellers are also shown in the figures to facilitate the understanding of sectional pressure distributions.
Fig. 12 Numerical results showing the pressure distribution at the blade root section of the propeller with straight hub at J=0.20.
Fig. 13 Numerical results showing the pressure distribution at the blade root section of the propeller Push+15 at J=0.20.
Fig. 14 Numerical results showing the pressure distribution at the blade root section of the propeller Pull-15 at J=0.20.
Figure 12 shows the pressure distribution at the blade root section for a straight hub propeller. In this case it is seen that the majority of the blade thrust is produced by the leading edge and from negative pressure on the suction side and positive pressure on the pressure side. The pressure distribution appears normal and favorable for producing positive thrust. A pressure peak is seen around the leading edge. The pressure distribution for the propeller with a taper angle of 15° for the push configuration shows some undesired crossover of the CP curves around
mid-chord. The loop downstream of the crossover produces a negative pressure difference, which leads to a reduction of total thrust produced by the blades. This might be one of the reasons for which lower thrust is produced for propellers with positive hub taper angle (pusher configuration) as compared to that of a straight hub propeller at lower advance coefficients (J<0.60). Also at positive taper angle the minimum pressure coefficient is less than for the conventional straight hub propeller. The abnormal root sectional shape as a result of the intersection between two 3D surfaces, the blade section and the hub cone, causes the poor pressure distribution. The pressure distribution for the Pull-15 propeller, shown in figure 14, shows a more desirable pressure distribution as compared to that of the previous two propellers. The area covered by the CP curves (thrust
produced by that section) is larger than that of the straight-hub propeller, thus giving higher thrust. It can be seen in figure 14, as a result of the intersection of the two 3D surfaces, of the hub cone and the blade section, respectively, though the camber of the root section was reduced substantially, it gave a more desirable pressure distribution in terms of CP
difference, and hence increased thrust production. Figures 15, 16 and 17 show the pressure distribution at the blade root section for a high advance coefficient of J = 1.0 for the propellers with hub taper angles of 0°, 15°, and –15°, respectively. The pressure distribution at J = 1.0 for the Push+15 (see figure 16) shows a positive peak at the suction side and a negative peak at the pressure side (the opposite was seen at low J) but a cross over occurs around 1% of chordlength. For most of the chordlength a more negative pressure occurs at the suction side of the blade than the pressure side, which results in positive thrust. A similar distribution (see figure 15) was observed for the straight hub propeller but the area included in the loop is less when compared to the Push+15. This results in bigger thrust for the Push+15 than the straight hub propeller for lightly loaded conditions. The pressure distribution for the Pull-15 propeller shows more negative pressure on the pressure side than the suction side. This indicates that the propeller operates at negative inflow angle at this high advance
coefficient. This indicates the reason why the Push+15 propeller performs better than the Pull-15 propeller for high advance coefficients (J>=0.90).
Fig. 15 Numerical results showing the pressure distribution at the blade root section of the propeller with straight hub at J=1.0.
Fig. 16 Numerical results showing the pressure distribution at the blade root section of the propeller Push+15 at J=1.0.
Fig. 17 Numerical results showing the pressure distribution at the blade root section of the propeller Pull-15 at J=1.0.
Figures 18 and 19 show the comparison of the pressure distributions at the blade section at 0.20R for J = 0.2 and for J = 0.80 for the propellers with hub taper angles of 0°, 15°, and –15°, respectively. It can be seen that the pressure distributions do not change much for the three propellers for both advance coefficients. This essentially means that the hub taper angle does not change the inflow conditions to the blade sections above 0.20R. This is further confirmed in figures 20 and 21, which shows the pressure distributions of the three propellers at 0.75R. The pressure distributions at this section are identical. The difference in performance of the puller and pusher propellers is mainly because of the difference in pressure distributions around the blade roots. The performance of a pusher propeller might thus be improved by optimizing the blade root sections as well as by using more favourable pitch and chord distributions, hence avoiding the undesirable crossover of the Cp curves at the blade roots.
Fig. 18 Numerical results showing the comparison of pressure distributions at the blade section at 0.20R of the propellers,
Push+15, Pull-15 and Straight Hub at J = 0.20.
Fig. 19 Numerical results showing the comparison of pressure distributions at the blade section at 0.20R of the propellers,
Push+15, Pull-15 and Straight hub at J = 0.80.
Fig. 20 Numerical results showing the comparison of pressure distributions at the blade section at 0.75R of the propellers,
Push+15, Pull-15 and Straight hub at J = 0.20.
Fig. 21 Numerical results showing the comparison of pressure distributions at the blade section at 0.75R of the propellers,
Push+15, Pull-15 and Straight hub at J = 0.80.
Presently, the pulling podded propeller configuration is far more widely used than a pushing one. The main advantage of a pulling type propeller is the uniformity of the inflow wake in front of the propeller disk and thus it is less cavitation-prone. Both pulling and pushing propeller shed strong wake vortices, but in the puller case they cause a problem by interacting with the strut causing cavitation, vibration and noise. In contrast, the advantage of the pushing type propeller is the absence of a vortex wake impingement related problems, but the inflow wake is affected by the strut upstream to cause a rather non-uniform inflow wake in front of the propeller disk. The current study did not take strut wake or impingement effect into account. The above study on the effect of hub taper angle on the sectional pressure distributions revealed the fact that, if the blade sections of a pusher propeller are optimized in
terms of propulsive and cavitation performance, depending on the functionality of the ship, it might perform better than the corresponding puller propeller (under same power consumption) with the additional advantage of elimination of fluctuation force on the strut.
CONCLUDING REMARKS
An in-house steady/unsteady low order time domain panel method code, PROPELLA was extended to predict the performance of tapered hub propellers.
The modified code was validated against measurements. The measurements consisted of open water tests of three propellers and cavitation tunnel tests (at atmospheric pressure) of one propeller with the same geometry (except hub taper angles). The four propellers have hub taper angles of 15° and 20° for pusher configurations and –15° and -20° for puller configurations. The KT and KQ values of the
predictions and measurements for both propellers in pusher configurations were very close for a wide range of advance coefficient (J = 0.0 to J = 1.0). For the propeller with a negative hub taper angle, good agreement between predictions and measurements were observed throughout all values of advance coefficient.
The effects of hub taper angle on propulsive performance of the model propeller were evaluated in terms of propeller open water characteristics for a wide range of advance coefficient. It is seen that hub taper angle has more influence on KT and KQ at highly
loaded conditions (low J value) than for lightly loaded conditions (high J value). For the same 15° hub taper angle, the pusher propellers produced less thrust for heavily loaded conditions (J<0.60), than the puller ones. The pusher propeller produced higher thrust and torque than the puller ones for lightly loaded conditions (J>0.90). These facts were observed both in predictions and measurements.
Predicted pressure distributions on the blade root sections for puller propellers were found to be more desirable than those of pusher propellers. Puller propellers should therefore produce more thrust than a pusher propeller under the same operating condition. The study also showed that the hub taper angle only changes the inflow condition, hence the pressure distribution around the blade roots (r<0.20R) (of the three propellers, Push+15, Pull-15 and straight hub propeller) but for the rest of the blade sections the pressure distributions remain almost identical. Although the pressure distributions for the pusher propellers do not appeared as desirable as the puller ones do, if the blade sections were to be optimized to avoid the undesirable crossover of the Cp curves for an advance coefficient depending on the functionality
of the ship, their commercial applicability might be as good as a puller configuration propeller.
ACKNOWLEDGEMENTS
The authors would like to express their gratitude to the Natural Sciences and Engineering Research Council (NSERC), the National Research Council (NRC), Memorial University, Oceanic Consulting Corp., and Thordon Bearings Inc. for their financial and other support. Thanks are also extended to the staff at the NRC Institute for Ocean Technology for their assistance.
REFERENCES
BLACK, S. D., CHESNAKAS, C. J. and JESSUP, S. D. “2001 Investigation on efficiency improving boss-cap fins for T-AO 193." Tech. Rep. NSWCCD-50-TR-2001/067, Carderock Division, Naval Surface Warfare Center, Naval Surface Warfare Center, Carderock Division, 9500 Macarthur Boulevard, West Bethesda, MD 20817-5700, 105 p.
CARLTON, J. S. “2002 Podded propulsors: Some design and service experience.” in The Motor Ship Marine Propulsion Conference, Copenhagen, Denmark, pp. 1-10.
ISLAM, M. F. ”2004 Numerical investigation on effects of hub taper angle and Pod-strut geometry on propulsive performance of pusher Propeller configurations.” Master’s of Engineering thesis (2004), Memorial University of Newfoundland, Canada, 136 p.
ISLAM, M. F., TAYLOR, R., QUINTON J., VEITCH, B., BOSE, N., COLBOURNE, B. and LIU, P. “2004 Numerical investigation of propulsive characteristics of podded propeller.” In Proc. of the 1st International Conference on Technological Advances in Podded Propulsion (2004), pp. 513-525. JOHNSON, G.W., HULSHOT, S., SANJI, A., BOWSER, R. “1991 A three-dimensional combined singularity potential code for marine propellers. Phase 1 Steady flow. Aerospace Engineering and Research Consultants Ltd. (AERCOL) 4925 Duffers St., Dowesview, ON, Canada M3H 5T6, DREA CR/91/889, Defense Research Establishment Atlantic.
LIU, P. “1996 A time-domain panel method for oscillating propulsors with both chordwise and spanwise flexibility. PhD thesis, Memorial University of Newfoundland, Canada, 226 p.
LIU, P. “2002 Design and implementation for 3D unsteady CFD data visualization using object-oriented MFC with OpenGL.” Computational Fluid Dynamics Journal, 11 (2002): 335-345.
LIU.,P., BOSE, N. and COULBORNE, B. “2001(a) Automated marine propeller geometry generation of arbitrary configuration and a wake model for far field momentum prediction.” International Shipbuilding Progress, 48(2001): 351-381.
LIU, P., BOSE, N. and COLBOURNE, B. 2001
(b)
Incorporation of a Critical Pressure Scheme into a Time Domain Panel Method for Propeller Sheet Cavitation. International Workshop on Ship Hydrodynamics (IWSH), Wuhan, China, 22-26.LIU.,P., BOSE, N. and COULBORNE, B. “2002 A critical pressure based panel method for prediction of unsteady loading of marine propellers under cavitation.," in CFD2002: 5 p.
OUCHI, K. “1988 Research and development of PBCF to enhance propeller efficiency." in Tenth Motor Ship International Marine Propulsion Conference (March 1988), 12 p.
RAINS, D. A. and VANLANDINGHAM, D. J. “1981 Hydrodynamics of podded ship propulsion,” Journal of Hydronautics, 14:1 (1981): 18-24.
TOXOPEUS, S. and LOEFF, G.“2002 Manoeuvring aspects of fast ships with pods.” in Euro Conference on High-Performance Marine Vehicles HIPER'02, Bergen, pp. 392-406.
TRIANTAFYLLOU, M., HOVER, F. and STETTLER, J. “2003 System dynamics and control of podded propulsors.”, First year report, Dept. of Ocean Engineering, Massachusetts Institute of Technology, USA, 14 p.
WALKER, D. “1995 The effect of propeller blade root fillet design on cavitation performance." Tech. Rep. CR-1995-04, Marineering Ltd. and Institute for Marine Dynamics, National Research Council, St. John's, NL, Canada.