Publisher’s version / Version de l'éditeur:
Proceedings of the Illuminating Engineering Society of North America (IESNA) Annual Conference, 2015-11-09
READ THESE TERMS AND CONDITIONS CAREFULLY BEFORE USING THIS WEBSITE. https://nrc-publications.canada.ca/eng/copyright
Vous avez des questions? Nous pouvons vous aider. Pour communiquer directement avec un auteur, consultez la première page de la revue dans laquelle son article a été publié afin de trouver ses coordonnées. Si vous n’arrivez Questions? Contact the NRC Publications Archive team at
PublicationsArchive-ArchivesPublications@nrc-cnrc.gc.ca. If you wish to email the authors directly, please see the first page of the publication for their contact information.
NRC Publications Archive
Archives des publications du CNRC
This publication could be one of several versions: author’s original, accepted manuscript or the publisher’s version. / La version de cette publication peut être l’une des suivantes : la version prépublication de l’auteur, la version acceptée du manuscrit ou la version de l’éditeur.
Access and use of this website and the material on it are subject to the Terms and Conditions set forth at
Factors affecting the performance of ceiling-based PIR occupancy
sensors in offices
Newsham, Guy R.; Xue, Henry; Valdes, Julio J.; Scarlett, Elizabeth;
Arsenault, Chantal; Burns, Greg J.; Kruithof, Steve; Shen, Weiming
https://publications-cnrc.canada.ca/fra/droits
L’accès à ce site Web et l’utilisation de son contenu sont assujettis aux conditions présentées dans le site LISEZ CES CONDITIONS ATTENTIVEMENT AVANT D’UTILISER CE SITE WEB.
NRC Publications Record / Notice d'Archives des publications de CNRC: https://nrc-publications.canada.ca/eng/view/object/?id=1e9c0cba-32c2-445e-96f1-609dc39b9b9c https://publications-cnrc.canada.ca/fra/voir/objet/?id=1e9c0cba-32c2-445e-96f1-609dc39b9b9c
Factors Affecting the Performance of Ceiling-based PIR Occupancy
Sensors in Offices
Guy R. Newsham, Henry Xue, Julio J. Valdes, Elizabeth Scarlett, Chantal Arsenault, Greg J. Burns, Steve Kruithof, Weiming Shen
National Research Council (NRC) – Construction, Ottawa, ON, Canada guy.newsham@nrc-cnrc.gc.ca
Abstract
As part of a larger project on occupancy sensing, we collected 5 Hz occupancy detection data
(aggregated to the 15-second level) from a commercially-available ceiling-based PIR sensor. Identical sensors were deployed in 28 offices for up to a month per office. Ground truth data were collected simultaneously using a pressure-sensitive floor mat. We evaluated the accuracy (overall, as well as false positives and false negatives) and energy-saving potential in each office with various timeout periods applied post-hoc. The data revealed relatively poor overall detection performance at the 15-second level. Adding a timeout period of 20 minutes produced reasonable false negative performance for the top quartile of offices, but reduced potential energy savings to 65% of the unoccupied time. The results support efforts to improve occupancy sensing in order to garner greater energy savings.
Introduction
Current energy codes for commercial buildings in North America require a lighting control device for many space types (including private, but not open-plan, offices) that turns off the lights no later than 30 minutes after all occupants have left the space [ASHRAE, 2010; CCBFC, 2011]. Recent revisions to these codes will lower the timeout period to 20 minutes. Williams et al. [2012] summarize numerous research studies suggesting average energy savings of 22% due to occupancy sensors in offices.
Nevertheless, despite their growing deployment, there are surprisingly few studies looking at the basic accuracy of such sensors in actual installations. The studies quoted by Williams et al. [2012] were often conducted in highly-curated environments where the hosts and study team likely invested substantial resources in ensuring superior system performance through careful commissioning and maintenance. Indeed, some of these studies showed energy penalties, and the savings from actual installations were 25% lower, on average, than those from simulations. It is also possible to save energy in ways that will not be tolerated by occupants in the long term, by inaccurate sensing and switching off lights when a space is occupied; we all have anecdotes to illustrate this scenario [e.g. Fairley, 2013].
The few prior studies that have addressed sensor accuracy more systematically have demonstrated performance that is often disappointing. Tiller et al. [2010] observed very different sensing accuracy (measured every second) from three identical occupancy sensors installed on three walls of the same office, and all sensors reported substantially lower occupancy than “ground truth” (human observers). However, data were only collected from two offices over a two-day period. NLPIP [1998] performed extensive laboratory testing of many occupancy sensors from multiple vendors, using a robotic arm to test the basic response of the sensors to various ranges of motion within the claimed sensor coverage area. They found many sensors unresponsive to small- and medium-sized motion triggers.
To offset the sometimes poor instantaneous occupancy detection, lighting control systems build in a timeout period, requiring a space to be sensed as vacant for many minutes before lights are switched off; this then wastes energy by leaving lights on when the space is genuinely vacant. Estimates show the
theoretical potential to almost double energy savings by reducing timeout periods from 20 minutes to 1 minute [Dikel & Newsham, 2014].
Methods and Procedures
As part of a larger study on occupancy sensing, we examined the accuracy of commercial ceiling-based PIR (passive infrared) occupancy sensors. Sensors (same vendor and model) were installed in 28 offices and response was measured at 5 Hz for between 13 and 31 days per office. Ground truth was measured at the same frequency using pressure-sensitive floor mats covering the most frequently occupied areas of each office. Figure 1 shows an example installation. Occupancy sensor installation followed the manufacturer’s instructions. However, these instructions allow considerable room for installer choice based on practical considerations. Although our installation might not have been optimized for each specific office, we submit that this is also true for commercial installations. Note that lighting was not controlled by the PIR or any other sensors. We applied several data filtering and cleaning procedures, including removing days of data with suspect ground truth, removal of weekends, public holidays, and the first and last days of installation (which included researcher disruptions, and were thus not “normal” days). We also removed any overnight recordings to focus the dataset on periods of potential occupancy; overall accuracy may be artificially enhanced with long periods of correctly reported overnight absence. Data were aggregated to a 15-second level and binarized, if a majority of the 5 Hz readings in a 15-second window indicated occupancy then the value for ground truth or PIR sensor (respectively) was set to a value of “1”, otherwise “0”1. The PIR sensor exhibited a
data reporting quirk, in that once a space was genuinely vacated it continued to report a detection signal for a further 30 seconds. This appeared to be an issue with the sensor packaging and not the detector itself. To avoid unfairly penalizing the accuracy assessment we wrote a script to detect and correct these data. The final dataset consisted of more than 677,000 15-second readings from more than 350 office-days. The analysis in this paper uses the last 10% of the dataset for each office (67,729 readings).
While overall accuracy is important, it is more important to understand the frequency of the different types of errors that occur. False positives (FP) are instances when the sensor reports a space is occupied when in fact it is not. This can happen when someone passes close to an empty office and is “seen” by the sensor in the office; this leads to energy waste. More concerning are false negatives (FN), instances when the sensor reports a space is not occupied when in fact it is. This leads to lights being switched off when the space is occupied, causing annoyance, possible system sabotage and lost savings opportunity. As discussed above, in lighting control applications timeout periods are applied to compensate for inaccurate ceiling PIR detection performance at short timescales. In error counting terms, adding a
1We also conducted analysis where any single reading at the 5 Hz level within a 15-second window indicated
Figure 1. Example installation in office 19CN, showing temporary PIR sensor on the ceiling (black box), and pressure-sensitive floor mats (brown, edged with duct tape).
timeout reduces the number of FNs, at the expense of increasing FPs. Our results show each error type separately, calculated for various timeout periods2.
Results
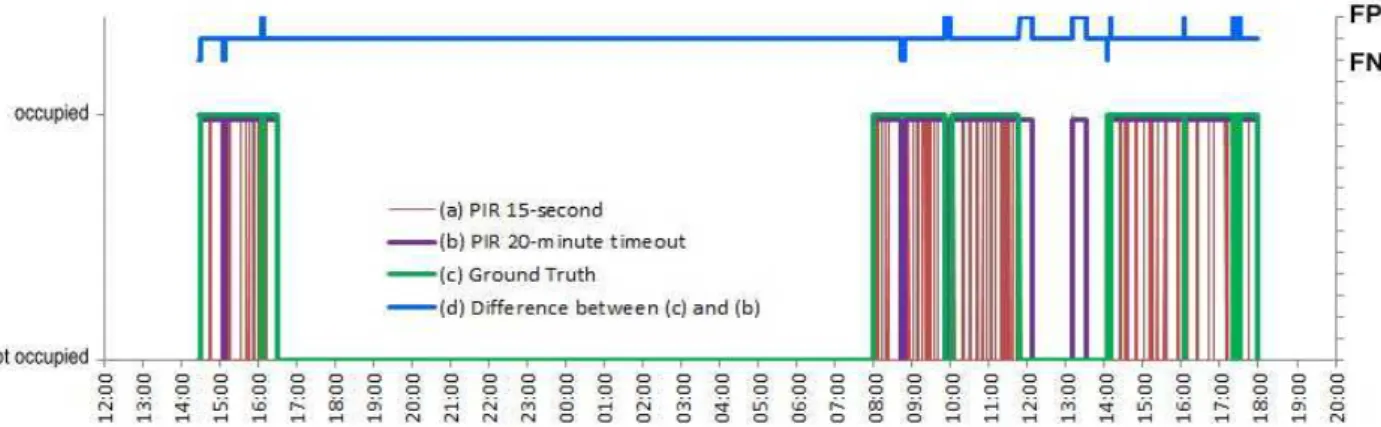
Figure 2 illustrates the data and analysis approach for a single example office. The 15-second PIR data features many FNs (Tiller et al. [2010] report similar data at the 1-second level), and an FP episode (around 13:10 on the second day). Application of the 20-minute timeout to the PIR data eliminates most FNs, but introduces more FPs. Overall performance across all offices revealed that at the 15-second level FNs had a much greater prevalence than FPs (overall 29,200 vs. 650), and we focus subsequent analysis in this paper on data with a 20-minute timeout applied.
Figure 2. Typical data set for office 19CN, showing raw 15-second data (green: ground truth; red: PIR response), the application of a 20-minute timeout to the PIR data (purple), and the resulting errors vs. ground truth (blue, right y-axis).
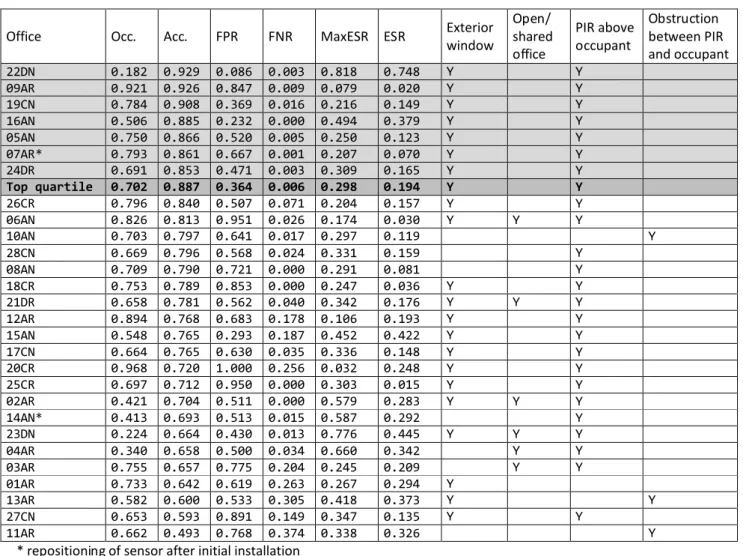
Table 1 shows key performance metrics after a 20-minute timeout was applied to the PIR data. The top-quartile, based on overall accuracy, is highlighted in grey.
Discussion
Table 1 clearly shows a very wide range of performance between identical PIR sensors installed in different offices. The installation characteristics did not display huge variety, but there are hints as to which types of installation were more successful. All offices in the top quartile were private offices with the PIR sensor installed directly above the occupant’s typical seated location. While there were poor performers with this geometry too, three of the four offices where the PIR was installed elsewhere on the ceiling were among the four poorest performers. This was likely because of obstructions that blocked line-of-sight between the sensor and seated occupant, obstructions which included the
computer monitor, piles of paper, desk lamps, plants etc. Interestingly, the manufacturer’s instructions suggested installing the sensor in an offset position and not in the centre of the office or directly above the occupant. Sensors in shared/open offices tended to perform more poorly, which might be expected from the potential for FPs.
Many of the poor performers, if connected to lighting control, would have quickly been reconfigured, removed, or sabotaged3. We can perhaps focus on the top-quartile of performers as an optimistic view
of a well-commissioned system in the field. Table 1 shows that even the top quartile, with a 20-minute
2The corollaries of these are TP (true positives) – when the sensor reports a space is occupied when indeed it is –
and TN (true negatives) – when the sensor reports a space is not occupied when indeed it is not.
timeout, would only realize 65% (0.194/0.298) of potential occupancy-related savings; a shorter timeout period (1 minute) to capture more savings would have been accompanied by an unacceptable level of FNs (FNR=0.340). Indeed, even a 20-minute timeout might not be adequate. Taking office 19CN as an example from the top quartile, Table 1 shows an overall accuracy of 90.8%, with an FNR of 1.6%, which sounds impressive. But reference to Figure 2 shows that this FNR still equates to 4 FN events in 1½ days, which, if linked to light switching, would likely be annoying to the occupant.
Table 1. Key performance metrics for PIR sensors in all offices, with office/PIR characteristics. A timeout of 20 minutes has been applied, and offices are rank ordered by overall accuracy. Occ.=actual fraction of time office occupied; Acc.=fraction of time PIR sensor correct; FPR=FP/(TN+FP); FNR=FN/(FN+TP); MaxESR=maximum possible energy saving ratio by switching off lights when office unoccupied, compared to lights being on from first arrival to last departure; ESR=energy savings ratio that would be achieved by PIR with 20-minute timeout.
Office Occ. Acc. FPR FNR MaxESR ESR Exterior window Open/shared office PIR above occupant Obstruction between PIR and occupant 22DN 0.182 0.929 0.086 0.003 0.818 0.748 Y Y 09AR 0.921 0.926 0.847 0.009 0.079 0.020 Y Y 19CN 0.784 0.908 0.369 0.016 0.216 0.149 Y Y 16AN 0.506 0.885 0.232 0.000 0.494 0.379 Y Y 05AN 0.750 0.866 0.520 0.005 0.250 0.123 Y Y 07AR* 0.793 0.861 0.667 0.001 0.207 0.070 Y Y 24DR 0.691 0.853 0.471 0.003 0.309 0.165 Y Y Top quartile 0.702 0.887 0.364 0.006 0.298 0.194 Y Y 26CR 0.796 0.840 0.507 0.071 0.204 0.157 Y Y 06AN 0.826 0.813 0.951 0.026 0.174 0.030 Y Y Y 10AN 0.703 0.797 0.641 0.017 0.297 0.119 Y 28CN 0.669 0.796 0.568 0.024 0.331 0.159 Y 08AN 0.709 0.790 0.721 0.000 0.291 0.081 Y 18CR 0.753 0.789 0.853 0.000 0.247 0.036 Y Y 21DR 0.658 0.781 0.562 0.040 0.342 0.176 Y Y Y 12AR 0.894 0.768 0.683 0.178 0.106 0.193 Y Y 15AN 0.548 0.765 0.293 0.187 0.452 0.422 Y Y 17CN 0.664 0.765 0.630 0.035 0.336 0.148 Y Y 20CR 0.968 0.720 1.000 0.256 0.032 0.248 Y Y 25CR 0.697 0.712 0.950 0.000 0.303 0.015 Y Y 02AR 0.421 0.704 0.511 0.000 0.579 0.283 Y Y Y 14AN* 0.413 0.693 0.513 0.015 0.587 0.292 Y 23DN 0.224 0.664 0.430 0.013 0.776 0.445 Y Y Y 04AR 0.340 0.658 0.500 0.034 0.660 0.342 Y Y 03AR 0.755 0.657 0.775 0.204 0.245 0.209 Y Y 01AR 0.733 0.642 0.619 0.263 0.267 0.294 Y 13AR 0.582 0.600 0.533 0.305 0.418 0.373 Y Y 27CN 0.653 0.593 0.891 0.149 0.347 0.135 Y Y 11AR 0.662 0.493 0.768 0.374 0.338 0.326 Y
* repositioning of sensor after initial installation
These results suggest the need for more evaluation of occupancy sensor performance in the field. This would support the long-term market penetration of this energy-saving technology by gaining a better understanding of the factors affecting the successful deployment of current technology. Given that North American energy codes require occupancy sensing in many new space types, there should be many locations and opportunities for data collection – researchers no longer have to install the systems they wish to study.
Conclusions
There is considerable opportunity for greater energy savings if timeout periods can be shortened, which requires improvements in the accuracy of sensing technology, particularly with respect to false
negatives. This may be achieved via a multi-pronged approach: Optimizing installation of existing technology
Improvements in PIR sensing technology
Leveraging the internet of things (e.g. mobile devices, IT infrastructure [Melfi et al., 2011]) to provide supplemental occupancy-related information to improve detection algorithms The proliferation of occupancy sensors for lighting systems due to energy code requirements offers a vast set of opportunities to evaluate real-world performance, and occupant interaction with the control systems. Better performing sensors may then facilitate the use of lighting systems as a convenient platform for information to more intelligently manage other building systems (e.g. HVAC, security).
Acknowledgements
This work was funded by the ecoENERGY Innovation Initiative (EcoEII) administered by Natural
Resources Canada (NRCan), by the National Research Council Canada, and the Conservation Fund of the Independent Electricity System Operator (formerly the Ontario Power Authority). We are grateful to the building occupants who consented to allowing us to collect data in their offices.
References
American Society of Heating, Refrigerating and Air-Conditioning Engineers (ASHRAE). 2010. ANSI/ASHRAE/IES 90.1, Energy Standard for Buildings Except Low-Rise Residential Buildings, 2010, ASHRAE: Atlanta, USA.
Canadian Commission on Building and Fire Codes (CCBFC). 2011. National Energy Code of Canada for Buildings, National Research Council of Canada: Ottawa, Canada.
Dikel, E.E.; Newsham, G.R. 2014. A quick timeout. LD+A, December, 54-56. Fairley, P. 2013. Power to the people. GreenSource. URL:
http://greensource.construction.com/features/other/2013/1305-power-to-the-people.asp Melfi, R.; Rosenblum, B.; Nordman, B.; Christensen, K. 2011. Measuring building occupancy using existing network infrastructure. International Green Computing Conference (Orlando, USA), 8 pages. National Lighting Product Information Program (NLPIP). 1998. Occupancy Sensors: Motion Sensors for Lighting Control. Lighting Research Center, Troy, NY, USA.
Tiller, D.K.; Guo, X.; Henze, G.P.; Waters, C.E. 2010. Validating the application of occupancy sensor networks for lighting control. Lighting Research & Technology, 42(4), 399-414.
Williams, A.; Atkinson, B.; Garbesi, K.; Page, E.; Rubinstein, F. 2012. Lighting controls in commercial buildings. Leukos, 8(3), 161-180.