Publisher’s version / Version de l'éditeur:
Electrochimica Acta, 56, 3, pp. 1505-1511, 2011-01-01
READ THESE TERMS AND CONDITIONS CAREFULLY BEFORE USING THIS WEBSITE. https://nrc-publications.canada.ca/eng/copyright
Vous avez des questions? Nous pouvons vous aider. Pour communiquer directement avec un auteur, consultez la première page de la revue dans laquelle son article a été publié afin de trouver ses coordonnées. Si vous n’arrivez pas à les repérer, communiquez avec nous à [email protected].
Questions? Contact the NRC Publications Archive team at
[email protected]. If you wish to email the authors directly, please see the first page of the publication for their contact information.
NRC Publications Archive
Archives des publications du CNRC
This publication could be one of several versions: author’s original, accepted manuscript or the publisher’s version. / La version de cette publication peut être l’une des suivantes : la version prépublication de l’auteur, la version acceptée du manuscrit ou la version de l’éditeur.
For the publisher’s version, please access the DOI link below./ Pour consulter la version de l’éditeur, utilisez le lien DOI ci-dessous.
https://doi.org/10.1016/j.electacta.2010.08.019
Access and use of this website and the material on it are subject to the Terms and Conditions set forth at
Application of iron-based cathode catalysts in a microbial fuel cell
Birry, L.; Mehta, P.; Jaouen, F.; Dodelet, J.-P.; Guiot, S.R.; Tartakovsky, B.
https://publications-cnrc.canada.ca/fra/droits
L’accès à ce site Web et l’utilisation de son contenu sont assujettis aux conditions présentées dans le site LISEZ CES CONDITIONS ATTENTIVEMENT AVANT D’UTILISER CE SITE WEB.
NRC Publications Record / Notice d'Archives des publications de CNRC:
https://nrc-publications.canada.ca/eng/view/object/?id=16bc91bb-f854-41e6-9d66-580ea9f43e7d
https://publications-cnrc.canada.ca/fra/voir/objet/?id=16bc91bb-f854-41e6-9d66-580ea9f43e7d
Contents lists available atScienceDirect
Electrochimica Acta
j o u r n a l h o m e p a g e :w w w . e l s e v i e r . c o m / l o c a t e / e l e c t a c t a
Application of iron-based cathode catalysts in a microbial fuel cell
L. Birry
a, P. Mehta
b, F. Jaouen
a, J.-P. Dodelet
a, S.R. Guiot
b, B. Tartakovsky
b,∗aInstitut National de la Recherche Scientifique, Énergie, Matériaux, et Télécommunication, Varennes, Québec J3X 1S2, Canada bBiotechnology Research Institute, National Research Council of Canada, 6100 Royalmount Ave, Montreal H2P 2R2, QC, Canada
a r t i c l e
i n f o
Article history: Received 9 June 2010
Received in revised form 3 August 2010 Accepted 4 August 2010
Available online 11 August 2010
Keywords: MFC Cathode FeAc ClFeTMPP FePc
a b s t r a c t
Catalysts for the oxygen reduction reaction (ORR) in a microbial fuel cell (MFC) were prepared by the impregnation on carbon black of FeIIacetate (FeAc), Cl–FeIIItetramethoxyphenyl porphyrin (ClFeTMPP),
and FeIIphthalocyanine (FePc). These materials were subsequently pyrolyzed at a high temperature. The
ORR activity of all Fe-based catalysts was measured at pH 7 with a rotating disk electrode (RDE) and their performance for electricity production was then verified in a continuous flow MFC. Catalysts prepared with FeAc and pyrolyzed in NH3showed poor activity in RDE tests as well as a poor performance in
a MFC. The ORR activity and fuel cell performance for catalysts prepared with ClFeTMPP and FePc and pyrolyzed in Ar were significantly higher and comparable for both precursors. The iron loading was optimized for FePc-based catalysts. With a constant catalyst load of 2 mg cm−2in a MFC, the highest
power output (550–590 mW/m2) was observed when the Fe content was 0.5–0.8 wt%, corresponding to
only 0.01–016 mg Fe/cm2. A similar power output was observed using a Pt-based carbon cloth cathode
containing 0.5 mg Pt/cm2. Long-term stability of the Fe-based cathode (0.5 wt% Fe) was confirmed over
20 days of MFC testing.
Crown Copyright © 2010 Published by Elsevier Ltd. All rights reserved.
1. Introduction
Microbial fuel cells (MFCs) have been shown to produce electric-ity from a wide range of organic materials, including wastewater with a complex and varying composition of organic matter. This opens up a broad range of potential MFC applications where energy is produced from wastewater, which otherwise has to be treated, resulting in a significant consumption of electricity.
MFC development has significantly progressed due to intensive research[1,2]. Nevertheless, further improvements in MFC design and materials, including improved cathode long-term stability and replacement of expensive Pt-based cathodes, are required. MFCs are typically operated at pH values close to 7, while either strongly alkaline or strongly acidic electrolytes are used in conventional low temperature fuel cells. The sluggish kinetics of the oxygen reduc-tion reacreduc-tion (ORR) at a neutral pH and low temperatures at which MFCs are operated results in high energetic losses at the cathode, even at small currents.
In pure electrolytic solutions, Pt is the best known oxygen reducing catalyst. However MFCs are often intended for wastew-ater treatment. Therefore, inhibition of Pt activity by a variety of chemicals present in wastewater might be anticipated. Following Jasinski’s discovery of the catalytic properties of Co
phthalocya-∗ Corresponding author. Tel.: +1 514 496 2664; fax: +1 514 496 6265. E-mail address:[email protected](B. Tartakovsky).
nine for the oxygen reduction reaction[3], Co/N/C and Fe/N/C ORR electrocatalysts have been studied worldwide and their applica-tion as non-noble metal catalyst (NNMC) for cathodes in MFCs has recently been demonstrated [4–10]. Such catalysts can be prepared, for example, by loading Co– or Fe–N4macrocycles
(por-phyrins, phthalocyanines, tetraazannulenes) on a carbon support and pyrolyzing these materials at a high temperature in an inert atmosphere [9,11–13]. With such macrocycles, the metal (Co or Fe) and the nitrogen, both needed to obtain good electrocatalysts, are impregnated together on the carbon support since they are part of the same Co– or Fe–N4 macrocycle. It is also possible to
obtain NNMC electrocatalysts for the ORR by providing the metal and the nitrogen precursors as two different molecules[14–16]. For example, the pyrolysis of iron acetate (as the metal precursor) in an NH3atmosphere (as the nitrogen precursor) has often been
used[15,17–19]. With such precursors, a high temperature heat-treatment is absolutely necessary to transform them into active catalysts for ORR.
The influence of the catalyst loading on MFC power out-put has already been investigated[7–9]. It was shown that the increase of the catalyst load is an effective approach to improve the cathode performance in a MFC. In this study we continue to investigate the performance of Fe-based cathodes in a neutral pH solution by, first, comparing several Fe and/or N precursors and then increasing the Fe content in the catalyst while maintaining a constant cathode catalyst loading of 2 mg cm−2 in MFC tests.
This method provides a constant thickness of the catalyst layer
0013-4686/$ – see front matter. Crown Copyright © 2010 Published by Elsevier Ltd. All rights reserved. doi:10.1016/j.electacta.2010.08.019
1506 L. Birry et al. / Electrochimica Acta 56 (2011) 1505–1511 while varying the volumetric density of the catalytic sites on the
cathode.
2. Experimental
2.1. Media composition and analytical measurements
The stock solution of nutrients for MFC operation was composed of (g L−1): 18.6 NH
4Cl, 148.09 KCl, 64.04 K2HPO4, 40.69 KH2PO4,
0.830 yeast extract, and 55.34 NaC2H3O2(anhydrous Na acetate).
The stock solution of microelements contained (g L−1): FeCl 2·4H2O
(2), H3BO3 (0.05), ZnCl2 (0.05), CuCl2 (0.03), MnCl2·4H2O (0.5),
(NH4)6Mo7O24·4H2O (0.05), AlCl3(0.05), CoCl2·6H2O (0.05), NiCl2
(0.05), EDTA (0.5) and 1 L/L of 36% HCl. The dilution water used during MFC operation contained 1 mL of the microelement stock solution per liter of distilled water. The combined solution (dilution water, microelements, and nutrients) had a conductiv-ity of 12–14 mS cm−1 and a pH of 6.9–7.1. The buffer solution
used in rotating disk electrode (RDE) experiments contained 0.1 M NaH2PO4and 0.1 M Na2HPO4resulting in a pH of 7. The chemicals
used were all of analytical grade. The stock solutions were filtered, sterilized and maintained at 4◦C until used.
Carbon source (as Na acetate) concentration in the MFC effluent was analyzed in an Agilent 6890 gas chromatograph (Wilmington, DE) equipped with a flame ionization detector. The method details are provided in Tartakovsky et al.[20]. The pH and conductivity of the effluent were measured periodically using a pH meter and a conductivity meter, respectively.
2.2. Synthesis of Fe-based catalysts
Iron precursors used in this study were FeII acetate (FeAc),
Cl–FeIII tetramethoxyphenyl porphyrin (ClFeTMPP), and FeII
phthalocyanine (FePc). FeAc (Sigma–Aldrich) was first impregnated on carbon Vulcan XC-72R (Cabot) with a loading of 0.2 wt% Fe and then pyrolyzed under NH3flow at 950◦C for 25 min. ClFeTMPP
(Tri-PorTech GmbH) was impregnated on carbon Vulcan XC-72R (Cabot) in order to obtain a loading of 0.2 wt% Fe. This impregnation was fol-lowed by a pyrolysis under either (i) NH3flow at 950◦C for 20 min
or (ii) Ar flow for 30 min at 800◦C. Catalysts prepared similarly but
with an Fe content of 0.4 wt% Fe on the Ketjen Black (Akzo Nobel Chemicals Inc., Chicago, IL, USA) were also synthesized.
FePc-based catalysts were prepared by mixing FePc with Ketjen Black to obtain a loading from 0.2 to 1.0 wt% Fe. This was followed by pyrolysis under Ar flow for 1 h at 700◦C. The impregnation and
pyrolysis conditions are described in more details elsewhere[17]. A list of all cathodes prepared and tested in this study is provided inTable 1.
2.3. Ink and electrode preparation for Fe-based catalysts
The catalyst ink formulation used in RDE and MFC tests was the same: 10 mg of catalyst, 270 L of ethanol, 217 L of 5 wt% Nafion Table 1
List of cathodes tested.
No. Description Heat-treatment Tests 1 FeAc/Vulcan XC-72R (0.2 wt% Fe) NH3950◦C RDE/MFC
2 ClFeTMPP/Vulcan XC-72R (0.2 wt% Fe) NH3950◦C RDE/MFC
3 ClFeTMPP/Vulcan XC-72R (0.2 wt% Fe) Ar 800◦C RDE/MFC
4 ClFeTMPP/Vulcan XC-72R (0.4 wt% Fe) Ar 800◦C RDE/MFC
5 ClFeTMPP/Ketjen Black (0.4 wt% Fe) Ar 800◦C RDE/MFC
6 FePc/Ketjen Black (0.2 wt% Fe) Ar 700◦
C RDE/MFC 7 FePc/Ketjen Black (0.5 wt% Fe) Ar 700◦C RDE/MFC
8 FePc/Ketjen Black (0.8 wt% Fe) Ar 700◦C RDE/MFC
9 FePc/Ketjen Black (1.0 wt% Fe) Ar 700◦C RDE
10 46 wt% Pt/C (from Tanaka Kikinzoku) – RDE 11 30 wt% Pt/C (from E-tek) – MFC
solution in alcohol and 135 L of water. For the ink preparation in RDE tests, a K-salt of Nafion was prepared by adding 1 mL of a 3 M KCl solution into 10 mL of the 5 wt% Nafion solution resulting in the cation exchange (K+instead of H+). The cathodes for RDE were
prepared by dropping a 7 L aliquot of the ink on a glassy carbon electrode, resulting in a catalyst loading of 800 g cm−2.
For MFC cathode fabrication, the catalyst loading (carbon + Fe) was 2 mg cm−2. The first layer was obtained by spreading the ink on
the 66 cm2carbon paper electrode, using a mask and a brush.
Sev-eral successive layers were then deposited on top of each other to reach the loading of 2 mg cm−2. It was ascertained that the previous
layers were dry before adding another layer. 2.4. Pt electrode preparation for RDE measurements
An electrode made with 46 wt% Pt nanoparticles dispersed on Vulcan (Tanaka Kikinzoku Group, Tokyo, Japan), henceforth labeled as Pt/C, was used as a Pt benchmark. The ink formulation was 5 mg of catalyst (mass Pt + C), 40 L of a 5 wt% Nafion solution in alcohol, 222 L of ethanol and 10 L of distilled water. The ink was ultra-sonicated for 30 min and then shaken for 15 min, this cycle was repeated twice. Then a 7 L aliquot of ink was dropped on a glassy carbon electrode (0.196 cm2) and air-dried at room temperature,
resulting in a loading of 657 g of Pt + C/cm2.
2.5. Rotating disk electrode measurements
RDE measurements were performed either in a phosphate buffer solution (pH 7) or in a MFC media solution obtained by combining 1 L of the dilution water solution with 5 mL of the nutrient stock solution.
Measurements were performed at room temperature under atmospheric pressure. The counter electrode was a Pt wire and the reference electrode was a saturated calomel electrode (SCE). At 25◦C, the potential of a SCE is +0.24 V vs. a standard hydrogen
elec-trode (SHE) and 0.66 V vs. a reversible hydrogen elecelec-trode (RHE) at pH 7. Cyclic voltammograms (CVs) with a scan rate of 10 mV s−1
were recorded in N2- or O2-saturated solution. The Faradaic ORR
current was obtained by subtracting the current measured in the N2-saturated electrolyte from the current measured in the O2
-saturated electrolyte. 2.6. MFC design and operation
All cathodes were tested in an air–cathode MFC with the 50 mL anodic chamber constructed with nylon plates. The anodic chamber contained a 5 mm thick graphite felt anode measuring 10 cm × 5 cm (SGL Group, Germany). A cathode was attached to a wall of the anodic chamber and separated from the anode by a piece of J-cloth [21], such that the distance between the electrodes was 0.5–0.7 mm. The MFC was equipped with lines for influent, effluent and liquid recirculation. More details on MFC construction can be found elsewhere[22].
The MFC was inoculated with 10 mL of anaerobic sludge (Las-sonde Inc, Rougemont, QC, Canada), which had a concentration of 40–50 mg L−1of volatile suspended solids. The MFC was operated
at a temperature of 30–31◦C and continuously fed with a
solu-tion of nutrients and trace elements prepared as described above. A flow rate of 160–170 mL day−1was maintained corresponding to a
hydraulic retention time of 7–8 h in the anodic chamber. MFC oper-ation was started with a carbon cloth cathode with 0.5 mg Pt cm−2
(E-tek, BASF Fuel Cell Inc, Somerset, NJ, USA).
Throughout the MFC tests, the power output was maximized using a perturbation and observation maximum power point track-ing (MPPT) algorithm, which constantly adjusted the value of the external resistance (Rext) connected to the MFC so that it was
close to the MFC internal resistance [22,23]. Polarization tests were periodically carried out as follows. First, after disconnecting the external resistance for 30 min the open circuit voltage (OCV) was measured. Then the external resistance was re-connected and progressively decreased every 10 min with voltage and elec-trode potential measurements at the end of each period. Elecelec-trode potentials were measured using an Ag/AgCl electrode (+0.222 V vs. SHE at 25◦C) placed in the anodic compartment. The results
were expressed vs. a SHE. These measurements were used to plot the voltage vs. current density and the power vs. current density graphs. The linear part of the polarization curves produced was used to estimate the total internal resistance of the MFC[24].
3. Results and discussion
3.1. RDE measurements
The evaluation of the cathode activity in a MFC is a tedious task. Long starting times are required before a stable MFC performance is reached due to the uncontrollable variations in microbial activ-ity and densactiv-ity, which are typical for microbiological systems. Thus, this study was started with RDE tests to compare the catalytic activ-ity of Fe- and Pt-based cathodes. The RDE technique was also used to study the effect of pH and MFC media ingredients on the cathode activity. When a stationary electrode (0 rpm) is scanned at a given scan rate (here 10 mV s−1), the potential at which the current for the
O2reduction reaches a maximum (called peak potential and labeled
Epr) is characteristic of the catalytic activity for the ORR. The activity
was also measured with the electrode rotating at 1500 rpm. A shift of the reduction wave towards positive potentials corresponded to an increase of the activity.
Initially, all catalyst inks were prepared with a H-Nafion ionomer. Attempts to measure Eprvalues for all prepared Fe-based
catalysts in RDE tests resulted in a high variability of the obtained Eprvalues with deviations exceeding 0.1 V. As the use of the rotating
electrode at 1500 rpm did not solve this problem, it was
hypothe-sized that it might be caused by localized low pH regions, attributed to H+present initially in the Nafion ionomer used to prepare the
RDE cathodes. As a remedy to this problem, H+ions were replaced
by K+ions during the ink preparation, as described in Section2. This
procedure significantly increased the reproducibility with typical standard deviation of the measurements below 5 mV. All electrodes used in the following RDE tests were prepared using the K-Nafion ionomer instead of the commercial H-Nafion solution.
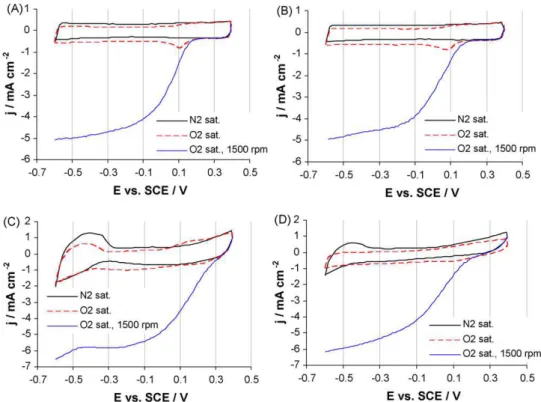
First, the activity of FePc/C and Pt/C catalysts was compared in cyclic voltammetry.Fig. 1A shows the cyclic voltammograms (CVs) obtained for the FePc/C catalyst (#7 inTable 1) in the pH 7 buffer solution. The solid line corresponds to the capacitive current mea-sured in the N2-saturated solution. When the solution is saturated
with O2, the ORR can be characterized by the peak potential, Epr, if
the electrode is idle (0 rpm, dashed line). The dotted line presents the current density measured at a rotation of 1500 rpm in a O2
-saturated solution. These results can be compared with the CVs obtained for the Pt/C catalyst in a pH 7 buffer solution (Fig. 1C). In this case, the peak for the O2reduction using the idle electrode
(dashed line) is not well defined. Thus, it is better to use the O2
reduction wave obtained at 1500 rpm to evaluate the activity of this Pt/C catalyst. The ORR activity of these cathodes was also mea-sured in the MFC media solution, as shown inFig. 1B and D. It can be seen, that the Pt/C catalyst is more active in the pH 7 buffer solution (dotted line inFig. 1C) than in the MFC media solution (dotted line,
Fig. 1D). This is probably due to the presence of metals and acetate in the MFC media solution that strongly adsorb on Pt. Pt is, indeed, well known to be very sensitive to even trace amounts of metals
[25]. This is confirmed by the measurement of the capacitive cur-rent in both solutions. In the N2-saturated pH 7 solution (solid line, Fig. 1C) the CV shows the peaks related to the H adsorption and desorption between −0.25 and −0.50 V vs. SCE. In the MFC solution (solid line,Fig. 1D), the intensity of these H peaks decreases. This is certainly due to the adsorption of metals and other impurities on the Pt/C catalyst. Their adsorption also inhibits the ORR on the Pt/C catalyst.
Fig. 1. Cyclic voltammograms (at 10 mV s−1) obtained for FePc/C catalyst #7, in (A) the pH 7 buffer solution and (B) the MFC solution saturated with N
2or O2; and for Pt/C
1508 L. Birry et al. / Electrochimica Acta 56 (2011) 1505–1511 In the case of FePc/C catalysts, the ORR activity measured in the
MFC media solution (Fig. 1B) is also lower than the one obtained in the pH 7 buffer solution, as illustrated inFig. 1A. The Epris shifted
by approximately 0.03 V. The limiting current density obtained at 1500 rpm in the O2-saturated MFC solution (dotted line inFig. 1B)
is also slightly smaller than the one in the pH 7 solution, while the capacitive current (solid line) remains the same in both solutions. For an apparent 4e ORR at 1500 rpm, a limiting current density of about 6 mA cm−2is expected (based on the diffusion flux of O
2from
the electrolyte to the electrode through the quiescent film of elec-trolyte found near the electrode surface (Sawyer et al.[26], p. 230). We observed approximately 5 mA cm−2. It is possible that the ORR
does not proceed through a complete 4e pathway on Fe-based cata-lysts. A more detailed investigation involving H2O2measurements
might be useful to elucidate the exact pathway.
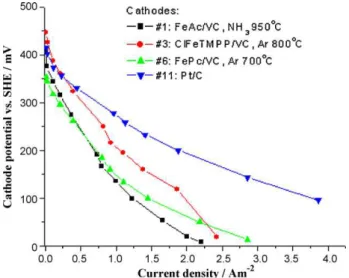
The Eprvalues obtained for RDE tests with a pH 7 (filled
sym-bols) or MFC (empty symsym-bols) solution, for all catalysts are shown inFig. 2. In particular, the catalyst made with FeAc as the Fe pre-cursor and heat-treated at 950◦C in NH
3flow (squares inFig. 2;
catalyst #1 inTable 1) is less active towards the ORR at a neutral pH than all other catalysts made with the same nominal Fe loading of 0.2 wt% (catalysts 2, 3 and 6). When ClFeTMPP was used as the Fe precursor instead of FeAc, while retaining the heat-treatment in NH3, the activity was improved (circles; catalyst #2 inTable 1). The
ORR activity was further improved with ClFeTMPP by doing a heat-treatment in Ar at 800◦C instead of NH
3at 950◦C (triangles; catalyst
#3). Doubling the iron content in a catalyst made with ClFeTMPP and pyrolyzed at 800◦C in Ar (triangles at 0.4 wt% Fe on x-axis;
catalyst #4) gave an activity similar to that of sample #3. From this series of experiments, the pyrolysis of ClFeTMPP at 800◦C in Ar was
considered as the optimal procedure for ORR in neutral media. The use of a carbon support with a higher surface area than Vul-can XC-72R, such as Ketjen Black, was then tested with ClFeTMPP as the Fe precursor (filled triangle at 0.4 wt% Fe labeled Ketjen Black in
Fig. 2; catalyst #5) A higher surface area is expected to improve the dispersion of the Fe precursor during the impregnation step. This should lead to an increased ORR activity, which is indeed observed inFig. 2when the activities of catalysts #4 and #5 are compared. Ketjen Black was therefore used as the carbon support for further optimizations.
The molecular structure of FePc is similar to that of ClFeTMPP. They are both FeN4macrocycles. However, the cost of FePc is about
2.5 times lower than that of ClFeTMPP (on a 10 g basis). For this
Fig. 2. Peak potential for the O2reduction, Epr, vs. the Fe content for all the INRS
catalysts, obtained in the pH 7 buffer solution and the MFC solution.
reason, it was decided to optimize the Fe content using catalysts made with FePc and Ketjen Black pyrolyzed in Ar.
Furthermore, it was also found, by comparing catalysts #7 and #5 inFig. 2, that using 0.5 wt% Fe as FePc and a pyrolysis tem-perature of 700◦C in Ar produced a catalyst (#7) with an activity
similar to that of catalyst #5. The latter was made with 0.4 wt% Fe as ClFeTMPP but after a pyrolysis treatment in Ar at 800◦C instead
of 700◦C. As FePc is less expensive than ClFeTMPP, the increased
load of FePc vs. that of ClFeTMPP required to obtain a similar ORR activity is compensated in terms of cost of catalyst production by lowering the pyrolysis temperature from 800 to 700◦C.
Catalysts 6–9 were prepared similarly, except for the Fe content ranging from 0.2 to 1 wt% Fe. For this series, there is a significant increase in activity with an increase in Fe content. This demon-strates that by increasing the density of catalytic sites on the NNMCs, the ORR activity is improved. The optimum Fe-based cat-alysts (in terms of activity and cost) were therefore prepared with FePc as the Fe (and N) precursor impregnated at a loading ≥0.5 wt% Fe on Ketjen Black and pyrolyzed at 700◦C in Ar. These Fe-based
cat-alysts were expected to be less inhibited than Pt/C by the adsorption of trace metals and acetate present in the MFC media solution[8].
Fig. 3shows the Faradaic current density obtained at 1500 rpm in the O2-saturated solutions for FePc/C catalysts and the Pt/C
cat-Fig. 3. ORR faradic current density obtained at 1500 rpm and 10 mV s−1for (A) the
FePc/C catalysts and the Pt/C catalyst in the pH 7 buffer solution and (B) the MFC solution saturated in O2.
alyst.Fig. 3A shows that the Pt/C catalyst has a better ORR activity than the FePc/C catalysts in the pH 7 buffer solution. But when the measurements are done in the O2-saturated MFC media solution
(Fig. 3B) catalysts #8 (green dash-dotted line) and #9 (red dashed line) display an ORR activity very similar to that of Pt/C. With a further increase in the Fe content, the catalytic activity slightly improved (for interpretation of the references to color in this text, the reader is referred to the web version of the article). Overall, it was concluded that for operating a cathode in a MFC media solu-tion at a neutral pH, a Fe concentrasolu-tion between 0.5 and 0.8% might be considered near optimal. This is in agreement with the results presented in Yu et al.[8].
3.2. MFC tests
Following the RDE tests, the activity of selected cathodes was tested in a MFC. As described in Section2the MFC was operated with each cathode until observing a stable power output for at least 2–3 days. All cathodes were tested using the same anode. This approach minimized variations in MFC power output related to the differences in microbial populations of the anode. MFC oper-ation was started with a carbon cloth Pt/C cathode. Once a stable power output was observed, the Pt/C cathode was replaced with NNMC cathodes made from FeAc, ClFeTMPP and FePc iron precur-sors (cathodes #1, 2–3 and 6, respectively). For this comparison, all cathodes were prepared using the same Fe content (0.2 wt% Fe) and same catalyst loading but under different pyrolysis conditions as outlined inTable 1. Polarization tests were carried out at the end of each cathode test.
Fig. 4compares cathode polarization curves of the three cath-odes along with the polarization curve of the Pt/C cathode. The catalyst with the highest ORR activity was that made with ClFeTMPP and pyrolyzed at 800◦C in Ar (catalyst #3). The catalyst
prepared with FeAc and pyrolyzed at 950◦C in NH
3demonstrated
the lowest ORR activity (catalyst #1). These results agree with the Eprvalues obtained in the RDE experiments shown inFig. 2. Also, the
results were consistent with the average power outputs observed during MFC operation with these cathodes (Table 2).
As discussed above, the FePc precursor is less expensive than ClFeTMPP. For this reason, FePc-based cathodes were chosen to validate results of the RDE tests in a MFC. Several FePc cath-odes with different Fe percentages were produced on Ketjen Black as described inTable 1. A comparison of FePc cathodes with an increasing percentage of Fe is presented in Fig. 5. Once again, the results of MFC and RDE tests were in a full agreement. Cath-ode performance was increased by increasing the Fe content from
Fig. 4. Cathode polarization curves obtained in the MFC for the catalysts made with three different Fe precursors loaded on the carbon support with the same nominal Fe content (0.2 wt%), and for the Pt/C catalyst.
Fig. 5. Cathode polarization curves obtained in an MFC for the FePc/C catalysts prepared with different Fe contents (wt% Fe), and the Pt/C catalysts.
Table 2
Performance of NNMC and Pt/C cathodes in RDE and MFC tests.
Electrode number RDE test MFC polarization test MFC operation Eprvs. SCEb(mV) Rint() Ranode() Rcathode() Highest Pout(mW m−2) Average Pout(mW m−2)
Buffer Medium 1 −31 −81 40.3 15 24.2 300 377 ± 6 2 68 17 149 9.6 116.9 134 343 ± 12 3 77 42 50 7.2 43.3 380 330 ± 14 4 70 42 28.2 4.9 22.8 620 538 ± 6 5 107 87 23.4 6.7 16.2 660 604 ± 13 6 55 17 32.2 6.2 25.3 280 344 ± 6 7 103.5 71 31.9 4.3 27.2 720 552 ± 9 7a 103.5 71 30.1 4.6 25.9 580 540 ± 68 8 111 86 28.8 8 21.4 676 588 ± 6 9 121.5 93 NM NM NM NM NM 10 NM NM NM NM NM NM NM 11 NM NM 19.3 6.5 12.3 820 643 ± 20
aAfter a 20-day test; NM: not measured.
1510 L. Birry et al. / Electrochimica Acta 56 (2011) 1505–1511
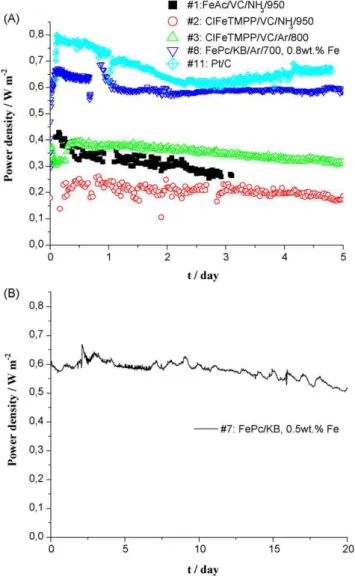
Fig. 6. (A) Power density obtained on NNMC and Pt/C catalysts during 5 days or (B) 20 days of cathode #7 testing. In all tests MFC external resistance was optimized by a MPPT algorithm to maximize power output.
0.2 to 0.5 wt%. A further increase in Fe percentage to 0.8 wt% Fe did not improve MFC power output. The average power out-put with cathode #8 (0.8 wt% Fe) was comparable with that of cathode #7 (0.5 wt% Fe) with the differences within the range of standard deviation (Table 2). Also, the MFC power output with these cathodes was comparable to that obtained with the Pt-based cathode.
If RDE tests can be used for a fast comparison of catalytic activ-ities, the long-term performance can only be demonstrated by a prolonged MFC operation.Fig. 6A presents the MFC power output measured during 5-day tests required for the comparison of the catalysts prepared with the three Fe precursors and the Pt cathode. The loss in activity was observed within the first 2 h after the startup of each test and this decrease was more pronounced for the Pt cath-ode. This is certainly due to the higher sensitivity of the Pt towards nutrients, trace metals or acetate present in the MFC medium, as shown in the RDE tests. All FePc-based catalysts showed good sta-bility with cathode #8 (made with FePc 0.8 wt% Fe) appearing to be more stable than the others. In addition to these relatively short tests, the long-term stability of cathode #7 (0.5 wt% Fe) was tested in a 20-day test as shown inFig. 6B. By the end of the test period MFC power output decreased but remained comparable to an output of a Pt-equipped MFC (400–500 mW m−2) operated for a comparable
amount of time. Visual inspection of the anodic compartment at the end of the test suggested that an increased resistance between the carbon felt and a current collector (titanium wire inserted in the felt) can explain the observed decrease in power output. Indeed, when the MFC was reassembled the power output was restored to values obtained during the first days of the test.
4. Conclusions
This study demonstrates the performance of iron-based cath-ode catalysts in a MFC. The RDE tests performed at pH 7 suggested the existence of H+rich spots in the Nafion ionomer present in the
catalyst layer deposited on the glassy carbon support, which led to a high variability of the measurements. Replacement of H+with
K+greatly improved the reproducibility of the measurements and
enabled a comparison between different Fe precursors and the opti-mization of the precursor loading on Ketjen Black, which was found to be the best carbon support. Overall, the use of the FeAc precursor pyrolyzed in NH3led to a low ORR activity, while both ClFeTMPP
and FePc precursors pyrolyzed in Ar showed a higher activity. The best performance was observed for Fe/C catalysts prepared with FePc impregnated at a loading of ≥0.5 wt% Fe on Ketjen Black and pyrolyzed at 700◦C in Ar.
The results of the RDE tests were validated in a continuous flow MFC fed with acetate. The correlation between RDE and MFC results is excellent. RDE measurements are therefore very valuable to rapidly screen potential catalysts for MFCs. The power output of a MFC equipped with Fe-based cathodes was comparable to a power output observed with a Pt-based cathode, while a significant reduc-tion in the cathode cost was achieved. Furthermore, continuous MFC operation in a 20-day test demonstrated a stable performance of a Fe-based cathode.
Acknowledgement
This research was supported by the National Research Council of Canada (NRC #53129).
References
[1] D.R. Lovley, Curr. Opin. Biotechnol. 19 (2008) 564.
[2] R.A. Rozendal, H.V.M. Hamelers, K. Rabaey, J. Keller, C.J.N. Buisman, Trends Biotechnol. 26 (2008) 450.
[3] R. Jasinski, Nature 201 (1964) 1212.
[4] P. Aelterman, M. Versichele, E. Genettello, K. Verbeken, W. Verstraete, Elec-trochim. Acta 54 (2009) 5754.
[5] S. Cheng, H. Lui, B. Logan, Environ. Eng. Sci. (2006) 364.
[6] I. Herrmann, U. Kramm, S. Fiechter, P. Bogdanoff, Electrochim. Acta 54 (2009) 4275.
[7] I. Roche, K. Katuri, K. Scott, Appl. Electrochem. 40 (2010) 13. [8] E.H. Yu, S. Cheng, K. Scott, B. Logan, J. Power Sources 171 (2007) 275. [9] F. Zhao, F. Harnisch, U. Schroder, F. Scholz, P. Bogdanoff, I. Herrmann,
Elec-trochem. Commun. 7 (2005) 1405.
[10] C. Dumas, R. Basseguy, A. Bergel, Electrochim. Acta 53 (2008) 2494. [11] G. Faubert, G. Lalande, R. Cote, D. Guay, J.P. Dodelet, L.T. Weng, P. Bertrand, G.
Denes, Electrochim. Acta 41 (1996) 1689.
[12] M. Lefevre, J.P. Dodelet, P. Bertrand, J. Phys. Chem. B 106 (2002) 8705. [13] I. Herrmann, V. Bruser, S. Fiechter, H. Kersten, P. Bogdanoff, J. Electrochem. Soc.
152 (2005) A2179.
[14] S. Gupta, D. Tryk, I. Bae, W. Aldred, E. Yeager, J. Appl. Electrochem. 19 (1989) 19.
[15] F. Jaouen, S. Marcotte, J.P. Dodelet, G. Lindbergh, J. Phys. Chem. B 107 (2003) 1376.
[16] J.-P. Dodelet, Oxygen reduction in PEM fuel cell conditions: heat-treated non-precious metal-N4 macrocycles and beyond, in: J.H. Zagal, F. Bedioui, J.-P. Dodelet (Eds.), N4-Macrocyclic Metal Complexes, Springer, New York, 2006, p. 83.
[17] C. Medard, M. Lefevre, J.P. Dodelet, F. Jaouen, G. Lindbergh, Electrochim. Acta 51 (2006) 3202.
[18] J. Herranz, M. Lefevre, N. Larouche, B. Stansfield, J.P. Dodelet, J. Phys. Chem. C 111 (2007) 19033.
[19] F. Charreteur, F. Jaouen, S. Ruggeri, J.P. Dodelet, Electrochim. Acta 53 (2008) 2925.
[20] B. Tartakovsky, M.F. Manuel, V. Neburchilov, H. Wang, S.R. Guiot, J. Power Sources 182 (2008) 291.
[21] Y. Fan, H. Hu, H. Liu, J. Power Sources 171 (2007) 348.
[22] L. Woodward, B. Tartakovsky, M. Perrier, B. Srinivasan, Biotechnol. Prog. 25 (2009) 676.
[23] L. Woodward, M. Perrier, B. Srinivasan, J. Proc. Control 19 (2008) 205. [24] B.E. Logan, Microbial Fuel Cells, John Wiley & Sons Inc., Hoboken, NJ., 2008. [25] F. Harnisch, S. Wirth, U. Schröder, Electrochem. Commun. 11 (2009) 2253. [26] D.T. Sawyer, A. Sobkowiak, J.L. Roberts Jr., Electrochemistry for Chemists, 2nd