Publisher’s version / Version de l'éditeur: Applied Ergonomics, 44, 5, pp. 775-784, 2013-01-21
READ THESE TERMS AND CONDITIONS CAREFULLY BEFORE USING THIS WEBSITE. https://nrc-publications.canada.ca/eng/copyright
Vous avez des questions? Nous pouvons vous aider. Pour communiquer directement avec un auteur, consultez la
première page de la revue dans laquelle son article a été publié afin de trouver ses coordonnées. Si vous n’arrivez pas à les repérer, communiquez avec nous à PublicationsArchive-ArchivesPublications@nrc-cnrc.gc.ca.
Questions? Contact the NRC Publications Archive team at
PublicationsArchive-ArchivesPublications@nrc-cnrc.gc.ca. If you wish to email the authors directly, please see the first page of the publication for their contact information.
Archives des publications du CNRC
This publication could be one of several versions: author’s original, accepted manuscript or the publisher’s version. / La version de cette publication peut être l’une des suivantes : la version prépublication de l’auteur, la version acceptée du manuscrit ou la version de l’éditeur.
For the publisher’s version, please access the DOI link below./ Pour consulter la version de l’éditeur, utilisez le lien DOI ci-dessous.
https://doi.org/10.1016/j.apergo.2013.01.008
Access and use of this website and the material on it are subject to the Terms and Conditions set forth at Head-and-face shape variations of U.S. civilian workers
Zhuang, Ziquing; Shu, Chang; Xi, Pencheng; Bergman, Michael; Joseph, Michael
https://publications-cnrc.canada.ca/fra/droits
L’accès à ce site Web et l’utilisation de son contenu sont assujettis aux conditions présentées dans le site LISEZ CES CONDITIONS ATTENTIVEMENT AVANT D’UTILISER CE SITE WEB.
NRC Publications Record / Notice d'Archives des publications de CNRC:
https://nrc-publications.canada.ca/eng/view/object/?id=0fcd58ef-3683-412e-9872-36f3fe085e1e https://publications-cnrc.canada.ca/fra/voir/objet/?id=0fcd58ef-3683-412e-9872-36f3fe085e1e
Head-and-Face Shape Variations of U.S. Civilian Workers
Ziqing Zhuang1, Chang Shu2, Pengcheng Xi2, Michael Bergman1 and Michael Joseph1
1
National Institute for Occupational Safety and Health, National Personal Protective Technology Laboratory, Pittsburgh, PA 15236 USA
2
National Research Council of Canada, Institute for Information Technology, Ottawa, ON K1A 0R6, Canada
Abstract
The objective of this study was to quantify head-and-face shape variations of U.S. civilian workers using modern methods of shape analysis. The purpose of this study was based on previously highlighted changes in U.S. civilian worker head-and-face shape over the last few decades – touting the need for new and better fitting respirators – as well as the study’s
usefulness in designing more effective personal protective equipment (PPE) – specifically in the field of respirator design. The raw scan three-dimensional (3D) data for 1,169 subjects were parameterized using geometry processing techniques. This process allowed the individual scans to be put in correspondence with each other in such a way that statistical shape analysis could be performed on a dense set of 3D points. This process also cleaned up the original scan data such that the noise was reduced and holes were filled in. The next step, statistical analysis of the variability of the head-and-face shape in the 3D database, was conducted using Principal Component Analysis (PCA) techniques. Through these analyses, it was shown that the space of the head-and-face shape was spanned by a small number of basis vectors. Less than 50
components explained more than 90% of the variability. Furthermore, the main mode of variations could be visualized through animating the shape changes along the PCA axes with computer software in executable form for Windows XP. The results from this study in turn could feed back into respirator design to achieve safer, more efficient product style and sizing. Future study is needed to determine the overall utility of the point cloud-based approach for the
quantification of facial morphology variation and its relationship to respirator performance.
Keywords: Anthropometric; 3D Scan; Head-and-Face Modeling; Shape Analysis; Respirator Design
1. Introduction
The National Institute for Occupational Safety and Health (NIOSH) is continuing research efforts to better understand the relationship between anthropometric factors and respirator facepiece fit. Zhuang et al. have demonstrated that anthropometric data collected from military personnel in the 1960s are no longer reflective of the head-and-face anthropometric distribution of the current U.S. work force (Zhuang et al. 2004). To address the need for an updated
anthropometric database, in 2003 NIOSH conducted a large scale head-and-face anthropometric survey of diverse, civilian respirator users obtaining traditional anthropometric measurements and laser surface scans (Zhuang and Bradtmiller 2005). Using this data, ten facial dimensions relevant to respirator fit were chosen for defining a Principal Component Analysis (PCA) model, which divides the user population into five face-size categories (small, medium, large,
long/narrow and short/wide) (Zhuang, Bradtmiller, and Shaffer 2007; Zhuang, Benson, and Viscusi 2010). In a subsequent study, Generalized Procrustes Analysis (GPA) was conducted on surface scans to standardize configurations of 26 landmarks associated with individuals into a common coordinate system (Zhuang et al. 2010). The superimposed coordinates for each individual were used as commensurate variables that describe individual shape and were analyzed using PCA to identify population variation. This analysis determined that 49% of the total sample variation was accounted by the first four principal components (PC) with variation in the overall size of faces being the single greatest source of variability(Zhuang et al. 2010). An additional method for characterizing anthropometric data sets is 3D point cloud analysis. Three-dimensional point cloud shape variation allows statistical shape analysis to be performed on a dense set of 3D data points. Three-dimensional imaging technology makes it possible to capture detailed shape of the human body and opens up new opportunities for product design and testing. However, raw 3D anthropometric data is not readily usable for extracting shape
information for a population. Unlike traditional anthropometric data which consist of one-dimensional measurements, 3D anthropometric data usually come from digitizing the surface of the human body and are typically represented as surface meshes. They are able to capture detailed shape information about the human body. However, due to the limitations of the optical sensors, for example, occlusion and lighting conditions, the raw 3D mesh data are noisy and incomplete. Much processing is needed before any statistical analysis can be performed. In this paper, we present geometry processing tools for preparing the raw data for shape analysis. Most of these tools were developed in computer graphics, computer vision, and pattern recognition. The fundamental measurements of the 3D anthropometry are 3D points represented as x, y, and z coordinates in certain coordinate frames. These points represent the shape implicitly; however, different scans have different number of points and the points are not ordered in the same way. Performing statistical analysis requires a set of consistent measurements. In other words, like measurements need to be compared. This means that the data models have to be parameterized such that all of the models have the same number of points and points representing the same anatomical parts correspond to each other. Once a parameterization is obtained, multivariate statistics is applicable (Bookstein 1997; Dryden and Mardia 1998).
An effective way of establishing a correspondence among all the models is to fit a generic surface model to each scanned subject such that the key anatomical features are in
correspondence. Anthropometric landmarks placed on the subjects prior to scanning can be used to guide the deformation of the generic model to the scan. This process can be formulated as a large-scale nonlinear optimization problem. Modern computer hardware and numerical
algorithms allow us to solve this problem efficiently. Finally, we performed PCA on the
parameterized dataset. The main mode of variation of the head and face shape was analyzed for all subjects combined and for males and females separately. Through these analyses, we showed that the space of the human head and face shape is spanned by a small number of basis vectors. Furthermore, the main mode of variations can be visualized through animating the shape changes along the PCA axes.
In this study, head scan data from the 2003 NIOSH U.S. civilian worker survey and another smaller study utilizing U.S. civilian test subjects were parameterized using geometry processing techniques developed in computer vision and computer graphics. Subsequently, PCA was performed on the registered dataset.
2. Methods 2.1 Subjects
Initially 1,177 head scans were available for processing (953 from the 2003 NIOSH survey and 224 from the ongoing temporal changes in fit laboratory study). The 2003 NIOSH nationwide survey of subjects obtained anthropometric data from several occupational backgrounds that utilized respirators on a regular basis: construction, manufacturing, firefighting, healthcare, law enforcement, and other occupational groups. These subjects were divided into three age strata (18–29, 30–44, and 45–65), two gender strata, and four racial/ethnic group strata [Caucasian, African-Americans, Hispanic, and Other (mainly Asian)] (Zhuang and Bradtmiller 2005). Measurements of height, weight, neck circumference, and 18 facial dimensions were collected employing traditional anthropometric techniques. Surface scans and 26 3D landmark locations were collected using a Cyberware rapid 3D digitizer (Monterey, CA,USA), with its associated computer and data processing software. CyScan, one functional module of the Cyberware software package, was used to accomplish the initial scan. During the 360° scan, a class I laser was projected in a thin line onto the subject, which followed the contour of the face and head. The duration of each scan was approximately 45 s, during which time subjects were required to maintain a stable posture. In an effort to ensure the least amount of movement and to properly position each individual, a reference post was placed on the top of the head. To ensure the accuracy of the scanner, calibration procedures were performed routinely.
The second data set of head scans were from an ongoing study to assess temporal changes in facepiece fit. Test subjects performed fit testing at six month intervals to investigate factors that affect changes in respirator fit over time (e.g., changes in weight). Head scans were taken using a 3dMDcranial5 SystemTM (3dMD LLC, Atlanta, GA) which utilizes five banks of high speed digital cameras to capture a 360° image of the subject’s head. Head scan data from the two data sets were combined to create one data set. For the combined data set, six subjects were excluded due to lack of demographic information and two subjects were excluded due to invalid scans. Thus, the final data set consisted of 1,169 scans (1,177 - 8 = 1,169).
2.2 Data Analysis
2.2.1 Data Pre-processing
Polyworks version 10.1.6 (InnovMetric Software, Inc., Québec QC, Canada) was used to perform additional processing and measurements of all scanned images. Polyworks permits the user to create various features such as points and distances. Points were placed manually on each individual scan in the same locations as the labeled landmarks and linear distances were defined by those technician-defined points. Since the landmark data were prepared using a separate software package, they were given in a different coordinate frame than those of the 3D scans. A transformation had to be applied to the scans to align them with the landmark points. Before alignment was done to a 3D scan, a scaling factor of 0.001 was applied to transform it from microns to millimeters. Observations and experiments showed that the 3D scans needed to be first rotated around the x-axis for (-90) degrees, and then the rotated scans needed to be mirrored about a plane. The mirror plane in 3D was defined at point (0, 157.2687, 0) with a normal vector at (0, 1, 0).
2.2.2 Data Parameterization
The goal of data parameterization is to establish a correspondence among the models. An early attempt to solve this problem adopts a volumetric approach (Ben Azouz et al. 2006). Each model is embedded in a regular grid. By carefully orienting and normalizing the models, a
correspondence in the ambient space and thus a correspondence among the models is established. The main advantage of this method is that it does not require landmarks. It is also easy to
implement. The drawback, however, is that the correspondence it produces is not accurate. Holes have to be filled before a model can be embedded into a grid. This proved to be a difficult task because certain parts of the model, for example, under the arms, have large holes. In some parts, like the hands and ears, up to 50% of the information is missing.
A better approach is to fit a generic mesh model to each data scan (Allen, Curless, and Popovic 2003; Mochimaru, Kouchi, and Dohi 2000; Mochimaru and Kouchi 2000). This model is complete and has well-shaped and well-distributed triangles. The fitting deforms the generic model to each scan such that the two models are made geometrically equivalent. When deforming the generic model, the correspondence between the anatomical parts has to be maintained. This is achieved by using landmarks, which serves as the initial conditions of the problem. When deforming the generic model, care must be taken to ensure that the smoothness of the surface is maintained. Otherwise, the triangles can incorrectly coalesce, causing invalid meshes and consequently leading to the failure of the deformation algorithm.
Deforming a generic mesh smoothly to a data scan can be formulated as an optimization problem. Here, the variables that require solving are the x, y, and z coordinates of the generic model. The initial solution can be simply the generic model. Given a solution, the cost function is defined by estimating the difference between the solution and the target data model. This includes three kinds of errors: (1) the landmark error, which accounts for the sum of the distances between the known corresponding landmarks, (2) the smoothness error, which quantifies the local
smoothness at every mesh point, and (3) the data error, which measures the sum of the distances between every pair of corresponding points.
A typical scan consists of 100,000 to 300,000 points. Thus, our optimization problem involves the solving of a large number of variables. As the problem is nonlinear, it is difficult to find stable solutions and the algorithm tends to be stuck in the local minima. Allen et al. suggested a multi-resolution approach where low resolution meshes are deformed before the high-resolution meshes (Allen, Curless, and Popovic 2003). This method improves the efficiency and resolves some of the convergence problem, but it involves the hand setting of several parameters. Xi et al. improved this method by first using Radial Basis Function (RBF) to deform the generic model to approximate the data model and then bringing the two models close together by the nonlinear optimization method of Allen et al. (Xi, Lee, and Shu 2007). This simplifies the process and increases the speed by 50%.
Fig. 1 shows the process of fitting a generic model to a scan. Color-coded images showing fitting errors are presented for another example in Fig. 2.
Fig. 1. From left to right: the generic model (top) and the original scan (bottom), the deformed shape of the generic model using Radial Basis Function, and the generic model after fine fitting to the original scan.
Fig. 2. From left to right: the original scan, fine fitting result and fine fitted model textured with color-coded errors. The values on the scale are in millimeters.
As can be seen in Fig. 2, after forming the generic mesh model to fit the original scan and comparing the two images, the area containing the most error is the subject’s ear. This problem remains consistent with the previously described volumetric approach, where up to 50% of the data could be missing in the area of the ear, thereby creating many more errors in comparisons. However, it should be noted that the updated method presented in this figure reveals much less error in image comparisons of the subject’s face – the area of paramount importance when dealing with respirator fit. The largest error of this region pertaining to actual mask placement on the face – -0.14 mm of the right infraorbital area – is significantly low.
Previously, Luximon et al. feared using the method of fitting a template (generic) model to individual 3D scans, as information on the accuracy of the model and methods was not then in existence (Luximon, Ball, and Justice 2012). In this paper, our success in implementing the use of a generic mesh model can be seen particularly through comparisons of our minimal errors (highlighted especially in Fig. 2) to those previously published using alternative techniques.
2.2.3 Statistical analysis
Having established the correspondence among all the models, we can perform statistical shape analysis. At this point, we have a set of parameterized models, each containing the same number of points and the same mesh topology. The variables on which we perform statistics are the coordinates of the vertices on the meshes. A shape vector can be formed for each model and the mean vector and the covariance matrix can be computed. The eigenvectors of the covariance matrix form a basis of the shape space. This is the standard PCA method. It transforms the data into a new coordinate system in which the modes of variations are ordered from large to small. Three different types of statistical analyses were performed: all subjects combined, and male and female separately.
3. Results
The absolute values of the eigenvalues determine the significance of the corresponding variations (principal components). Many of them are close to zero. Therefore, the space of the human head shape can be represented by a small number of principal components (PC). Fig. 3 shows the relationship between the number of PCs and the percentage of variability they represent. The first 33 PCs explain more than 90% of the shape variability - enough for most practical applications.
Fig. 3. Plot of percentiles for male and female combined on variations represented by principal components.
3.2 Variability Visualization
One of the advantages of statistical shape analysis is that it provides intuitive visualization of the shape variation. Since we used a dense point set on the surface to perform PCA, each PC can be visualized by an animation produced by varying the coefficient of the component. We have implemented software, called Shape Analyzer, for navigating the shape space. Fig. 4 is a snapshot of the user interface. In the interface, each slider controls the coefficient of a principal component. We provided the control sliders for the first 50 components, which is more than enough for any practical application. The combination of these coefficients determines a shape that is shown in the display area. The control sliders allow the user to adjust each PC to any percentile; the display of the digital model is then adjusted accordingly. Hence, veritably any head-and-face size and shape can be generated by the shape analyzer and visualized with the software.
At any instance, the generated shape can be exported to a 3D file which can be then used in computer aided design software for developing headforms; these headforms, which can be kept up-to-date with changing population demographics and easily created with the shape analyzer software, could then be used for respirator or other safety device development. Since PCA is a linear model, shapes along a PC axis are expected to form a Gaussian distribution. Therefore, boundary shapes of a population can be generated. Normality tests were conducted for each PC and they were found to be normally distributed.
Fig. 4. Interface of the Shape Analyzer.
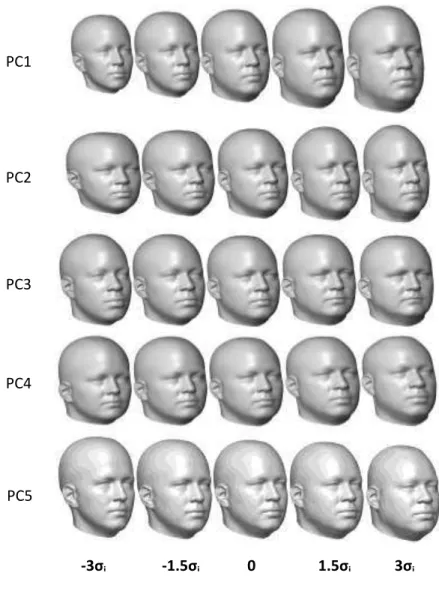
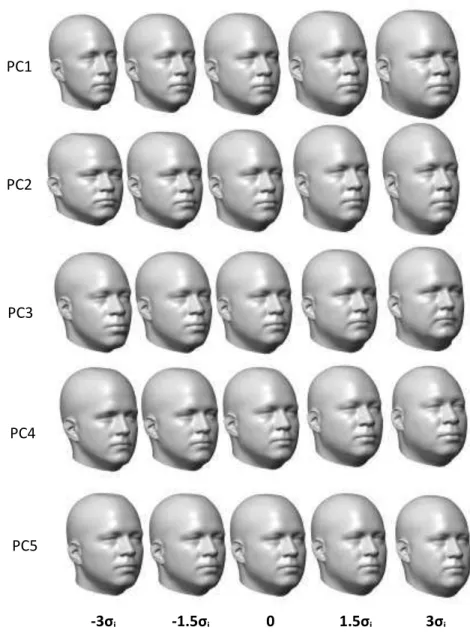
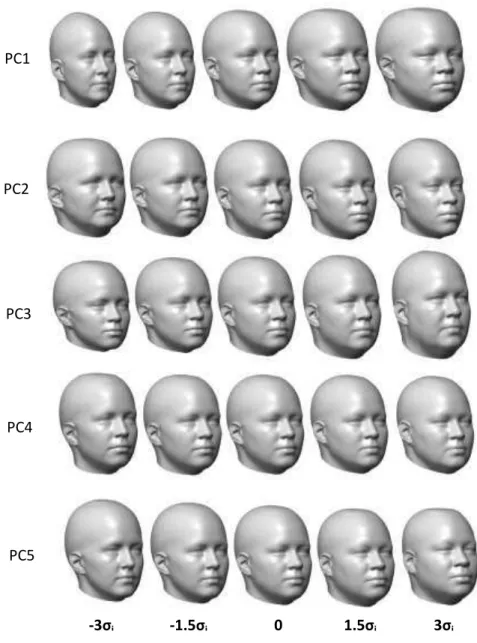
To present shape variations for males and females combined along each principal component, we sampled the Gaussian space at (-3σi, -1.5σi, 0, 1.5σi, 3σi) (σi is the square root of Eigen-value for
five principal components (row number as the index of principal component). Shape variations for male and female are shown in Figs. 6 and 7, respectively. Fig. 8 shows the average male and female combined head, and average male and female heads separately.
For the male and female combined dataset, the first five PCs account for 70% of the total sample variation (variability in the first five components are 35%, 15%, 9%, 6% and 5% respectively). The first PC indicates the overall size is an important component of facial variability. The second PC accounts for long and narrow or short and wide faces. For PC3, the variation is between deep/narrow head and shallow/wide head. Protruding chin versus prominent back of head can be described by PC4, and PC5 represents variations between a head with protruding lip and a head with prominent back of head.
For the male dataset, the first five PCs account for 68% of the dataset variation (variability for the first five components are 30%, 17%, 9%, 7% and 6% respectively). Variations on the first three PCs are similar as those observed for the combined dataset. PC4 depicts shape variations between a head with protruding lip and one with prominent back of head. PC5 represents variations between a head with protruding chin and a head with protruding nose and forehead. For the female dataset, the first five PCs account for 65% of the dataset variation (variability for the first five components are 33%, 12%, 10%, 6% and 5% respectively). The first PC represents a variation between a small/narrow head and a large/wide head and PC2 indicates variations between deep/narrow and shallow/wide. A variation between long/shallow and short/deep is observed on PC3. The variation on PC4 is similar to that on PC5 in the male dataset. PC5 in the female dataset depicts a variation between a head with protruding and wide lower face and one with prominent back of head and narrow lower face.
Fig. 5. Shape variations for males and females combined along the first five principal
components (from left to right are reconstructed shapes at -3σi, -1.5σi, 0, 1.5σiand 3σi, i=1,...,5). PC1 PC2 PC3 PC4 PC5 -3σi -1.5σi 0 1.5σi 3σi
Fig. 6. Shape variations for males along the first five principal components (from left to right are reconstructed shapes at -3σi, -1.5σi, 0, 1.5σiand 3σi, i=1,...,5).
PC1 PC2 PC3 PC4 PC5 -3σi -1.5σi 0 1.5σi 3σi
Fig. 7. Shape variations for females along the first five principal components (from left to right are reconstructed shapes at -3σi, -1.5σi, 0, 1.5σiand 3σi, i=1,...,5).
PC1 PC2 PC3 PC4 PC5 -3σi -1.5σi 0 1.5σi 3σi
Fig. 8. Front and side views of average head models. From left to right: average male and female combined head, average male head, and average female head.
3.3 Shape Variation by Gender
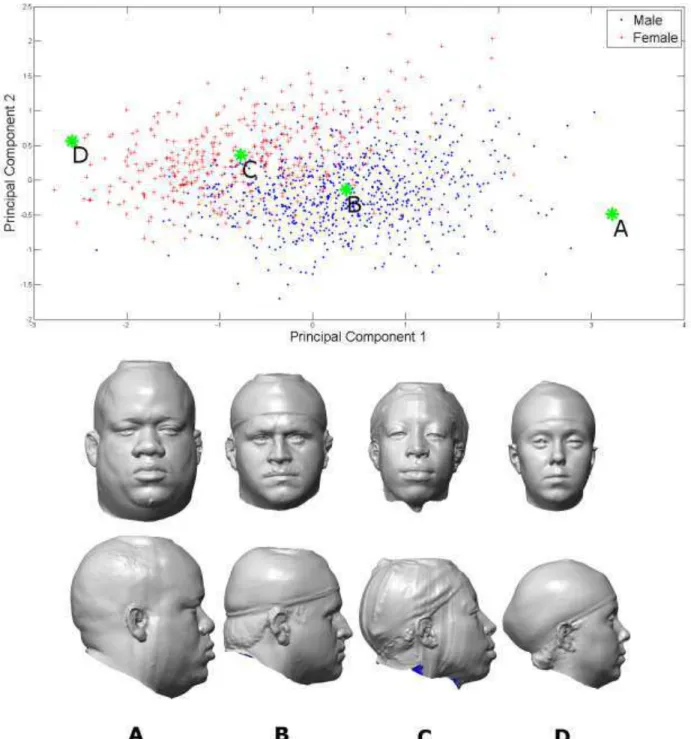
In PCA, eigenvectors are computed to form a shape space. As a result, all the shape vectors comprised of x, y and z coordinates of each 3D head shape can be mapped to this shape space, by computing an inner product of the shape vector and the eigenvectors. This leads to a largely reduced representation with mapped weights for each head shape in the PCA shape space. By plotting with demographic information, e.g., genders, we can find the subjects neighboring to the average male and female and those being furthest from the averages.
A plot onto the first several PCs shows differences between subjects. For the first ten PCs, we found PC1, PC2, and PC4 to be best in distinguishing the subjects. The average of mapped weights was computed and the nearest neighbor from the subjects was found. With the two averages, a straight line was drawn, the rest of the subjects mapped onto the line, and the two subjects being furthest from the averages were found. Table 1 summarizes the composition of gender.
Table 1
The number of head scans in different genders.
Gender Male Female
Fig. 9. Scatter plot of mapped weights on the first and second principal components by gender, where B and C denote the nearest neighbors to the average male and female, A is the furthest to B in males and D is the furthest to C in females.
Fig. 9 shows the scatter plot of subjects in different genders with basis of PC1 and PC2. It also shows four subjects in shaded 3D models, where B denotes the neighbor to the average of males, C is a neighbor to the average of females, A and D are the furthest ones in males and females.
Fig. 9 shows a decreasing size of head and face from males to females. Accordingly, the circumference of neck decreases from A to D. On the face, the width of nose, thickness of lips and the width of chin are smaller for females.
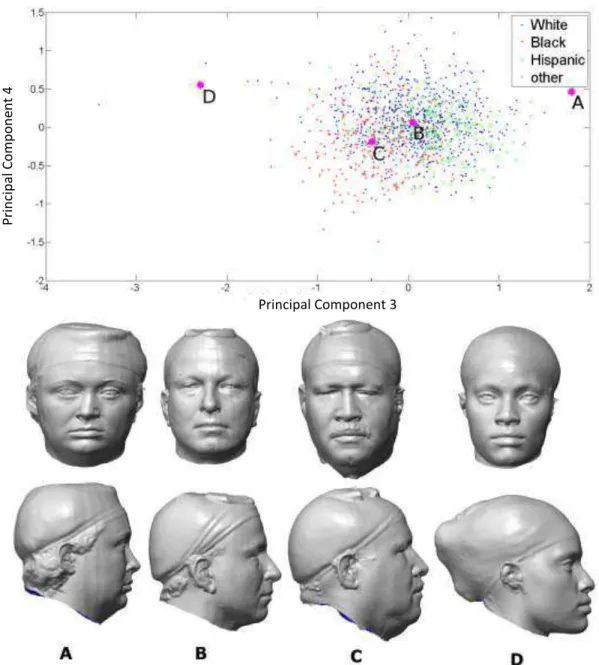
3.4 Shape Variation by Ethnicity
Table 2 gives the composition of ethnicity.
Table 2
The number of head scans in different ethnicity groups.
Ethnicity White Black Hispanic Others
Number of Scans 667 260 175 67
The first ten PCs were studied and the subjects plotted from four different ethnic groups. The finding is that subjects in the "Black" group are distinguishable from the other three groups using PC3 and PC4. It is difficult to distinguish among subjects from the "White", "Hispanic" and "Others" groups using any of the first ten components. Therefore, a scatter plot was made in Fig.
10 for all the subjects. The averages of "White" and "Black" were computed and the nearest neighbors and those being furthest to the averages in each subset were identified. Only a comparison between groups “Black” and “White” was done and not between other groups, because the “White” group has the most subjects in the dataset.
Fig. 10 shows from A to D the shape change in front and side views. A difference between the "White" and "Black" groups is observed on the lower face, where the side view shows clearly that subjects from the "Black" group have forward protruding lips. This leads to a deeper head. On the face, subjects from the "Black" group have a wider nose and thicker lips. The
Fig. 10. Scatter plot of mapped weights on the third and fourth principal components, where B and C are the neighbors to averages of "White" and "Black", A denotes the furthest subject in "White" to B and D represents the furthest one in "Black" to C.
Pri n ci pa l Comp o n e n t 4 Principal Component 3
4. Discussion
Continuing research in head shape analysis is beneficial for constructing headforms that take into account the facial form (size and shape). Such headforms could be incorporated into respirator research, certification standards and product design in efforts to create better fitting and more comfortable respirators. Standard headform specifications exist globally and are used to test the efficacy of various types of personal protective equipment (PPE); however, specific designs vary depending on the PPE being tested and applicable test standards.
Recently, Zhuang et al. developed five digital 3D headforms using the 2003 NIOSH survey data by computing mean facial dimensions to target the ideal facial dimensions for each size category; five scans of test subjects in each category were then chosen and averaged to construct a
representative headform for each size category (Zhuang, Benson, and Viscusi 2010). These new headforms include facial features not found on previous standard headforms. Additionally, using the traditional anthropometric data collected in the 2003 survey, NIOSH developed two new respirator fit test panels representative of current U.S. civilian workers (Zhuang, Bradtmiller, and Shaffer 2007). The bivariate panel was developed using face length and face width and
weighting subjects to match the age and race distribution of the U.S. population as determined from the 2000 census. The other panel, called the “Principal Component Analysis (PCA) panel”, was developed using the first two principal components obtained from a set of 10 facial
dimensions (age and race adjusted). The PCA panel divides the user population into five face-size categories (Small, Medium, Large, Long/Narrow and Short/Wide). Respirators designed to fit these panels are expected to accommodate more than 95% of the current U.S. civilian
workforce.
Point-cloud analysis of 3D head scan data can reveal detailed shape variation among populations and, in turn, can be utilized for the design of better fitting respirators. Using a large digital data set taken from two recent 3D anthropometric surveys (SizeChina and CAESAR) (Robinette et al. 2002), Ball et al. recently showed significant statistical variations between head shapes of
Chinese and Caucasians through PCA analysis on the dense parameterized models (Ball et al. 2010). The authors concluded that head related products, such as headgear designed using Western anthropological head shape, are not appropriate for the Chinese head.
Luximon et al. also used the data from the SizeChina survey in their research. In an effort to create an accurate 3D head-and-face model representative of the current Chinese population, the researchers employed the usage of virtual landmarks in addition to physical landmarks to better obtain the entirety of the head shapes of each scanned individual (Luximon, Ball, and Justice 2012). Average landmark positions were calculated for consistency among the head scans. Instead of deforming the generic mesh model to each 3D head scan to perform data
parameterization, Luximon et al. took their point-cloud data and executed Delaunay
Triangulation to first create a simple model and then triangular subdivision to form a detailed model, both of which required the use of carefully constructed algorithms (Luximon, Ball, and Justice 2012). The same triangular mesh model was used with each of the procured head scans – similar to the use of the generic mesh model with each of the head scans in this study. This method, while diverse, served the same purpose as our own methods and accurate digital 3D head-and-face models were produced, albeit slowly and with more effort, as a vast number of
anatomical landmarks were manually located. Furthermore, the findings of Luximon et al. proved interesting as they showed that the first PC accounted for 29.99% of the variation among head shapes (Luximon, Ball, and Justice 2012), a number very close to the 35% variation
calculated in this study. Differences in ethnicity (China is vastly comprised of Chinese, while the U.S. contains a much broader ethnic spectrum) could account for the differences in
percentages. After PCA, the authors concluded that significant differences in face shape
between males and females could render a unisex system for sizing masks as a possible cause of fit problems.
The newly implemented Shape Analyzer software is of crucial importance because it not only makes it possible to create 3D digital headforms of virtually any head-and-face size and shape, but it also makes it simple to then use computer aided design software to evaluate and test new product designs. Such headforms are significant because they can be newly and quickly
constructed as the demographics of the US population – or even a specific sampling population – change. These new 3D digital headforms can also be used to create physical headforms which could help manufactures develop and test their new respirators, ensuring better protection and more comfort.
Of further note, Zhuang et al. used varying methods to reach the same conclusions described here (Zhuang et al. 2010). For example, the researchers employed Generalized Procrustes Analysis to standardize configurations of landmark coordinates. This standardization ensured that all landmark configurations were placed into a common coordinate system. Superimposed coordinates of each respective subject described individual shape and they were further analyzed using PCA. This analysis allowed for the identification of population variation, in which the first four PCs play a major role.
This study found that the first 33 PCs explain more than 90% of the shape variability. Similarly, a landmark based analysis using 26 facial landmarks found that the first 27 PCs, as a group, account for 90% of the total sample variation (Zhuang et al. 2010). Additionally, the newly developed Shape Analyzer software can export the digital model to a 3D file, which can be then used in computer aided design software for developing headforms; these headforms could then be used for respirator or other safety device development. Future study is needed to determine the overall utility of the point cloud-based approach for the quantification of facial morphology variation and its relationship to respirator performance.
Comparisons between the previous studies (Zhuang, Bradtmiller, and Shaffer 2007; Zhuang et al. 2010) and the current work were also conducted. PCA on the selected ten facial dimensions indicates that the first PC captures the overall size of the face and the second PC captures face shape, mainly key nose features (Zhuang, Bradtmiller, and Shaffer 2007). This coincides with our conclusions made in this work. The shape variations between long/narrow and short/wide faces (PC2) also show nose shape changes between large/narrow and short/broad. By conducting PCA on landmarks, shape variations on the first two PCs are consistent with those observed on facial dimensions (Zhuang et al. 2010); therefore, they are consistent with the conclusions made in this study. Furthermore, the accurate use of PCA and its associated findings suggests that the usage of the bivariate approach in the construction of fit test panels may in fact be ignoring a substantial aspect of total sample variability. According to the study on landmarks, longer
narrow orbits versus shorter wider orbits can be described by PC3, and PC4 represents variation in the degree of ortho/prognathism (Zhuang et al. 2010). These observations can also be viewed through Fig. 5. While the current study demonstrates results consistent with those from previous studies, it provides more detailed shape variations as it takes full advantage of the shape data. Previous studies have identified areas of the face where leakage occurs for respirators. Roberge et al. observed that the nasal region and malar (cheekbone) regions accounted for 71% of identified leak sites in subjects wearing filtering facepiece respirators (FFRs) (Roberge et al. 2011). Oestenstad et al. identified that approximately 89% of all observed leaks on a half-mask elastomeric respirator occurred at the nose or chin or were multiple leaks that included these sites (Oestenstad, Perkins, and Rose 1990). Utilization of the results described in this paper and the NIOSH anthropometric data sets will assist the development of better fitting PPE, including respirators, safety glasses, helmets, and other products—the digital headforms and
anthropometric data sets are referenced in previous publications (Zhuang, Bradtmiller, and Shaffer 2007; Zhuang, Benson, and Viscusi 2010). The NIOSH digital headforms, traditional anthropometric data (manual caliper measurements), and 3D anthropometric scan data are being used by various manufacturers in the design of respirators, hard hats, ergonomic sports safety equipment, eye protection products, headphones, models for artists, and adjustable headbands for neck straightening exercise equipment.
5. Conclusions
Geometry processing techniques developed in computer vision and computer graphics were used to prepare the data such that they correspond to each other point wise. Subsequently, PCA was conducted on the registered dataset. The PCA provides a compact description of human shape variability. Less than 50 components usually explain more than 90% of the variability.
Furthermore, the main mode of variation could be visualized through animating the shape changes along the PCA axes with computer software in executable form for Windows XP. The results from this study, in turn, could feed back into respirator design to achieve safer, more efficient product style and sizing. Future study is needed to determine the overall utility of the point cloud-based approach for the quantification of facial morphology variation and its relationship to respirator performance.
Disclaimer
The findings and conclusions in this report are those of the authors and do not necessarily represent the views of the National Institute for Occupational Safety and Health. Mention of commercial product or trade name does not constitute endorsement by the National Institute for Occupational Safety and Health.
REFERENCES
Allen A, Curless B, Popovic Z., 2003. The space of human body shapes: reconstruction and parameterization. ACM Transcations on Graphics (SIGGRAPH'03) 22, 587-594.
Ball R, Shu C, Xi P, Rioux M, Luximon Y, Molenbroek J., 2010. A comparison between Chinese and Caucasian head shapes. Applied Ergonomics 41, 832-839.
Ben Azouz Z, Rioux M, Shu C, Lepage R., 2006. Characterizing human shape variation using 3D anthropometric data. Visual Computer 22, 302-314.
Bookstein FL., 1997. Morphometric tools for landmark data: geometry and biology. New York: Cambridge University Press.
Dryden IL, Mardia KV., 1998. Statistical Shape Analysis. Chichester: Wiley.
Luximon Y, Ball R, Justice L., 2012. The 3D Chinese head and face modeling. Computer-Aided Design, 44 40-47.
Mochimaru M, Kouchi M., 2000. In SAE Digital Human Modeling for Design and Engineering Conference and Exposition. Michigan.
Mochimaru M, Kouchi M, Dohi M., 2000. Analysis of 3-D human foot forms using the Free Form Deformation method and its application in grading shoe lasts. Ergonomics 43, 1301-1313. Oestenstad RK, Perkins JL, Rose VE., 1990. Identification of faceseal leak sites on a half-mask respirator.
American Industrial Hygiene Association Journal 51, 280-284.
Roberge RJ, Monaghan WD, Palmiero AJ, Shaffer R, Bergman MS., 2011. Infrared imaging for leak detection of N95 filtering facepiece respirators: a pilot study. American Journal of Industrial Medicine 54, 628-636.
Robinette K, Blackwell S, Daanen H, Fleming S, Boehmer M, Brill T, Hoeferlin D, Burnsides D., 2002. Civilian American and European Surface Anthropometry Resource (CAESAR). Final Report. Air Force Research Laboratory, Human Effectiveness Directorate, Bioscience and Protection Division. AFRL-HE-WP-TR-2002-0169, vol I.
Xi P, Lee W-S, Shu C., 2007. Analysis of segmented human body scans. Proceedings of Graphics Interface 234, 19-26.
Zhuang Z, Benson S, Viscusi D., 2010. Digital 3-D headforms with facial features representative of the current US workforce. Ergonomics 53, 661-671.
Zhuang Z, Bradtmiller B, Shaffer RE., 2007. New respirator fit test panels representing the current U.S. civilian workforce. Journal of Occupational and Environmental Hygiene, 647-659.
Zhuang Z, Guan J, Hsiao H, Bradtmiller B., 2004. Evaluating the Representativeness of the LANL Respirator Fit Test Panels for the U.S. Civilian Workers Journal of the International Society for Respiratory Protection 21, 83–93.
Zhuang ZQ, Bradtmiller B., 2005. Head-and-face anthropometric survey of US respirator users. Journal of Occupational and Environmental Hygiene 2, 567-576.
Zhuang ZQ, Slice DE, Benson S, Lynch S, Viscusi DJ., 2010. Shape analysis of 3D head scan data for US respirator users. Eurasip Journal on Advances in Signal Processing.