Ministry of Higher Education and Scientific Research
UNIVERSITY OF ECHAHID HAMMA
LAKHDAR - EL OUED
FACULTY OF EXACT SCIENCES
Physics departement
Presented By: Toufik Nefouci End of study memory
Presented for the Diploma ofACADEMIC MASTER
Speciality : Physique
Option : Physique Appliquée Rayonnement Energétique
Theme
Sustained on ....-June-2019 From the jury:
Mr. REHOUMA Ferhat Professor President
Ms. LARGOT Hanane MAA Reporter
Ms. MEFTAH Nassima MBA Supervisor
Academic year 2018 - 2019
Spectroscopic characterization of El-oued
sand dunes
ACKNOWLEDGEMENT
I would first like to thank my thesis
SupervisorMs.
MEFTAH Nassimaat Elchahid
Hamma lakhdar university of El-Oued. The door to Prof. Meftah office was always
open whenever I ran into a trouble spot or had a question about my research or
writing. She consistently allowed this paper to be my own work, but steered me in the
DEDICATION
Table of contents
List of tables ... v List of figures ... vi General introduction ... 2 Chapter I ... 4 I-1-Introduction ... 5 I-2-Sand definition: ... 5I-3 Global Distribution of Sand Seas: ... 6
I -4-The chemical and physical properties of sand: ... 6
I -4-1- The chemical composition of sand: ... 6
I -4-2. Sand grains: ... 7
I-5-The uses of sand in modern Industry:... 8
I-5-1-Industrial Sand: ... 8
I-5-2-Filtration and Water Production ... 8
I-5-3-Glass production ... 9
I-5-4-Metal Casting ... 9
I-5-5-Oil and Gas Recovery ... 9
I-6 - The silica minerals... 9
I-6-1- General Properties of quartz: ... 11
I-6-2-From Beta-Quartz to Alpha-Quartz: ... 14
I-7-1-The optical properties of quartz: ... 14
I-7-2Applications: ... 17
Chapter II ... 18
II-1- Introduction: ... 19
II-2- The samples gathering: ... 19
II-3- Experimental methods: ... 21
II-3-1-Fourier-transform infrared spectroscopy (FTIR): ... 21
II-3-1-1- Infrared theory: ... 21
II-3-1-2-Types of Molecular Vibrations: ... 21
II-3-1-3- The electromagnetic radiation absorption: ... 22
II-3-1-4- Infrared instrumentation: ... 23
II-3-5- The Infrared spectrum:... 24
II-3-2- - X-ray diffraction (XRD): ... 25
II-3-2-1- A brief history: ... 25
II-3-2-2- The source of X-rays: ... 25
II-3-2-3- Bragg equation ... 27
Chapter III ... 31
III-1-Introduction ... 32
III-2-FTIR analysis ... 32
III-2-1-KBr Disc sample preparation ... 32
III-2-2-Machine information ... 33
III-2-3-Results and discussion ... 33
III-2-XRD analysis: ... 37
III-2-1-Samples preparation: ... 37
III-2-3-Results and discussion: ... 38
General conclusion ... 46
Appendix ... 48
List of tables
Table (I.1): The Chemical analysis of sand samples taken from various regions around the world ...….6
Table (I.2): Different particles sizes and names ………..……….7
Table (I.3): Moh's hardness scale ………...………11
Table (I.4): The luster of some minerals ………...………12
Table (I.5): The general identification points for quartz ………...13
Table (I.6): Indices of refraction for both the ordinary no and the extraordinary ray ne . ………15
Table (II.1): A part of the electromagnetic spectrum ………...23
Table (III.1): The functional groups found in the sand samples ………...36
Table (III.2): Sand crystallinity indices ………...………...37
Table (III.3): Structural properties of El-Oued's sand (S1) …….………39
Table (III.4): Structural properties of El-Oued's sand (S2) ……..………...40
Table (III.5): Structural properties of El-Oued's sand (S4) ……..………...42
Table (III.6): Structural information of Quartz in El-Oued's sand (S1, S2, S3, S4) .………...43
List of figures
Figure (I.1): Dunes on Titan seen in Cassini’s radar ………5
Figure (I.2): Global Distribution of Sand Seas ………6
Figure (I.3): The necessary measurements to calculate both the shape and roundness ratios ...…………7
Figure (I.4): Chart for estimating the roundness based upon comparisons ..……….……….…………8
Figure (I.5): The stability fields of some silica polymorphs ……...………10
Figure )I.6(: three-dimensional framework of linked SiO4−4 ……...………10
Figure (I.7): Examples of cleavage in minerals ………11
Figure (I.8): From β-quartz to α-quartz ………14
Figure (I.9): Birefringence ………14
Figure (I.10): Birefringence and Polarization ….………15
Figure (I.11): The electrical potential between deformed surfaces ………16
Figure (II.1): The location of El-Oued province in Algeria. ………19
Figure (II.2): The location of the regions where sand samples were picked from. ………20
Figure (II.3): Actual photos of the regions and dunes where the four samples were picked ….…………20
Figure (II.4): A molecule's energy levels excited by a photon. ……….………21
Figure (II.5): Symmetric and asymmetric stretching …...………22
Figure (II.6): Bending or deformation vibrations ……….………22
Figure (II.7): Interferometer ………….……….23
Figure (II.8): Albert Abraham Michelson interferometer ………24
Figure (II.9): Infrared transmittance Spectrum ………24
Figure (II.10): Energy transitions of inner shell electrons ………26
Figure (II.11): Generation of X-rays in a modern X-ray tube ………26
Figure (II.14): A diffractometer scans the 2θ angle range with an electronic detector ………...………29
Figure (II.15): Diffractometer pattern of halite ……….29
Figure )II.16(: the interface of Match software ……….30
Figure (III.1): KBr discs prepared for the FTIR ………32
Figure (III.2): A Mortar and pestle ………32
Figure (III.3): Shimadzu FTIR-8300 machine ….………33
Figure (III.4): The FTIR transmittance spectrum of sample S1 ………33
Figure (III.5): The FTIR transmittance spectrum of sample S2 ………34
Figure (III.6): The FTIR transmittance spectrum of sample S3 ……….………...…………34
Figure (III.7): The FTIR transmittance spectrum of sample S4 ………35
Figure (III.8): 𝑇0 and 𝑇 on the FTIR spectrum ………37
Figure (III.9): Sand powder ……….………38
Figure (III.10): XRD spectrum of S1 ………...………..……….39
Figure (III.11): XRD spectrum of S2 ………..………40
Figure (III.12): XRD spectrum of S3 …….……….41
General introduction
The main motive that triggered many ideas of sand examination, is the abundance of huge amounts of sand in earth's crust, this sand is chiefly composed of quartz and other minerals, such as sand rocks, igneous rocks and Sedimentary rocks. [1] Many of these minerals are tightly related to numerous human activities, and some of their properties only came to our knowledge after studies conducted in research centers and international universities laboratories.
The results found by researchers in countries like Libya, Egypt and Tunisia have shown the presence of mutual properties among earth's crust minerals. [1] those properties are of a significant correspondence to the geographical location.
Quartz has a wide range of applications, and is considered a corner stone of many industries, for instance, building materials, thermal rocks, anti-humidity rocks and clean energy equipment. The marked quality transformation in building materials in both Egypt and Tunisia was essentially due to the studies on natural resources (generally) and quartz (specifically) utilization. Quartz is also a crucial component in electronics industry.
Silica sand is mostly comprised of silicon dioxide (𝑆𝑖𝑂2) along with small amounts of impurities and other minerals oxides, also is it covers vast areas of earth's surface. [1] The deserts around the world possess enormous amounts of minerals and natural treasures, dunes in south of Algeria has been the focus of many geological studies where only the creation and evolution of sand mattered.
Previous studies that aimed to identify sand in the south of Algeria , showed the existence of a high quartz (𝑆𝑖𝑂2) content percentage. These results were so encouraging to conduct other studies in various regions in the south of Algeria. The study of sand minerals chemical and physical properties in Algeria is very important due to its potential applications in many industries, for instance, building materials, glass making, energetics and medicine.
For the sand in Algeria to be used in future application, it has to be fully identified. This thesis is one of the first attempts to study El-Oued's sand. this study was divided into three chapters as follows: The first chapter is concerned with the general notions of sand, and in it we discussed the definition of sand, and also presented some of its chemical and physical properties, As well as its importance to our modern industry.
The second chapter was dedicated to explain the samples gathering, the basics of the experimental methods and instruments used in the examination of sand samples. The methods covered in this chapter are X-Ray diffraction and FTIR (Fourier-transform infrared spectroscopy).
The third chapter was for the presentation and discussion the results of both FTIR and the XRD analysis.
Finally, this thesis was ended with a conclusion in which summarized the results and opened a new research door.
Chapter I
I-1-Introduction
For the sake of a better understanding the interest of sand this chapter will discuss the definition of sand, and also present its chemical and physical properties, As well as its importance to our modern industry.
I-2-Sand definition:
Sand refers to solid inorganic particles that are derived from the weathering of rocks. In geology, sand is defined as mineral particles with diameters between 62.5 and 2000 m [1].
It is conventional too to think of sand as something that is broken down from a larger mass of bedrock. However, from the viewpoint of sand being particles of a given size or, dune-forming material in general, this perspective is somewhat parochial. Snow forms dunes, yet is crystallized in the air from water vapor; Titan’s sand may start in a similar way, perhaps agglutinated somehow on the surface. So material can grow into sand, not just be broken down into it [2].
Figure I.1: Dunes on Titan seen in Cassini’s radar (a) that are similar to Namibian sand dunes on Earth[3] (b)
.
a
I.3 Global Distribution of Sand Seas:
The location of the world’s major active sand seas is shown in Figure I.2. Many of these sand seas have large areas of stabilized dunes on their margins. [5]
I -4-The chemical and physical properties of sand:
I -4-1- The chemical composition of sand:Sand is mainly comprised of Quartz )SiO2(, Calcium carbonate (CaCO3), Gypsum (CaSO4 , 2H2O), small amounts of impurities and heavy metals, Iron (III) Oxide (Fe2O3) and Aluminum oxide (Al2O3). The table below presents chemical compositions of sand, and the mass percentage of each compound in given samples taken from various regions around the world (table I.1). [1]
Table I.1:The Chemical analysis of sand samples taken from various regions around the world[1] [23]
Oxides Mass Percentage (%)
Region The Grand Erg (Algeria) Thar Desert (India) Arabian Peninsula.
Australia Vizcaíno Desert, Mexico El-Oued Region (Algeria) SiO2 74.61 80.37 83.42 88.37 71.38 97.63 Al2O3 1.35 5.53 5.12 6.46 14.24 0.327 Fe2O3 0.86 2.10 0.64 3.09 1.92 0.042 CaO 17.3 4.60 4.06 0.15 4.74 0.56 Na2O 1.20 0.11 3.52 0.54 MgO 0.29 0.97 2.4 0.22 0.94 0.61
I -4-2- Sand grains: I-4-2-1-Sand grains sizes:
According to the geological categorization, a sand grain have between 62.5 and 2,000 m diameter, which means its smaller than gavel and larger than silt (table I.2) [2]
Table I.2: Different particles sizes and names[1]
Name Grain diameter
Gravel 2—64 mm
Granule 2—4 mm
Sand 1/16 — 2 mm
Silt 1/256—1/16 mm
Clay <1/256 mm
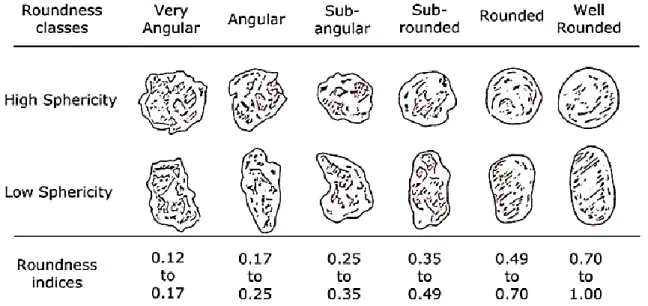
I-4-2-2- Sand Grains Morphology:
Once sand grains were observed by microscopes shape related terms like spherical, cylindrical or sheet-like came into usage. However, these terms needed to be quantified. Haakon Wadell (1935) [6] came up with a simple method based on the shape and roundness of sand grains determined through two-dimensional photographs taken by microscopes. Hakon wadell defined roundness as the ratio of the average radius of curvature circles inscribed within corners on the grain to the radius of the maximum inscribed circle within the entire grain. And shape as the ratio of the cross-sectional area of the grain to the smallest circumscribed circle. This results a maximum value for both shape and roundness equals to 1. circumscribed circle. This results a maximum value for both shape and roundness equals to 1. [7]
The chart below (Figure I.4) is used to classify sand grains according to roundness and shape.
I-5-The uses of sand in modern Industry:
I-5-1-Industrial Sand:Industrial sand is a term normally applied to high purity silica sand products with closely controlled sizing. For industrial and manufacturing applications, deposits of silica yielding products of at least 95% SiO2 are preferred. Silica sand deposits are most commonly surface-mined in open pit operations [8], but dredging and underground mining are also employed. Extracted ore undergoes considerable processing to increase the silica content by reducing impurities. It is then dried and sized to produce the optimum particle size distribution for the intended application. [9]
I-5-2-Filtration and Water Production:
Tap water filtering and wastewater management both pass through a complex route of cleaning and filtering, which is aided by the use of industrial sand. Uniformity in grain shapes and grain size distributions allows a safe and efficient bed operation to remove contaminants in both drinking water and wastewater [8]. Silica is also the perfect filtration and water production material because it is chemically inert and will not react to acids. [9] It does not react to volatile organics, solvents, or any contaminant.
Figure I.4: Chart for estimating the roundness based upon comparisons with particles of known roundness. [7]
I.5.3-Glass production:
In the production of glass, there is both the need and requirement for silica to be chemically pure (composed of over 98% SiO2), of the appropriate diameter (a grain size of between 0.075 mm and 1.18 mm), and color (must contain between 0.025% and 0.04% Fe2O3) [8]. These requirements are extremely specific and technical; and this is because the silica must be hard, able to resist high temperatures, and maintain a consistent appearance as a finished product.
I.5.4-Metal Casting:
Industrial sand is an essential part of the ferrous and non-ferrous foundry industry. Metal parts ranging from engine blocks to sink faucets are cast in a sand and clay mold to produce the external shape, and a resin bonded core that creates the desired internal shape. Silica’s high fusion point (1760°C) and low rate of thermal expansion produce stable cores and molds compatible with all pouring temperatures and alloy systems [10]. Its chemical purity also helps prevent interaction with catalysts or curing rate of chemical binders. Following the casting process, core sand can be thermally or mechanically recycled to produce new cores or molds.
I.5.5-Oil and Gas Recovery:
Known commonly as proppants, or "frac sand,” industrial sand is pumped down holes in deep well applications to prop open rock fissures and increase the flow rate of natural gas or oil. In this specialized application round, whole grain deposits are used to maximize permeability and prevent formation cuttings from entering the well bore [10].Silica’s hardness and its overall structural integrity combine to deliver the required crush resistance of the high pressures present in wells up to 2,450 meters deep. Its chemical purity is required to resist chemical attack in corrosive environments.
I.6 - The silica minerals:
The silica minerals, with an overall composition SiO2, include many polymorphs Quartz is the most common member, occurring both in a trigonal low-temperature form (α-quartz) and a hexagonal high-temperature form (β-quartz). Other important silica polymorphs are β-tridymite, β-cristobalite, coesite and stishovite. The stability fields of some silica polymorphs are shown in (Figure I.5) [11].
From all the silica minerals shown above, this part focuses only on quartz because of its high presence in sand, and specifically α-quartz.
The mineral α-quartz comprises about 13% of the earth’s crust and is the second most abundant mineral. the structure of quartz consists of an infinite three-dimensional framework of linked SiO4−4 tetrahedra (Figure I.6). [12] Each corner of a tetrahedron is shared with another one and we can only count it as one half per tetrahedron, resulting in an overall oxygen content of 4 × 1/2 = 2 and one silicon per tetrahedron, i.e, a molecular composition SiO2. [11]
Figure I.5: The stability fields of some silica polymorphs [11]
I.6.1- General Properties of quartz:
1-Mohs Hardness:
Hardness Scale is defined loosely as resistance to indentation or abrasion. Quantitative tests for hardness can be made under a microscope using a diamond indenter and are an important part of the mineralogy of opaque ore minerals. The average geologist studies merely relative hardness, expressed by the resistance offered by a smooth surface of a mineral to scratching by a sharp edge on a material of known hardness. Around 1800 the German mineralogist Friedrich Mohs devised a relative scale that compares the hardness of some standard minerals (Table I.3) and this scale is still used universally. [11]
Table I.3: Moh's hardness scale [11]
Talc Gypsum Calcite Fluorite Apatite Feldspar Quartz Topaz Corundum Diamond
Mg3Si4O10(OH)2 CaSO₄·2H₂O CaCO3 CaF₂ SiO2 Al₂SiO₄(F,OH)₂ Al2O3 C
1 2 3 4 5 6 7 8 9 10
2-Cleavage:
Cleavage is used to describe the planes within a mineral with weak bonding. A mineral can easily be split along these planes and cleaves/breaks into specific shapes (Figure I.7) based on the mineral structure. [14] We describe cleavage based on how well the mineral cleaves. Perfect cleavage occurs if the mineral breaks into continuous planes that are smooth enough to reflect light. Quartz basically has no cleavage. [11]
Figure I.7: Examples of cleavage in minerals. (a) Single cleavage causing a crystal to break up into flakes as in mica [11]
3-Fracture:
Many mineral crystals (e.g., quartz) show only poorly defined cleavage or none at all. When such crystals are struck they break on generally irregularly oriented curved surfaces decided more by the stress distribution in the crystal at the time of rupture than by the atomic, Quartz however has conchoidal fracture. [11]
4-Color:
The color of a mineral as directly observed can be so characteristic as to be an important aid in identification, but it can also be misleading. Most minerals, even the rock-forming silicates in which isomorphous series are present, can show a bewildering variety of colors. In general, color by itself is insufficient to permit identification, but it can be useful when taken together with other properties. Quartz occurs in many colors depending on the nature of the impurities it contains. [14]
5-Streak:
Many minerals show a characteristic color when reduced to a fine powder, regardless of the color they show in a bulk specimen. An example is hematite, which can range from red to metallic gray in hand specimens but always produces a dark red-brown powder on grinding. This property is called streak. [14]
6- Luster:
The term luster is used to describe the character of the light reflected from the surface of a mineral and depends on the refractive index. Terms in common use refer the luster of a mineral to that of some common material (e.g., metallic luster, waxy luster, earthy luster, and so on). The main division is into metallic and nonmetallic and the latter can have many different expressions.[15] [11]
The luster of some minerals is as follows:
The table Below (Table I.5) sums up the most important properties of quartz.
Metallic Submetallic Adamantine Resinous Vitreous Earthy silver magnetite diamond gypsum quartz graphite
Property Value Chemical Formula SiO2
Hardness 7
Luster vitreous
Streak white
Cleavage none
Fracture conchoidal
Crystal System trigonal, hexagonal Specific Gravity (g/m3) 2.65
Color clear, white, red, orange, yellow, green, blue, purple, brown, black
Index of Refraction 1.544 - 1.5553
Unit cell dimensions
a = 4.913Å
b = 4.913Å
c = 5.405Å
I.6.2-From Beta-Quartz to Alpha-Quartz:
The hexagonal β-quartz exists only above 573 ◦C. Upon cooling, tetrahedra become tilted, resulting in a less symmetrical trigonal structure (α-quartz) (Figure I.8). This transformation involves only slight displacements of atoms, with no breakage of bonds, and is therefore instantaneous and reversible. [15]
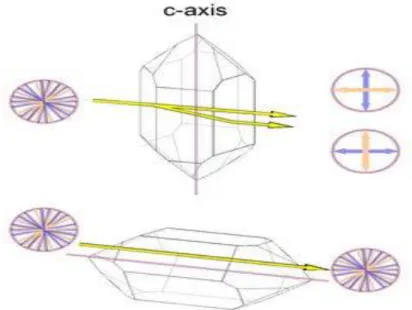
I.7.1-The optical properties of quartz: 1-Birefringence:
Like many other minerals, quartz shows a very interesting property called birefringence or double refraction. This phenomenon is well known from calcite: when a clear calcite rhombohedron is put on a newspaper, one can see a double image of the letters. A single ray of light is split up into two rays while it passes the rhombohedron. Birefringence is present in many crystallographically non-isometric (non-cubic) materials and is absent from amorphous materials, non-isometric (cubic) minerals, and liquids. [14] [15]
α-quartz β-quartz
The optical axis in quartz corresponds to the c-axis of the unit cell, so there is no birefringence when light passes the crystal from tip to tip. The maximum birefringence occurs when the light passes perpendicular to the optical axis (Figure I.10 with the amount of birefringence greatly exaggerated). Light that passes the crystal along the c-axis will also not be split into two rays of opposite polarization. [14]
2-Dispersion
The coefficient of dispersion is a measure of how much the refractive index of a substance depends on the wavelength of the light. Quartz has a low coefficient of dispersion and thus cannot be used as a diamond imitation. In optical apparatus dispersion needs to be kept as low as possible, for example to avoid chromatic aberrations of a camera lens. Note that dispersion is not a phenomenon confined to anisotropic crystals, it can be observed in isotropic crystals and non-crystalline substances as well, for example ordinary glass, or water (causing the rainbow). [15]
The following table (Table I.6) of refractive indices for both the ordinary no and the extraordinary ray ne, with colors given instead of wavelengths:
Red Yellow Green Blue Violet
no 1.5409 1.5442 1.5471 1.5497 1.5582 ne 1.5499 1.5533 1.5563 1.5589 1.5677 Table I.6: Indices of refraction for both the ordinary no and the extraordinary ray ne
3-Dichroism
A transparent substance whose color depends on the direction of the light passing through it is called pleochroic. If it changes between two colors it is called dichroic [15]. Pure quartz is colorless and cannot be dichroic, but some of its colored varieties show a weak dichroism:
natural citrine: yellow/bright yellow smoky quartz: yellow-brown/red-brown amethyst: gray- or blue-violet/red-violet
ametrine: only the amethyst sectors: gray- or blue-violet/red-violet prasiolite: yellow-green/blue-green
4-Piezoelectricity
In 1880, Pierre and Jacques Curie observed that a pressure exerted on a small piece of quartz caused an electrical potential between deformed surfaces (Figure I.11), and that application of a voltage effected physical displacements. Thus, the piezoelectric (or pressure electric) effect was discovered. [17]
I-7-2-Applications:
There are all kinds of situations where we need to convert mechanical energy (pressure or movement of some kind) into electrical signals or vice-versa. Often we can do that with a piezoelectric transducer. In ultrasound equipment, a piezoelectric transducer converts electrical energy into extremely rapid mechanical vibrations, so fast, in fact, that it makes sounds, but ones too high-pitched for our ears to hear. These ultrasound vibrations can be used for scanning, cleaning, and all kinds of other things. In a microphone, we need to convert sound energy (waves of pressure traveling through the air) into electrical energy, and that's something piezoelectric crystals can help us with. Simply stick the vibrating part of the microphone to a crystal and, as pressure waves from your voice arrive, they'll make the crystal move back and forth, generating corresponding electrical signals. [17]
In a quartz clock or watch, the reverse-piezoelectric effect is used to keep time very precisely. Electrical energy from a battery is fed into a crystal to make it oscillate thousands of times a second. The watch then uses an electronic circuit to turn that into slower, once-per-second beats that a tiny motor and some precision gears use to drive the second, minute, and hour hands around the clock-face. Also some printers inkjets squirt their syringes using electronically controlled piezoelectric crystals. [17]
Chapter II
Samples gathering and
Experimental methods
II-1- Introduction:
This chapter is dedicated to explain the basics of the experimental methods and instruments used in the examination of sand samples. The methods covered in this chapter are X-Ray diffraction (XRD) and Fourier-transform infrared spectroscopy (FTIR).
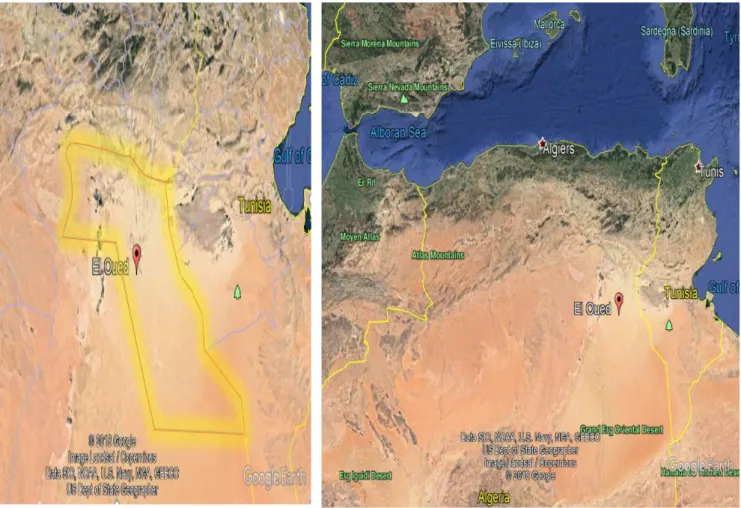
II-2- The samples gathering:
The sand samples were taken from regions in Algeria/El-oued province (figure II.1). The samples S1, S2 and S3 were picked from dunes located in the south of the El-Oued area and sample S4 from the north of El-Oued region (figure II.2).
Both the dunes and the region are perfectly located by the following coordinates: S1 (33° 8'31.18"N , 6°51'12.42"E) S2 (33° 8'28.93"N , 6°51'15.37"E) S3 (33° 8'34.02"N , 6°51'15.74"E) S4 (33°42'36.96"N , 6°33'53.00"E)
These regions were carefully chosen to be away from any industrial contamination, and here are photos (Figure II.3) for the samples locations to support our claim.
Figure II.2: (a) The location of the region where S4 was picked and (b) the locations of the dunes that the samples S1, S2 and S3 were taken from as viewed by google earth.
S3 S4 S2 S2 S4 S1 S3
Figure II.3: Actual photos of the regions and dunes where the four samples were picked.
a
b
II-3- Experimental methods:
II-3-1-Fourier-transform infrared spectroscopy (FTIR):
The Analysis of infrared spectra can tell us what molecules are present in a sample, [20] this is why infrared spectroscopy is useful. There are several types of infrared spectrometers in the world, but the most widely used one is FTIR (Fourier Transform Infrared), which is the focus here. [19]
II-3-1-1- Infrared theory:
Naturally all molecules vibrate according to their vibration modes, but with very small amplitudes. If a photon frequency matches the vibration frequency of the molecule, then the molecule will respond to its oscillation. In other words, if a photon has just the necessary energy to take the molecule to a higher excited state (figure II.4), then it will get absorbed, and its energy will be transformed into vibrational energy
.
[20]The only photon that can be absorbed is the one of energy h, that is equal to the transition energy (E2-E1). The absorbance of photons by the molecules leaves a trace on the transmittance spectrum (absorption band). Each frequency at which this absorption happens is characteristic to the molecule structure. [18]
II-3-1-2-Types of Molecular Vibrations: 1- Stretching or bonding vibrations:
In this case only the bonds lengths alter. this type can be subdivided into symmetric and anti-symmetric stretching (Figure II.5) [20]
Figure II.4: A molecule's energy levels excited by a photon [15]
2- Bending or deformation vibrations:
This type Alters the bond angles, while the bond lengths remain unchanged, they can be subdivided into in-plane and out-of-plane modes, these modes are often referred to as twisting, wagging, and rocking vibrations. (Figure II.6) [21]
II-3-1-3- The electromagnetic radiation absorption:
The electromagnetic radiation is composed of electric and magnetic waves called the electric vector and the magnetic vector. These two waves undulate in planes mutually perpendicular to each other,
Figure II.5: symmetric and asymmetric stretching [19]
interaction of the electric vector with matter that leads to the absorbance of the EM. Each absorption range of the electromagnetic radiation corresponds to a certain electronic transition or molecular movement (Table II.1). [18]
II-3-1-4- Infrared instrumentation:
At the heart of every FTIR is an optical device called an interferometer. A diagram of an interferometer is shown in Figure II.7. interferometer or “interference meter,” measures the interference pattern between two light beams. The light from an infrared source is shown entering the interferometer from the left in Figure II.7. The interferometer splits the single light beam into two light beams. The interferometer then causes the two light beams to travel different paths, which are denoted D1 and D2 in Figure II.7. After the two light beams have traveled their different paths they are recombined into one beam, and then the light beam leaves the interferometer. [19] [20]
There are a number of interferometer designs used by FTIR manufacturers. The oldest and perhaps the most common type of interferometer in use today is the Michelson interferometer. It is named after Albert Abraham Michelson (1852–1931) (Figure II.8) who first built his interferometer in the
Figure II.7: Interferometer [18]
Table II.1: A part of the electromagnetic spectrum [18]
Visible & UV >14,000 cm–1 Near IR 14,000 to 4000 cm–1 Mid-Infrared 4000 to 400 cm–1 Far Infrared 400 to 4 cm–1 Microwaves < 4 cm–1 Electronic Transitions Molecular Vibrations Molecular Vibrations Molecular Vibrations Molecular Rotations
II-3-1-5- The Infrared spectrum:
The infrared spectrumis a plot of measured infrared light intensity versus a property of light is called an infrared spectrum. An example of an infrared spectrum is shown in Figure II.9. By convention the x-axis of an infrared spectrum is plotted with high wavenumber to the left and low wavenumber to the right. Note in Figure II.9 that 4000 cm−1 is to the left and 500 cm−1 is to the right, and that the spectrum is plotted in transmittance units, which measure the amount of light absorbed by a sample. As you can see in the figure the peaks point up and their tops denote wavenumbers at which significant amounts of light were absorbed by the sample.[20]
II-3-2- X-ray diffraction (XRD):
II-3-2-1- A brief history:The notion that crystals have a lattice-based structure and that the basic building block is the unit cell was introduced in the eighteenth century. At that time the analysis of crystals was based on visual inspection, on detailed examination with a hand lens or at best a light microscope. However, visible light, with wavelengths between 400 and 700 nm, is far too coarse a probe to investigate crystal structures where information is on the scale of atoms and interatomic distances, i.e,1-5 A (1 A ˚ = 0.1 nm). [22] However, in the early twentieth century new techniques were developed to study crystal lattices, providing a tool for determining structural parameters and largely confirming the concepts about unit parallelepipeds, lattice structure, and symmetry suggested more than 100 years earlier. With the discovery of X-rays by C.W. Rontgen in 1895, the stage was set for analyzing crystals at an elementary level, and this research produced information about the solid state. Then in 1912 the famous diffraction experiment of Max von Laue established that X-rays are waves and that the suspected internal lattice structure of crystals indeed existed.
II-3-2-2- The source of X-rays:
It was found that when electrons were accelerated in an electric field and collided with a metal anode, a very high-energy radiation was emitted. At the time, he was unable to explain the origin of this radiation (hence the name ‘‘X-rays’’), and an explanation had to wait until more was known about the structure of atoms. It became clear that accelerated electrons with sufficiently high energy could displace electrons from within the inner electron shells (e.g., a K shell electron) of an atom
(Figure II.10). This is because the energy of the electrons within the inner shells is close to, but
slightly less than, the energy of the accelerated electrons. An electron from a higher shell immediately fills the electron hole, and the excess energy is released as a photon. The energy, and hence the wavelength, corresponds to the particular electronic transition of a given atom. These high-energy photons have short wavelengths λ (λ = hc/eV, where h is the Planck constant, c the speed of light, e the charge of the electron, and V the accelerating voltage) in the range 0.1-5 A, which make them ideal for crystal structure studies, and are called X-rays. [11]
For most applications X-rays are produced by an X-ray tube, powered by an X-ray generator. Figure II.11 shows a schematic diagram of a modern X-ray tube. [11] It consists of an evacuated glass tube in which electrons are released by heating a tungsten filament (just as in a normal light bulb). By applying a voltage, the electrons are then accelerated in a field to 40-50 keV and collide with an anode metal. [24]
Owing to the energy transitions in the anode, X-rays are produced and leave the tube through beryllium windows that have relatively low absorption. In an X-ray tube most of the energy of the electrons is not converted to X-rays but to heat, and thus it is necessary to cool the anode metal, usually with water. [22]
Figure II.10: Energy transitions of inner shell electrons. [11]
II-3-2-3- Bragg equation:
its known that crystals consist of stacks of lattice planes (Figure II.12), and X-rays penetrate many hundred. In the figure Two waves, which are initially in phase, reach a crystal. The first (1) diffracts (reflects) on the lattice plane (hkl) on the surface, the second one (2) on the parallel plane below at a distance d = AC. [11] [22] The angle of incidence to the lattice plane is θ. The second wave has a longer path (PD = BC +CD), before the two waves establish a new wave front AD.
We can easily establish a relationship (triangle ABC) sin θ = BC/AC, and correspondingly for diffraction, where the path difference has to be a multiple of the wavelength to produce constructive interference. [22] The bragg's equation is given as follows:
𝑷𝑫 = 𝟐𝒅 𝐬𝐢𝐧 𝛉 = 𝒏. 𝝀 (2.1) where λ is the wavelength, θ is the angle of incidence and reflection, and n is an integer. The relationship is known as the Bragg equation (or Bragg’s law) and was formulated in 1913 by the father and son team W.H. and W.L. Bragg. Diffraction can be viewed as reflection on lattice planes with reflection angles θ determined by the spacing of lattice planes.
Bragg’s law has two conditions:
1. The lattice planes (hkl) must be in a reflection orientation between the incident and diffracted X-ray waves.
2. Diffraction occurs at a specific angle that is determined by the d-spacing of the lattice Figure II.12: Derivation of Bragg's equation, explaining diffraction as reflection on a
These conditions are seemingly very straightforward but are not easy to satisfy experimentally. If we aim a monochromatic X-ray at a crystal in some arbitrary orientation, the Bragg conditions are not satisfied and no diffraction occurs. A crystal has to be rotated to bring a particular lattice plane hkl into a reflecting position, and then the diffraction angle has to be adjusted to fit with the spacing of the lattice plane dhkl. Modern computer-controlled X-ray goniometers can help to alleviate some of these problems, and they are used for special applications. However, a significant experimental advancement came in 1916, when P. Debye and P. Scherrer had the ingenious idea to use powders instead of single crystals.
II-3-2-4- The powder method:
In a powder consists of many randomly oriented small crystals or ‘‘crystallites’’. There will always be some crystallites with lattice planes in the right orientation to diffract (i.e., satisfying the first Bragg condition), and therefore rotation is not necessary. A powder irradiated with monochromatic X-rays of known wavelength will produce diffracted X-rays lying on cones with an opening angle 4θ (i.e., an angle 2θ to the primary X-ray beam). We can intersect these cones with a photographic film, usually mounted in a cylindrical ‘‘Debye-Scherrer’’ camera, [11] [22] and image a set of concentric rings (Figure II.13). After exposure, the film is unrolled, developed and diffraction angles can be measured as distances between dark lines
. Today the most popular powder method uses a powder diffractometer. The powder is suspended on a flat disk, and the reflections are scanned with an electronic detector (Figure II.14) that digitally
Figure II.13: In the powder method diffractions from crystallites lie on cones around the primary beam with an opening angle 4θ. [11]
records the intensity as a function of diffraction angle, as is shown for a sample of cubic halite in (Figure II.15).
Each peak corresponds to diffractions from different lattice planes. The detector rotates with an angular velocity of 2θ, whereas the sample rotates at a velocity θ to maintain the reflection condition for the surface of the sample. It means that, at all diffraction angles, those lattice planes (and only those) that are parallel to the sample surface are diffracting. [22]
Figure II.14: A diffractometer scans the 2θ angle range with an electronic detector to record diffractions from a flat sample. [11]
II-3-2-4-The match software:
"Match" is an easy to use software for phase identification from powder diffraction data. It compares the diffraction pattern of your sample to a database containing reference patterns in order to identify the phases which are present. Additional knowledge about the sample like known phases, elements or density can be applied easily.
Chapter III
III-1-Introduction
This chapter presents and discusses the results of both FTIR and the XRD analysis, and then ends the study with a conclusion.
III-2-FTIR analysis
III-2-1-KBr Disc sample preparation
A KBr disc (Figure III.1) involves mixing of dried KBr powder and finely ground sample. The KBr sample mixture forms a clear disc when put under high pressure using a hydraulic press. Only 4 mg of sample and 200 mg is needed for this sample preparation. The sample must be ground to fine particles using an agate mortar and pestle (Figure III.2).
Figure III.1: KBr discs prepared for the FTIR
III-2-2-Machine information
The FTIR machine was used is Shimadzu FTIR-8300 (Figure III.3) running under the spectral range (400 - 4000 cm−1) the constituent bonds of the sand samples.
III-2-3-Results and discussion
The figures below represent the FTIR transmittance spectrum of El-oued's sand samples
Figure III.4: the FTIR transmittance spectrum of sample S1 Figure III.3: Shimadzu FTIR-8300 machine
Figure III
.5:
the FTIR transmittance spectrum of sample S2As seen above the FTIR spectrums obtained by examining of the El-Oued sand samples are show in Figures (III.4, III.5, III.6, III.7). From the FTIR spectrums we can identify the main components of our samples. Table III.1 summarizes the functional groups found in the sand. In the range of the high wavenumbers we see a high intensity absorption band at 3429 cm−1 which is due to stretching vibrations of hydroxyl groups (OH), a less intense band has been observed at 1616 cm−1, which is due to the twisting of H-O-H .Also, three absorption bands have been observed at wavenumbers of 2511 cm−1, which are due to (CO3) −2 Asymmetrical and symmetrical stretching mode vibrations. The 1427 cm−1 wavenumber feature is due to doubly degenerate asymmetric stretching mode vibration, and the 876 cm−1 one corresponds to the C=O stretching mode vibration. These bands confirm the presence of calcite in our samples. A sharp absorption band at 1080 cm−1 has been observed and seems to fit with symmetrical stretching of Si–O–Si bond. In the spectrum range of 1080 – 400 cm−1 a strong band has been observed [23]. Symmetrical bands at 795 and 779 cm−1 have been observed and correspond to Si-O symmetrical bending vibration. These peaks confirm the presence of quartz. In addition, we observed other bands at 694 and 459 cm−1 which coincide with Si–O–Si symmetrical and asymmetrical bending, respectively. The presence of Si-O and O-Si-O vibrations in our sample again confirm the presence of quartz. The 694 cm−1 band indicates that the
quartz in our samples is crystalline. Thus, FTIR absorption spectrum exhibits only an absorption band characterizing quartz (SiO2) and calcite (CaCO3) compounds in our sand samples [19].
Table III.1: The functional groups found in the sand samples
Band (cm-1) Bond (Vibration mode) Compound
3429, 3406 H − O − H (stretching vibration) Water
2924 or 2920 C − H (stretching vibration) Organic Carbon
2855 or 2858 C − H (stretching vibration) Organic Carbon
2511or 2507 (CO3)
−2 (asymmetrical stretch and symmetrical
stretching) Calcite
1875, 1871 or 1867 Quartz
1798 or 1794 (CO3)
−2 (plane bending and symmetrical stretching
combination mode) Calcite
1620 or 1616 H– OH (stretching) Water
1427 or 1420 (CO3)−2 (asymmetrical stretching) Calcite
1080 Si– O– Si (symmetrical stretching) Quartz
876 (CO3)−2 (out-of-plane bending) Calcite
779,775 Si– O (symmetrical stretching) Quartz
694 or 691 Si– O– Si (symmetrical bending) Quartz
463 or 459 Si– O– Si (asymmetrical bending) Quartz
the FTIR results obtained by examining the sand samples of EL-Oued are almost identical. Also these results suggest the presence of a high purity degree quartz. On the other hand, other studies [15] showed thatthe Western Erg sand and the Ouargla sand in the Algerian Sahara have a considerable amount of Al2O3 and Fe2O3 [19]. The presence of the double absorption at 795 and 779 cm−1 is an indicator of the presence of the quartz in α-phase. This confirms what was said in the first chapter, quartz under the atmospheric pressure and relatively low temperatures exists in the α-phase, the crystallinity index (CI) of quartz in our sample is calculated by measuring the ratio between the absorbance of the bands 695 cm−1 and 795 cm−1 (A695/A795) [13], where the absorbance Aα at
𝐴
α= 𝑙𝑜𝑔
𝑇0𝑇
3.1
where 𝑇0 and 𝑇 are illustrated in figure III.8 :
The table III.2 below presents calculated of quartz in all samples:
Sample 695 (cm
−1) 795 (cm−1)
A695 A795 CI =A695/A795
𝑇0 𝑇 𝑇0 𝑇
S1 58.67 43.34 65.33 26.67 0.132 0.390 0.34
S2 78.67 50 73.33 63.33 0.197 0.064 0.33
S3 54.67 38.67 66.67 20.67 0.150 0.510 0.30
S4 28 18 30 10 0.192 0.477 0.40
This high crystalline nature of quartz in our sampleshas encouraged to further our study with an XRD analysis.
III-2-XRD analysis:
III-2-1-Samples preparation:Before processing the sand samples by the XRD, they first have to be grounded to fine particles (Figure III.9) using mortar and pestle, the necessity of this step is explained in chapter II.
Figure III.8: 𝑇0 and 𝑇 on the FTIR spectrum[19]
III-2-3-Results and discussion:
After exposing the four samples of El-Oued's sand to the x-rays, four diffraction spectrums were obtained. By analyzing these spectrums using the software "match", it was possible to identify dominant chemical compounds present in the sand samples.
The peaks appearing in the figures below at angles 2𝜃 : 20.90◦ ,26.71◦ , 36.63◦, 39.54◦, 42.52◦, 45.90◦, 50.23◦, 55.02◦, 60.06◦, 64.13◦, 68.06◦ correspond to quartz(𝑺𝒊𝑶𝟐). Also the peaks at 29.50◦, 48.80◦ and 73.70◦ are proof for the existence of calcite (𝑪𝒂𝑪𝑶𝟑). The signal peak at 27.71◦ is hint for the presence of Wollastonite in S2.
The reflections at the distances 𝑑ℎ𝑘𝑙 4.2514 , 3.3372 and 1.5405 Å are a confirmation for the presence of α-quartz.
Also using the peaks data obtained by "Match" enabled us to calculate crystallite size of both quartz and calcite. The relation between the width full at half maximum (FWHM) of the most intense diffraction peak given by the software and the crystallite size (D) is given below by Scherrer’s formula [23]:
𝐷 = 𝐾𝜆
𝛽 cos(𝜃) 𝟑. 𝟏 where𝜆 = 1.540593Å is the wavelength of the X-rays used, and 𝐾 = 0.96, 𝜃 is the angle of
diffraction and 𝛽 is Full width at half maximum . [23]
As it was expected in The FTIR analysis, the XRD results of the four samples showed that El-Oued's sand contains high percentage of Quartz(𝑆𝑖𝑂2), however Calcite(𝐶𝑎𝐶𝑂3) only appeared in samples S1, S2 and S4.
Also by processing the XRD spectrums samples using "Match" software, we were able to determine Figure III.9: Sand powder
Also by processing the XRD spectrums samples using "Match" software, we were able to determine the miller indices of each plane, the interplanar distances d and the peaks intensities. This information is shown in the tables below:
Table III.3: Structural properties of El-Oued's sand (S1)
(Diffraction angle ) 2𝜃◦ Interplanar distance(𝐴̇) Miller indices (hkl) FWHM (deg) Crystallite
size(nm) Mineral intensity
20.88 4.2514 1 0 0 0.2000 Quartz 202.13 26.68 3.3380 1 0 1 0.2000 43,5663 Quartz 1000.00 29.48 3.0277 1 0 4 0.2000 Calcite 114.12 36.58 2.4542 1 1 0 0.2000 Quartz 132.78 39.52 2.2787 1 0 2 0.2000 Quartz 119.83 40.33 2.2346 1 1 1 0.2000 Quartz 96.34 42.50 2.1252 2 0 0 0.4000 Quartz 107.29 45.85 1.9773 2 0 1 0.2000 Quartz 97.78 47.50 1.9127 1 0 8 0.2000 Calcite 82.02 48.62 1.8711 1 1 6 0.4000 Calcite 85.90 50.18 1.8166 1 1 2 0.2000 Quartz 123.79 54.81 1.6736 2 0 2 0.2000 Quartz 100.75 57.41 1.6038 2 1 0 0.4000 Quartz 82.51 60.04 1.5396 2 1 1 0.4000 Quartz 138.97
Figure III.10: XRD spectrum of S1
C (3 0 4 ) Q( 3 0 2 ) Q( 3 2 0) Q( 2 1 1 ) Q( 2 1 0 ) Q(1 1 3 ) Q( 2 0 3 ) Q(1 1 2 ) Q( 2 0 2 ) C (1 0 8 ) Q(1 0 0 ) Q(1 1 0) C (1 0 4 ) Q(1 0 1 ) Q(1 0 2 ) Q(1 1 1 ) Q( 2 0 0 ) Q: Quartz C: Calcite Q(1 1 6 ) Q( 2 0 1 )
73.58 1.2863 3 0 6 0.2000 Quartz 104.79
75.74 1.2548 3 0 2 0.2000 Quartz 88.29
77.76 1.2272 2 2 0 0.4000 Quartz 85.98
Table III.4: Structural properties of El-Oued's sand (S2)
(Diffraction angle ) 2𝜃◦ Interplanar distance(𝐴̇) Miller indices (hkl) FWHM (deg) Crystallite
size(nm) Mineral intensity
21.10 4.2070 1 0 0 0.2000 Quartz 214.39 26.89 3.3130 1 0 1 0.2000 43,5854 Quartz 1000.00 27.71 3.2358 4 0 1 0.2000 Wollastonite 155.46 29.69 3.0068 1 0 4 0.2000 43,8821 Calcite 134.29 36.79 2.4409 1 1 0 0.2000 Quartz 116.88 39.72 2.2672 1 0 2 0.2000 Quartz 118.23 40.55 2.2229 1 1 1 0.2000 Quartz 113.17 42.72 2.1147 2 0 0 0.2000 Quartz 136.82 46.03 1.9703 2 1 0 0.2000 Quartz 105.37 48.80 1.8646 1 1 6 0.4000 Calcite 98.15 50.40 1.8090 1 1 2 0.4000 Quartz 129.78 55.00 1.6682 2 0 2 0.2000 Quartz 116.13 60.22 1.5354 2 1 1 0.2000 Quartz 146.01 64.28 1.4479 1 1 3 0.2000 Quartz 98.73 66.00 1.4143 3 0 0 0.2000 Quartz 98.99 68.29 1.3724 2 0 3 0.2000 Quartz 134.08 73.70 1.2845 3 0 6 0.2000 Calcite 102.08 75.95 1.2519 3 0 2 0.2000 Quartz 103.39
Figure III.11: XRD spectrum of (S2)
C (3 0 4) Q( 3 0 2 ) Q( 3 2 0) Q( 2 1 1 ) Q( 2 1 0 ) Q(1 1 3 ) Q( 2 0 3 ) Q(1 1 2 ) Q( 2 0 2 ) Q(1 0 0 ) Q(1 1 0) C (1 0 4 ) Q(1 0 1 ) Q(1 0 2 ) Q(1 1 1 ) Q( 2 0 0 ) W (4 0 1 ) Q( 3 0 0 ) Q( 2 0 1 ) C (1 1 6 ) Q: Quartz C: Calcite W: Wollastonite
The third sample one of its kind, due to its odd peaks pattern, in this sample two peaks related to Gypsum (CaSO4. 2H2O) were noticed, whereas these peaks didn’t appear in the other samples. Also, unlike the other samples, in this spectrum fewer peaks related quartz and none of calcite appeared. The only logical explanation of these observations is as follows:
the reason behind the presence of gypsum in this sample, is that it was taken from a region where there is a lot of traditional houses ruins, the essential building material of these building is gypsum and through weathering it was mixed with the surrounding sand.
The appearance of only few peaks related to quartz and calcite is due to the poor grounding of the sample. This made the chances of getting more atomic layers at angles that meet Bragg’s equation too slim.
Figure III.12: XRD spectrum of S3
G (0 2 0 ) G (1 0 1 ) Q: Quartz G: Gypsum Q( 1 0 1 ) Q( 2 0 0 ) Q( 1 0 0 ) Q( 2 2 0 )
(Diffraction angle ) 2𝜃◦ Interplanar distance(𝐴̇) Miller indices (hkl) FWHM (deg) Crystallite
size(nm) Mineral intensity
20.90 4.2474 1 0 0 0.2000 Quartz 183.14 26.71 3.3344 1 0 1 0.2000 43,5745 Quartz 1000.00 29.51 3.0248 1 0 4 0.2000 43,8897 Calcite 139.69 36.63 2.4515 1 1 0 0.2000 Quartz 129.92 39.54 2.2775 1 0 2 0.2000 Quartz 113.22 42.52 2.1244 2 0 0 0.2000 Quartz 116.91 45.90 1.9757 2 0 1 0.4000 Quartz 114.83 50.23 1.8149 1 1 2 0.2000 Quartz 131.88 55.02 1.6677 2 0 2 0.2000 Quartz 120.58 60.06 1.5393 2 2 1 0.2000 Quartz 114.43 64.13 1.4510 1 1 3 0.2000 Quartz 108.04 68.06 1.3765 2 0 3 0.2000 Quartz 132.69
Also processing the data obtained by the XRD using the software "Match" enabled us to draw out some structural information of the materials composing El-Oued's sand, such as the unit cell dimensions (a, b, c), crystal system and the space group. The tables (Table III.6 and Table III.7) sum up all this information.
Figure III.13: XRD spectrum of S4
Q(1 0 0 ) Q( 2 0 0 ) Q( 1 0 2 ) C (1 0 4 ) Q( 1 0 1 ) Q( 1 1 0 ) Q( 2 2 1 ) Q(1 1 2 ) Q( 2 0 2 ) Q( 2 0 3 ) Q( 2 0 1 ) Q(1 1 3 ) Q: Quartz C: Calcite
Table III.6: Structural information of Quartz in El-Oued's sand (S1,S2,S3,S4)
Chemical formula 𝑆𝑖𝑂2
Type α-quartz
Molar mass (u.m.a) 60.08
Density (g/m3) 2.66
Crystal system Hexagonal
Space group P3221
a (Ȧ) 4.7750
b (Ȧ) 4.7750
c (Ȧ) 5.3046
Table III.7: Structural information of Calcite in El-Oued's sand (S1, S2, S4)
The calculated values of quartz 𝑆𝑖𝑂2 cell dimensions were so close to values given by the "ASTM " paper (01-085-0794) a =b= 4,9100 Ȧ ,c= 5,4000 Ȧ. For calcite 𝐶𝑎𝐶𝑂3 the values provided by the "ASTM " (01-083-1762) a =b= 4,9896 Ȧ ,c= 17,0610 Ȧ , were also very close to the calculated ones. Sample 4 (S4) was intentionally picked from a region north El-Oued, and samples S1 and S3 from a region south El-Oued. From the results obtained by the FTIR method and the XRD method showed a high presence of quartz in all those samples, so basically in the light of the results we can tell that
Chemical formula 𝐶𝑎𝐶𝑂3
Type Calcite
Molar mass (u.m.a) 100.08
Density (g/m3) 2.720
Crystal system Hexagonal
Space group R3̅c
a (Ȧ) 4.9844
b (Ȧ) 4.9844
General conclusion:
The aim of our study was to enrich our background and reinforced the studies that has been conducted on El-Oued's sand. The most appealing thing about sand is its abundance. Sand covers vast areas of Algeria's surface. It also has a high minerals content like quartz. Quartz is magical mineral and has a wide range of applications and is used in too many modern industries such as building, glass making and electronics.
For the purpose of our study four samples were taken from different regions in El-Oued, to prepare these samples of the FTIR and XRD examination they were grounded and crushed to fine powders using a mortar and pestle.
To examine the samples by The FTIR method, a specific amount of KBr was added. The mixture KBr and sand powder was turned into a disc using a hydraulic press. These discs were exposed to an infrared radiation of a wavenumber spectral range (400 - 4000 cm−1). Four spectrums were obtained and Each absorption band in these spectrums correspond to a certain chemical compound. By this way we have managed to determine the presence of compounds like water, Calcite and most importantly quartz. Moreover, we calculated the crystallinity indices of quartz and the results ordered from S1 to S4 were as follows: 0.34, 0.33, 0.30 and 0.40. These results encouraged us to further our study with the XRD method.
In the XRD method we had to make sure that samples are fine powders. The XRD spectrums obtained held the fingerprint peaks of both quartz (dominating), calcite (minority) and no trace of feldspar was found. Using the match software enabled us to determine and calculate the interplanar distances and miller indices, also we were able to calculate the crystallite size of both quartz and calcite. Using the same software "Match" we have drawn out information on the sand quartz and calcite like the Density, space group, unit cell dimension and the crystal system.
Our study can also furthered by the examination of other sand properties such as the thermal conductivity.
A
S1 Match report
B
S2 Match report
C
D
S4 Match report
[1] Mehdadi Nouia, " composition determination of sand color genera of Ourgla dunes", Doctorate thesis", University of Ouragla, P.2-5, 20,37,38, (2017)
[2] Kok J F, Parteli E J R, Michaels T I and Bou Karam ,The physics of windblown sand and dust, Rep. Prog. Phys. 75 106901, (2012)
[3] Ralph D. Lorenz James R. Zimbelman, How Windblown Sand Shapes Planetary Landscapes, Springer, Berlin Heidelberg, p 17-23,( 2014).
[4] www.universetoday.com/139502/theres-sand-on-titan-where-does-it-come-from-1/
[5] Kenneth Pye · Haim Tsoar, Aeolian Sand and Sand Dunes, Springer, Berlin Heidelberg, p 142, (2009). [6] Hakon Wadell, Volume, Shape, and Roundness of Quartz Particles, The Journal of Geology, Vol. 43, No. 3 (1935).
[7] Friedman, G.M., Sanders, J.E, and Kopaska-Merkel, D.C., 1992, Principles of Sedimentary Deposits: Stratigraphy and Sedimentology: Macmillan Publishing Company, New York, 717p.
[8] www.sand.org/page/industrial_sand
[9] Industrial Silica sand, Mining in Minnesota, Minnesota Department of Natural Resources,2012 [10] https://www.ima-na.org/page/what_is_ind_sand
[11] Hans-Rudolf Wenk and Andrei Bulakh, Minerals- Their Constitution and Origin, the University Press, Cambridge, P.313-319,P.117-127,(2004).
[12] A.J. EASTON, Chemical Analysis of Silicate Rocks, Volume 6 - 1st Edition - Elsevier
[13] Samiha Beddiaf, Smail Chihi and Youcef Leghrieb, The determination of some crystallographic parameters of quartz, in the sand dunes of Ouargla, Algeria, Journal of African Earth Sciences,106, (2015)
[14] Andrew J Barker,A key for identification of rock-forming minerals in thin-section,Balkema Book,P.18-112,(2014)
[15] www.quartzpage.de/gen_struct.html
[16] C. LU, ELSEVIER SCIENCE PUBLISHERS B.V, Amsterdam, The Netherlands, (1984) [17] www.explainthatstuff.com/piezoelectricity.html
[18] Brian C.Smith, fundamentals of Fourier transform infrared spectroscopy, CRC Press, the United States of America, P.4-11,(2011).
[19] BEDDIAF Samiha, Determination of the molecular composition and the quartz concentration in the different granular types of Ouargla dunes sand using spectroscopic techniques, Doctorate LMD thesis, University of Kasdi Merbah Ouargla, Algeria, P.1-3,(2016).
[20] Kazuo Nakamoto,Infrared and Raman Spectra of Inorganic and Coordination Compounds, Part B: Applications in Coordination, Organometallic, and Bioinorganic Chemistry,Wily,P.45-59,(1997)
[21] www.intechopen.com/books/infrared-spectroscopy-principles-advances-and applications/introductory-chapter-infrared-spectroscopy-a-synopsis-of-the-fundamentals-and-applications
[22] C. Hammond,The Basics of Crystallography and Diffraction,Oxford University Press,University of leeds,P.144-178 ,(2009)
[23] Nassima Meftah and Mohammed Sadok Mahboub, Spectroscopic Characterizations of Sand Dunes Minerals of El-Oued (Northeast Algerian Sahara) by FTIR, XRF and XRD Analyses, Silicon, ISSN 1876-990X, (2019).
![Figure I.1: Dunes on Titan seen in Cassini’s radar (a) that are similar to Namibian sand dunes on Earth [3] (b) .](https://thumb-eu.123doks.com/thumbv2/123doknet/12266348.321261/13.892.168.761.528.1075/figure-dunes-titan-cassini-radar-similar-namibian-earth.webp)
![Table I.1:The Chemical analysis of sand samples taken from various regions around the world [1] [23]](https://thumb-eu.123doks.com/thumbv2/123doknet/12266348.321261/14.892.231.733.230.549/table-chemical-analysis-samples-taken-various-regions-world.webp)
![Figure I.5: The stability fields of some silica polymorphs [11]](https://thumb-eu.123doks.com/thumbv2/123doknet/12266348.321261/18.892.182.720.82.533/figure-i-stability-fields-silica-polymorphs.webp)
![Table I.3: Moh's hardness scale [11]](https://thumb-eu.123doks.com/thumbv2/123doknet/12266348.321261/19.892.130.820.787.1064/table-i-moh-s-hardness-scale.webp)
![Figure I.11: The electrical potential between deformed surfaces [15]](https://thumb-eu.123doks.com/thumbv2/123doknet/12266348.321261/24.892.111.825.590.969/figure-i-electrical-potential-deformed-surfaces.webp)

![Figure II.5: symmetric and asymmetric stretching [19]](https://thumb-eu.123doks.com/thumbv2/123doknet/12266348.321261/30.892.226.730.104.303/figure-ii-symmetric-and-asymmetric-stretching.webp)
