A comparison of the fast stimulation multifocal-ERG in patients with an IOL
and control groups of different age
Anja M. Palmowski-Wolfe
1& Ursula Woerdehoff
21
University of Basel, Eye Hospital, Mittlere Str.91, CH 4053, Basel, Switzerland;2Children’s Hospital, Bad Kreuznach, Germany
Accepted: 26 October 2005
Key words: age, IOL, mfERG
Abstract
Purpose: It has been shown that a cataract significantly reduces mfERG responses in the central 4–14°. Removing the cataract, leads to a significant increase in the response of the central 4°. In this study we compare the mfERG of Woerdehoff et al.’s patients’ [Doc Ophthalmol 2004; 108(1): 67–75] following cataract surgery to a healthy control group in order to assess whether, in the elderly, further influences of age need to be considered in addition to optical effects. Methods: Eighteen patients with an IOL following cataract surgery and 29 healthy volunteers (without clouding of the media or retinal changes) underwent testing of the mfERG (103 hexagons stimulating the central 50°, M-sequence 215, Lmax: 200 cd/m
2
, Lmin
<1 cd/m2). For the first order response component we compared the latencies of N1,P1 and N2 as well as the natural logarithm (ln) of the amplitudes N1P1 and P1N2 for four group averages: I. the central 4°, II. 4–7°, III. 7–10° and IV. 10–15°. Results: Mean age was 67 years (SD 10.1) for the IOL patients, 28.5 years (SD 5.6) for a young group of controls (n=15) and 60.2 years (SD 9.2) for the older control group (n=14). Patients with an IOL did not differ in latency from either control group (ANOVA, Tukey). Interestingly, at 10–15° eccentricity, the latency of N2 differed significantly between the younger (41.4 ms, SD 1.4) and the older (43.0 ms, SD 1.9) control group. In the central 4° LnN1P1 amplitudes were significantly lower in the IOL group (mean: 3.7, SD 0.2) than either the younger (mean: 3.9, SD 3.3) or the older (mean: 4.0, SD 0.3) control group. In all other amplitude measures, the older control group had slightly larger mean amplitudes than the younger control group and significantly larger amplitudes than the patients with an IOL, whose amplitudes were lowest. Discussion: Both, primarily optical but also neural phenomena have been de-scribed to affect the mfERG changes observed with age. Our results, are in support of this, as the improvement of the mfERG response following cataract surgery does not seem to reach the level of a healthy control group of equal age. Thus, our results suggest, that a control group with an IOL should be used when retinal function is tested in subjects with an IOL.
Introduction
It has recently been shown that a cataract signifi-cantly reduces mfERG responses in the central 4–14° [1, 2]. On the other hand, removing the cataract, leads to a significant increase in the re-sponse of the central 4° [1]. This suggests, that following cataract extraction, the mfERG may
recover to normal values. If this were the case, the mfERG in patients with a retinal problem who happen to have an IOL might be compared to a healthy control group, although it needs to be determined, whether this control group would have to be age matched, as recent literature con-tains conflicting reports on the influence of age on the mfERG: While some report no change
with age [3], most studies report a reduction in amplitudes with or without an increase in laten-cies [4–11]. These age related changes have been thought to occur primarily as a result of an increasing lens opacity with age [7]. However, others have suggested neural changes to be addi-tionally involved in these effects[6].
In this study we therefore compare the mfERG of pseudophake [1] to an age matched as well as to a younger healthy control group in or-der to assess whether, in the elor-derly with an IOL, further influences of age need to be considered in addition to optical effects.
Methods
Eighteen pseudophake patients and 29 healthy volunteers underwent testing of the mfERG.
Mean age was 67 years (SD 10.1) for the IOL patients, 28.5 years (SD 5.6) for a young group of controls (n=15) and 60.2 years (SD 9.2) for the older control group (n=14). Visual acuity was over 0.8 in patients with an IOL and 1.0 in the control group.
In either patients or subjects, inclusion criteria included the absence of clouding of the optic med-ia, other eye disease, such as glaucoma, or systemic diseases that might affect the mfERG recording, such as diabetes mellitus, as well as refractive errors exceeding 6 dioptres spherical correction and 3 dioptres astigmatic correction. No previous eye surgery – other than the cataract surgery in patients-had been performed in the eyes recorded from.
Patients with an IOL were taken from the study of Woerdehoff et al. [1]. In these patients, the mfERG was recorded prior to and at least 6 weeks following cataract surgery. Patient pt15 who suffered from retinal dysfunction secondary to an eye trauma was excluded. Three patients received a multifocal IOL, while the others re-ceived a monofocal IOL.
In patients the eye undergoing cataract sur-gery was included. In 14 patients this was the right eye, in 4 the left eye. In the control subjects the right eye was included, unless it did not fulfil the inclusion criteria. In this case the patients’ left eye was included (n=2).
In agreement with the declaration of Helsinki, approval from the ethic comittee had been ob-tained and participants had given their informed consent in writing.
MfERGs were recorded with VERIS sci-enceTM (EDI, San Mateo, California) using a Burian- Allen bipolar contact lens electrode. The stimulus was presented on a monochrome moni-tor. During recording, 103 hexagons stimulated the central 50° of the retina. Hexagons were scaled with eccentricity to take into account the distribution of retinal cones in this area. Hexa-gons flickered between light (Lmax: 200 cd/m2)
and dark (Lmin<1 cd/m2) according to an
M-se-quence of 215 [12]. An artefact elimination tech-nique was applied once [12]. Individual responses were not additionally averaged with their neigh-bouring responses.
For the first order response component we compared the latencies of N1, P1 and N2 as well
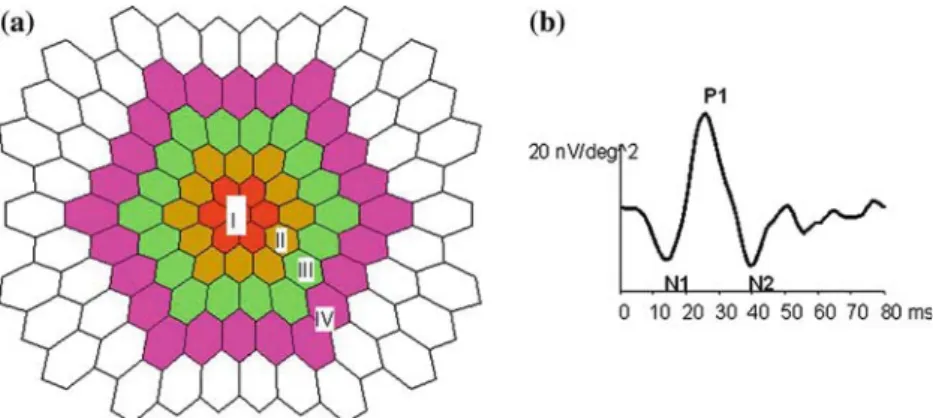
Figure 1. (a) Shows the area of the responses that were averaged for analysis: I. the central 4°, II. 4–7°, III. 7–10° and IV. 10–15°. (b Depicts a typical waveform of the first order response. For the first order response component we compared the latencies of N1,P1 and N2 as well as the natural logarithm (ln) of the amplitudes of N1P1 and P1N2 for the four group averages shown in 1a.
as the amplitudes of N1P1 and P1N2 for four group averages: I. the central 4°, II. 4–7°, III. 7– 10° and IV. 10–15°. Figure 1 demonstrates the area of the responses that were averaged for analysis (Figure 1a) as well as a waveform show-ing N1, P1 and N2 (1b). As amplitudes are not normally distributed, they were normalized using the natural logarithm (ln).
For statistical analysis an ANOVA was per-formed, followed by a Tukey post hoc test. The resulting p-value was considered significant if it was below 0.05.
Results
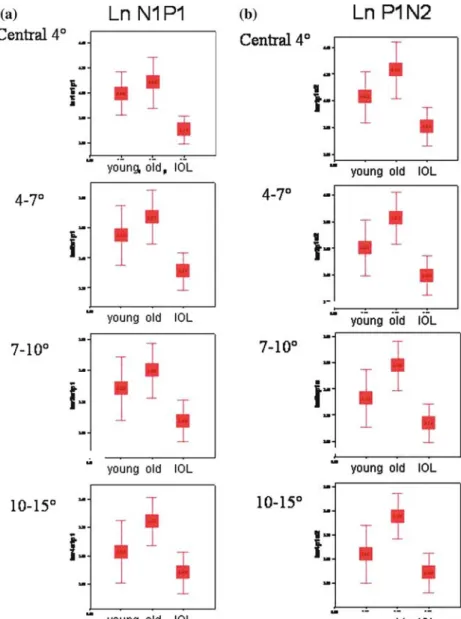
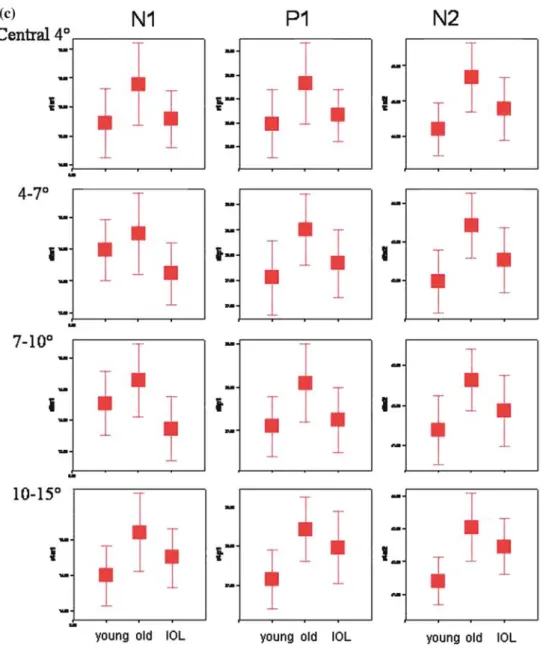
Tables 1 and 2 show the resulting mean ampli-tudes and latencies and their corresponding stan-dard deviation, while Figure 2 allows comparison of the ln amplitudes (Figure 2a and b) as well as of the latencies (Figure 2c).
Latencies did not differ between the pseud-ophake patients and the control groups (ANO-VA, Tukey). Interestingly, between the younger and the older control group the latency of N2 differed significantly at 10–15° eccentricity (p=0.032). Here the mean latency of N2 was 41.4 ms (SD 1.4) in the younger control group and 43.0 ms (SD 1.9) in the older control group (Table 2. Figure 2c). This compared to a mean latency of N2 of 42.5 ms (SD 1.7) in the pseud-ophake patients.
Amplitudes in the central 4° LnN1P1 (natural log) were lower in the IOL group (mean: 3.7, SD 0.2) than either the younger (mean: 3.9 (SD 3.3), p= 0.043) or the older control group (mean: 4.0 (SD 0.3), p=0.006).
In all other amplitude measures, the older control group had slightly larger mean ampli-tudes than the younger control group and signifi-cantly larger amplitudes than the patients with an IOL, whose amplitudes were lowest (Table 1,
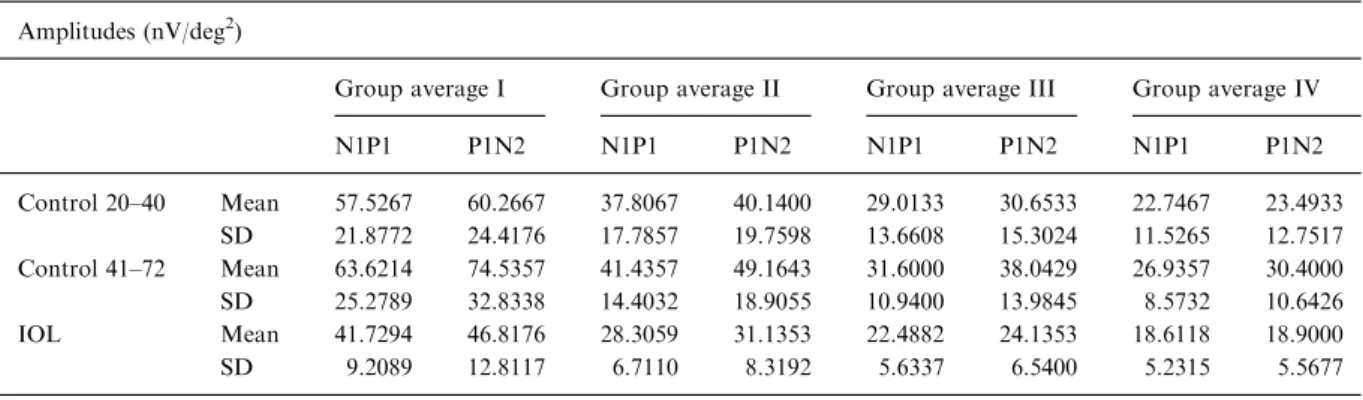
Table 1. Shows the mean amplitudes and their corresponding standard deviation for a young control group aged 20–40 years, for an older control group aged 41–72 years and for the patients with an IOL
Amplitudes (nV/deg2)
Group average I Group average II Group average III Group average IV
N1P1 P1N2 N1P1 P1N2 N1P1 P1N2 N1P1 P1N2 Control 20–40 Mean 57.5267 60.2667 37.8067 40.1400 29.0133 30.6533 22.7467 23.4933 SD 21.8772 24.4176 17.7857 19.7598 13.6608 15.3024 11.5265 12.7517 Control 41–72 Mean 63.6214 74.5357 41.4357 49.1643 31.6000 38.0429 26.9357 30.4000 SD 25.2789 32.8338 14.4032 18.9055 10.9400 13.9845 8.5732 10.6426 IOL Mean 41.7294 46.8176 28.3059 31.1353 22.4882 24.1353 18.6118 18.9000 SD 9.2089 12.8117 6.7110 8.3192 5.6337 6.5400 5.2315 5.5677
Table 2. Depicts the mean latencies and their corresponding standard deviation for a young control group aged 20–40 years, for an older control group aged 41–72 years and for the patients with an IOL
Latencies (ms)
Group average I Group average II Group average III Group average IV
N1 P1 N2 N1 P1 N2 N1 P1 N2 N1 P1 N2 Control 20–40 Mean 15.2333 28.4867 44.2067 14.4933 27.5600 41.9800 14.2733 27.1067 41.4067 14.5000 27.1667 41.4267 SD 1.1574 1.3907 1.4602 0.9331 1.3984 1.5758 0.9903 1.3392 1.6455 0.8194 1.4505 1.4210 Control 41–72 Mean 15.9000 29.3357 45.6714 14.7429 28.5071 43.4214 14.6429 28.1071 42.6500 15.1071 28.4500 43.0643 SD 1.3342 1.5805 1.8433 1.1921 1.3205 1.5846 1.1036 1.6836 1.4179 1.0299 1.5356 1.9274 IOL Mean 15.2941 28.6647 44.7824 14.1176 27.8412 42.5294 13.8647 27.2588 41.8824 14.7529 27.9824 42.4765 SD 1.0201 1.1152 1.8294 0.9983 1.3933 1.7367 1.0612 1.5500 1.8256 0.8581 1.8782 1.7452
Figures 2a and b). Significant amplitude differ-ences are listed below: In the central 4°, mean LnP1N2 was 4.23 in the older control group and 3.81 in the IOL patients (p=0.005, Tukey). Be-tween 4 and 7° mean LnN1P1 was 3.67 in the older control group and 3.31 in the IOL patients (p=0.013, Tukey), while mean LnP1N2 was 3.83 in the older control group and 3.4 in the IOL pa-tients (p=0.005, Tukey). From 7 to 10° mean LnN1P1 was 3.4 in the older control group and
3.08 in the IOL patients (p=0.029, Tukey), while mean LnP1N2 was 3.58 in the older control group and 3.14 in the IOL patients (p= 0.005, Tukey). In the outer 10–15° mean LnN1P1 was 3.25 in the older control group and 2.88 in the IOL patients (p=0.022, Tukey), while mean LnP1N2 was 3.36 in the older control group and 2.89 in the IOL patients (p=0.006, Tukey).
The slight difference in age had no significant influence on the statistical outcome (ANOVA).
Figure 2. The boxplots in (a–c) show the ln amplitudes of N1P1 (a) and P1N2 (b) as well as the latencies of N1, P1 and N2 (c) for a young control group aged 20–40 years, an older control group aged 41–72 years and for the patients with an IOL. The error bars represent ±2 standard errors of the mean. Non-overlap between 2 SEs of adjacent means implies a significant difference at the 5% level (p<0.05). The values in the ln amplitude plots are the mean ln amplitude values.
Discussion
Both, primarily optical but also neural phenom-ena have been described to affect the mfERG changes observed with age [6, 7]. In this context, response density is thought to be more influenced by optical factors while P1 implicit time changes are more influenced by neural factors [6].
If clearness of the optical axis alone were to account for the changes in the mfERG observed with age [4–11], patients with clear optical media should have mfERG responses comparable to a
young healthy control group. Thus, with an IOL, the responses should also be better (amplitudes higher and latencies longer) than those of an age matched control group, where the lens is known to increase in density with age [13].
Another optical factor that needs to be taken into account is that IOLs generally transmit more blue light than the natural lens [14]. The phosphor used in our monochromatic monitor has a double peaked spectral energy distribution with one peak at around 450 nm and a second peak at around 550 nm. A recent study showed that flashes of
blue, green or white light produce a photopic hill response with an almost identical amplitude (Vmax) [15]. Thus it might be expected that
follow-ing cataract surgery, the increase in blue light transmittance would cause an increase in ampli-tude in the patients with an IOL. However, the improvement seen in the central mfERG response following cataract surgery [1] did not even reach the level of a healthy control group of equal age.
Recently intravitreal surgery with peeling of the internal limiting membrane has been shown to have no effect on inner or outer retinal func-tion of the mfERG [16]. Therefore, a reducfunc-tion in macular function secondary to the surgical light exposure also seems unlikely as a cause of the reduction in amplitude observed in this study.
The slight difference in visual acuity alone would also not account for the reduced ampli-tudes seen in the pseudophakes. A previous study showed that optical degradation through plus- or minus-lenses did not result in changes in the mfERG of healthy subjects [17]. Also, there is no direct relation between visual acuity and the amplitudes of the mfERG, as the mfERG re-sponses are an averaged response over a retinal area of various size, whereas visual acuity is de-fined by the function of a few central photore-ceptors.
Thus, as optical factors alone cannot explain the mfERG changes observed, our results, are in support of neural factors in addition to optical factors influencing mfERG changes in patients with an IOL.
In our study, amplitudes tended to be slightly higher in our older than in our younger control group. This may present either a selection bias or represent a biological advantage in these older subjects without age related diseases.
Our findings of high amplitudes in the elderly is in contrast to previous findings that show amplitudes to decrease with age [4–11]. However, the inclusion criteria for elderly subjects differ between these studies. As an example, patients with upto five small drusen were included in one study [11], while another allowed a visual acuity of 0.8 or higher [10]. This makes it difficult to compare subject populations, as it is known, that for example drusen affect the mfERG response [18, 19]. Thus the population in elderly control subjects may differ between studies.
Patients with a cataract are known to have an increased risk of developing other age related dis-eases such as artherosclerosis [20] or age related macular degeneration [21], suggesting that pa-tients with a cataract may age faster and thus have a greater likelihood of being affected by subclinical retinal pathology. In comparison, this would mean, that older patients without a cata-ract are likely to age slower. Thus our elderly control group consisting of subjects with clini-cally very clear lenses and no retinal abnormali-ties may have a biological advantage.
Thus, our results suggest, that a control group with an IOL should be used when retinal function is tested in subjects with an IOL.
Acknowledgements
We thank Andy Scho¨tzau for statistical advice and Dorothea Leifert for critical reading of the manuscript.
References
1. Woerdehoff UV, Palmowski AM, Heinemann-Vernaleken B, Allgayer R, Ruprecht KW. Influence of cataract on the multifocal ERG recording–a pre- and postoperative com-parison. Doc Ophthalmol 2004; 108(1): 67–75.
2. Tam WK, Chan H, Brown B, Yap M. Effects of different degrees of cataract on the multifocal electroretinogram. Eye 2004; 18(7): 691–6.
3. Palmowski AM, Bearse MAJ, Sutter EE. Variability and replicability of the ERG topography in normals. Invest Ophthalmol Vis Sci 1997; 38(4): S877.
4. Langrova H, Seeliger MW, Kretschmann U, Dietrich TJ, Besch D, Zrenner E. Age dependence of multifocal ERG amplitude and implicit time. in International Society for Clinical Electrophysiology of Vision, 36th Symposium. 1998. Hradec Kralove: ISCEV and ATD Press Hradec Kralove.
5. Mohidin N, Yap MK, Jacobs RJ. Influence of age on the multifocal electroretinography. Ophthalmic Physiol Opt 1999; 19(6): 481–8.
6. Gerth C, Garcia SM, Ma L, Keltner JL, Werner JS. Multifocal electroretinogram: age-related changes for dif-ferent luminance levels. Graefes Arch Clin Exp Ophthal-mol 2002; 240(3): 202–8.
7. Fortune B, Johnson CA. Decline of photopic multifocal electroretinogram responses with age is due primarily to preretinal factors. J Opt Soc Am 2002; 19(1): 173–84. 8. Jackson G, Ortega J, Girkin C, Rosenstiel C, Owsley C.
Aging-related changes in the multifocal electroretinogram. J Opt Soc Am A Opt Image Sci Vis 2002; 19(1): 185–9. 9. Nabeshima T, Tazawa Y, Mita M, Sano M. Effects of
aging on the first and second-order kernels of multifocal electroretinogram. Jpn J Ophthalmol 2002; 46(3): 261–9.
10. Seiple W, Vajaranant TS, Szlyk JP, Clemens C, Holopigian K, Paliga J, Badawi D, Carr RE. Multifocal electroreti-nography as a function of age: the importance of norma-tive values for older adults. Invest Ophthalmol Vis Sci 2003; 44(4): 1783–92.
11. Tzekov RT, Gerth C, Werner JS. Senescence of human multifocal electroretinogram components: a localized approach. Graefes Arch Clin Exp Ophthalmol 2004; 242(7): 549–60.
12. Sutter EE, Tran D. The field topography of ERG components in man - I. The photopic luminance response. Vision Res 1992; 32(3): 433–46.
13. Cooper GF, Robson JG. The yellow colour of the lens of man and other primates. J Physiol 1969; 203: 411–17. 14. Ernest P. Light-transmission-spectrum comparison of
foldable intraocular lenses. J Cataract Refract Surg 2004; 30(8): 1755–8.
15. Rufiange M, Dumont M, Lachapelle P. Modulation of the human photopic ERG luminance-response function with the use of chromatic stimuli. Vision Res 2005; 45(17): 2321–30.
16. Yamamoto S, Ogata K, Hayashi M, Mizunoya S. Changes in multifocal oszillatory potentials after macular hole surgery with internal limiting membrane peeling. in Inter-national Society for Clinical Electrophysiology of Vision XLIII Symposium. 2005. Glasgow: ISCEV.
17. Palmowski AM, Berninger T, Allgayer R, Heinemann-Vernaleken B, Rudolph G. Effects of refractive blur on the multifocal electroretinogram. Doc Ophthalmol 1999; 99: 41–54.
18. Gerth C, Hauser D, Delahunt PB, Morse LS, Werner JS. Assessment of multifocal electroretinogram abnormalities and their relation to morphologic characteristics in patients with large drusen. Arch Ophthalmol 2003; 121(10): 1404–14. 19. Palmowski AM. Multifocal stimulation techniques in ophthalmology – Current knowledge and perspectives. Strabismus 2003; 11(4): 229–37.
20. Street D, Javitt J, Wang Q, Tielsch J, Canner J, Bass E, Steinberg E. Atherosclerotic disease in patients undergoing cataract extraction. A nationwide case-control study. The Cataract Patient Outcomes Research Team. Arch Oph-thalmol 1996; 114(11): 1407–11.
21. Buch H, Vinding T, la Cour M, Jensen G, Prause J, Nielsen N. Risk factors for age-related maculopathy in a 14-year follow-up study: the Copenhagen City Eye Study. Acta Ophthalmol Scand 2005; 83(4): 409–18.
Address for correspondence: Anja M. Palmowski-Wolfe, University of Basel, Eye Hospital, Mittlere Str.91, CH 4053, Basel, Switzerland
Phone: +41-61-265-8722; Fax: +41-61-265-8632; E-mail: [email protected]