HAL Id: hal-02958609
https://hal.archives-ouvertes.fr/hal-02958609
Submitted on 9 Oct 2020
HAL is a multi-disciplinary open access
archive for the deposit and dissemination of
sci-entific research documents, whether they are
pub-lished or not. The documents may come from
teaching and research institutions in France or
abroad, or from public or private research centers.
L’archive ouverte pluridisciplinaire HAL, est
destinée au dépôt et à la diffusion de documents
scientifiques de niveau recherche, publiés ou non,
émanant des établissements d’enseignement et de
recherche français ou étrangers, des laboratoires
publics ou privés.
Changes in Meridional Temperature and Salinity
Gradients in the North Atlantic Ocean (30°-72°N)
during the Last Interglacial Period
Elsa Cortijo, Scott Lehman, Lloyd Keigwin, Mark Chapman, Didier Paillard,
Laurent Labeyrie
To cite this version:
Elsa Cortijo, Scott Lehman, Lloyd Keigwin, Mark Chapman, Didier Paillard, et al.. Changes in
Meridional Temperature and Salinity Gradients in the North Atlantic Ocean (30°-72°N) during the
Last Interglacial Period. Paleoceanography, American Geophysical Union, 1999, 14 (1), pp.23-33.
�10.1029/1998PA900004�. �hal-02958609�
PALEOCEANOGRAPHY, VOL. 14, NO. 1, PAGES 23-33, FEBRUARY 1999
Changes
in meridional temperature and salinity gradients
in the North Atlantic Ocean (30ø-72øN)
during the last
interglacial period
Elsa
Cortijo,
• Scott
Lehman?
Lloyd
Keigwin,
4 Mark
Chapman,
s Didier
Paillard,
• and
Laurent
Labeyrie
•'•
Abstract. Eight deep-sea
sediment
cores from the North Atlantic Ocean ranging from 31 ø to 72øN are studied
to
reconstruct
the meridional
gradients
in surface
hydrographic
conditions
during
the interval
of minimum
ice volume
within
the
last
interglacial
period.
Using
benthie
foraminiferal
$•SO
measurements
and
estimates
of Sea
Surface
Temperature
(SST) and Sea Surface
Salinity
(SSS),
we show
that summer
SSTs
and SSSs
decreased
gradually
during
the interval
of
minimum
ice volume
at high-latitude
sites
(52ø-72øN)
whereas
they
were
stable
or increased
during
the same
time period
at low-latitude
sites
(31
ø-41
øN). This increase
in meridional
gradients
of SSTs
and SSSs
may have
been
due
to changes
in
the latitudinal
distribution
of summer
and annual-average
insolation
and associated
oceanic
and atmospheric
feedbacks.
These
fiends
documented
for the Eemian
ice volume
minimum
period
are similar
to corresponding
changes
observed
during the Holocene and may have had a similar origin.1. Introduction
Societal interest in the character of possible future climate variation and lingering uncertainty regarding the stability of the climate during the last interglacial period (the Eemian in Europe and isotopic substage 5e in marine records [Mangerud et al., 1979]) have stimulated renewed interest in natural climate variability during warm intervals. Interest in the last interglacial period, in particular, was peaked by initial results from the deeper portions of the Greenland Ice Core Project (GRIP) suggesting that the climate of Eemian was not uniformly warm [Climate: Long-Range Investigation Mapping and Prediction (CLIMAP) Project Members, 1984] but experienced rapid climatic coolings [Dansgaard et al., 1993]. It is now well established that ice originally thought to correspond to the Eemian in GRIP has been disturbed [Fuchs and Leuenberger, 1996]. Nevertheless, several subsequent studies in continental and marine environments have shown that Eemian climate was not as stable as previously suggested [,4dkins et al., 1997; Cortijo et al., 1994; FieM et al., 1994; Fronval and Jansen, 1996; Keigwin and Jones, 1994; Seidenkrantz et al., 1995]. These underscore the continued need to evaluate the nature and origin of climate variability during the last interglacial period and other warm intervals.
1Laboratoirc des Sciences du Climat et de l'Environnement,
Laboratoire mixte CNRS/CEA, Gif-sur-Yvette, France.
2 Institute of Arctic and Alpine Research, University of Colorado,
Boulder.
3 Also
at Department
of Geological
Sciences,
University
of Colorado,
Boulder.
4 Woods Hole Oceanographic Institution, Woods Hole,
Massachusetts.
• Godwin
Laboratory,
Department
of Earth
Sciences,
University
of
Cambridge, Cambridge, England, United Kingdom.6 Also
at D•partement
des
Sciences
de la Terre,
Universit6
d'Orsay,
Orsay, France.
Copyright 1999 by the American Geophysical Union.
Paper number 1998PA900004. 0883-8305/99 / 1998 P A900004 $12.00
In this study we use faunal and stable isotope analyses of foraminifera in eight sediment cores from 30 ø to 72øN in the North Atlantic Ocean to reconstruct and evaluate changes in surface hydrography during the ice volume minimum period within marine isotopic substage 5e. Although there is little evidence of dramatic variability in SST or SSS during the ice volume minimum period, we show that latitudinal gradients in SST and SSS along the Gulf Stream current increased markedly during the interval. This may have been a response to gradual changes in the latitudinal distribution of solar radiation and/or a gradual reduction in the strength of the large-scale overturning
thermohaline circulation.
2. Core Locations and Methodology
Cores used for this paper are located along a SW-NE transect in the North Atlantic Ocean (Table 1 and Figure 1) and generally follow the present-day path of the Gulf Stream-North Atlantic Drift from subtropical latitudes (3 IøN) to polar latitudes (72øN). The exception is core CH69-K9 at 41øN, located in the area alternatively bathed by the Gulf Stream and the Labrador Current [Worthington, 1962] but outside the region influenced by cold- and warm-core rings [Nof, 1986; Saunders, 1971; Tchernia, 1969].
Because Cibicides wuellerstorfi was not present in all samples,
the
chronology
is based
on 8180
measurements
of three
different
benthie
foraminiferal
species!:
C. wuellerstorfi,
Oridorsalis
tener,
and Uvigerina
peregrina.
Benthie
foraminiferal
õ!80
results have therefore been corrected to account for species- dependent isotopic fractionation (+0.64960 for C. wuellerstorfi [Shackleton and Opdyke, 1973] and +0.37960 for O. tener ß[Streeter et al., 1982]; see Table 1). Planktic species used for
õ!gO
analysis
are
Neogloboquadrina
pachydertna
sinistral
(left-
coiling) in core V27-60, N. pachyderma dextral (right-coiling) inI Supporting data are available electronically at World Data Center-A
for Paleoclimatology, NOAA/NGDC, 325 Broadway, Boulder, Colorado
(e-mail: paleo(•mail.ngdc.noaa. gov; URL: http://www.ngdc.
noaa. gov/paleo).
24 CORTIJO ET AL.: EEMIAN MERIDIONAL TEMPERATURE AND SALINITY CHANGES Table 1. Location of the Cores Used in This Study and the Benthic Foraminiferal Species Analyzed
Core Latitude Longitude Depth, m Reference Benthic Species
V27-60 72ø11 'N 8ø35'E 2525 I Cibicides wuellerstorfi (+0.64) 4
Uvigerina peregrina
JPC8 61 øN 25øW 1917 2 C. wuellerstorfi (+0.64) 4 NA87-25 55ø11'N 14ø44'W 2320 1 C. wuellerstorfi (+0.64) 4
U. peregrina
NEAPISK 52ø46'N 30ø21'N 3275 this study C. wuellerstorfi (+0.64) 4 CH69-K9 41 øN 47øN 4100 this study C. wuellerstorfi (+0.64) 4 SU90-03 40ø30'N 32ø03'W 2475 3 C. wuellerstorfi (+0.64) 4 MD95-2036 33ø41'N 57ø34'W 4461 this study C. wuellerstorfi (+0.64) 4 Oridorsalis tener (+0.37) 5 JPC37 31ø41'N 75ø25'W 2972 this study C. wuellerstorfi (+0.64) 4
References given on the table: 1, Cortijo et al. [1994]; 2, Oppo et al. [1997]; 3, Chapman and Shackleton [1998]; 4,
Shackleton and Opdyke [1973]; and 5,Streeter et al. [1982].
core EW9302-JPC8 [Oppo et al., 1997], Globigerina hulloides in cores SU90-03, NEAPI8K, NA87-25, and CH69-K9, and Globigerinoides ruber (white variety) in cores MD95-2036
[•4dkins et al., 1997] and KNRI40-JPC37. Isotopic measurements for cores V27-60, NA87-25, and CH69-K9 were performed at the
Laboratoire des Sciences du Climat et de l'Environnement, Gif- sur-Yvette, France, using a Finnigan Mat 251 isotope mass spectrometer equipped with a "Kiel device" for automated individual acidification of samples. The mean external
reproducibility of powdered carbonate standards is +0.0696o for
oxygen. Isotopic measurements for cores EW9302-JPC8 (referred to hereafter as JPC8), MD95-2036, and KNRI40-JPC37 (referred to hereafter as JPC37) were performed at Woods Hole Oceanographic Institution, Woods Hole, Massachusetts. Results
for JPC8 and MD95-2036 were obtained using a Finnigan Mat
252 with a Kiel device. The mean external precision for the powdered carbonate standard National Bureau of Standards
(NBS)-19 is +0.0896o. Results for JPC37 were obtained using a
semiautomated VG903 mass spectrometer fitted with a small
volume inlet and a high sensitivity source. The mean external precision for the powdered carbonate standard NBS-19 is better than +0.1096o. Isotopic measurements for cores SU90-03 and NEAPI 8K were performed at the Godwin Laboratory, University of Cambridge, Cambridge, England, United Kingdom. Planktic samples were analyzed using a VG SIRA II mass spectrometer. Benthic foraminiferal results were obtained using a VG PRISM mass spectrometer. Both mass spectrometers are fitted with the VG isocarb common acid bath system. Analytical precision of
laboratory
carbonate
standards
is better
than
+0.0896o
for
All isotopic data are reported versus Pee Dee Belemnite (PDB) standard after calibration with NBS- 19 [Coplen, 1988].
Sea surface temperature (SST) estimates were based on planktic species counts of at least 300 individuals. The modern analog technique was used to estimate paleotemperatures by identifying the five most similar core-top samples in the North Atlantic database. The database contains 615 core-top samples between 5 ø and 80øN (i.e., the northern part of the database used by Pflaumann et al. [1996]). Summer and winter SSTs were
75øN 60øN 45øN 30øN 15øN 45øW 30ow
CORTIJO ET AL.' EEMIAN MERIDIONAL TEMPERATURE AND SALINITY CHANGES 25 15•80 benthic foraminifera 3 3.5 4 4.5 5 5.5 6 450 8OO 2.5 3 3.5 4.5 5 5.5 600 ', .... ', .... ', .... I .... 1'' - • .... ', .... :.' ''', .... ', .... 500 520 540 560 580 ,' 600 620 . •0 660 680 700 2.5 ' 3 . •,Z..<,,•g•' CH69-•9 (41øN) 5 .... ß : .... : .... : .... : .... :'C '' ' : .... •1 .... • .... • .... 1000 1050 11• 1150 1200 125G, 1300 13•0 1400 1450 5e plateau
..,./C
..4'***•***--.1 V27-60
(72øN)
500 , 550 600 '. 650 700',
'",. JPC8
(61øN)
1 2.5
A'•,--'---.--.
-."'".•<,<,'";,%..,...
I 3
,•--r '-- , .,.-,.•,. + 3.5* ***¾...t*
4.5
:
,,'
....,%.%.+
5
: .... : .... : .... '1 .... : .... : ... : .... I .... I .... •5.5850 900 i950 1000 1050,
- ' 1100 1150 1200 1250
%*'*
*"•"•'"½*
½½*"';'*•*'***'*•**'**
***'*••l•,
NA87-25
(54øN)
',,
-...;:,
g,.-._..,.
.... : .... , .... : ' ' "- ' : ' ' ' ' I 650 700 ß 750 '. 800 850 ß ',, 2 ' 2.5 3 3.5 4 4.5 ,5 1500 2.5ß o•¾'
',*
3.5
SU90-03
(40øN)•'',...
',
',
I,,**•. 4
-%• ,, ; •_. 5 : .... : .... I .... I .... I .... : .... : : ß ß ' : ß ß ß , 5.52 5
350 370 390 410 430 •50 470', 490 510
.
3
•
M
D95-2036
(33
ø
N
) +
'•' '•••q••'&
',
• •
3.5 , . + ..*, . . •,:,•,•,,•,.-•;•. "-•3•4'5•
'• +
-'
,'
• •t*•t• .
5 +
,'
,'
SO
5.5 • .... : .... : .... : ' ß ;-": .... : ß ' ',-': .... : .... : .... : 4220 4•0 4260 4280.-' 4300 4320 .' 4340 4360 4380 .•"'v5
ß
..../..../
*
JPC37
(3
IøN)
3.5
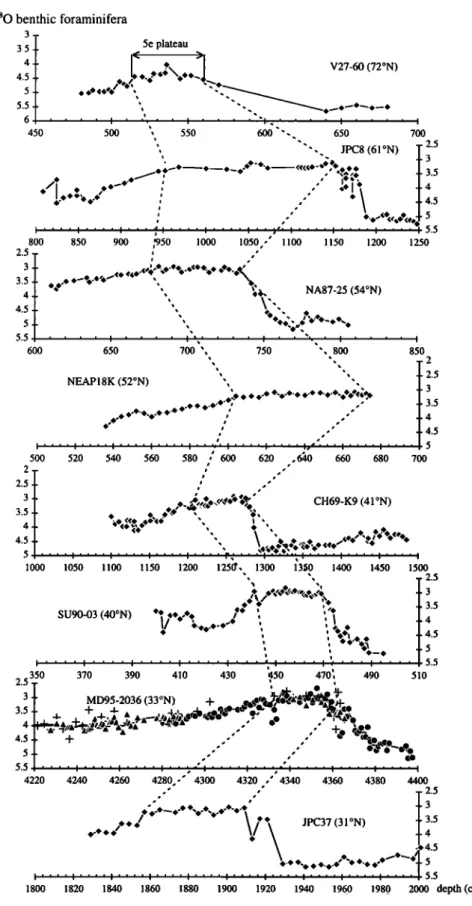
. . • .... '. .... , , , , .• .... • .... ' .... •5.5 1800 1820 1• 1860 1880 19• 1920 1940 1960 1980 2000 depth (cm)Figure 2. Benthie foraminiferal $•80 records in all cores showing the 5c plateau versus depth in each core. In core MD95-2036,
benthie
foraminiferal
$•aO
data
are
from
three
sources:
VG Cibicides
wuesllerstorfi
(triangles),
Finnigan
C. wuesllerstorfi
(plus
signs) and Oridorsalb tenet (circles). A line is drawn through the data as a three-point running average in core MlY)5-2036 tosmooth the signal. The C. wuellemtorfi and O. tenet $•0 values are corrected by +0.6496o [Shackleton and Opdyke, 1973] and by
26 CORTIJO ET AL.: EEMIAN MERIDIONAL TEMPERATURE AND SALINITY CHANGES estimated by averaging summer and winter SSTs associated with
the most similar core tops [Prell, 1985]. Similarity between sample and core-top assemblages was calculated for all 32 planktic taxa using the squared chord dissimilarity measure. Uncertainty in the SST reconstructions corresponds to the root mean square error of the top five analog temperatures. In each case all of the five most similar core-top samples were valid modem analogs for the studied fossil sample (i.e., having a dissimilarity coefficient <0.2 [Overpeck et al., 1985]). Error bars on temperature reconstructions are between 0.5øC and 2øC for all cores except MD95-2036 and JPC37, where standard deviations
are sometimes as great as 3.5øC, probably because of the paucity
of nearby core tops in the reference database. Two of the studied cores (CH69-K9 and MD95-2036) were collected from more than 4000 m water depth and are subject to mild dissolution during glacial periods which might influence associated SST estimates, but there is no evidence of dissolution in interglacial
sediments.
In order to estimate changes in sea surface salinity (SSS) we
use the measured
planktic foraminiferal
•80 and the
reconstructed summer SST to solve the palcotemperature
equation
[Shackleton,
1974]
for the •180 of seawater.
SSS is
reconstructed
from seawater
•aO using
the global
average
•aO/salinity
relationship
for modem
surface
water
of 0.5/1
[Craig and Gordon, 1965]. As salinity-related changes in
seawater
•laO during
the transition
into and out off marine
isotope substage 5e are very difficult to quantify because of changes in ice volume, we restrict our calculation of SSS to the interval of minimum ice volume within the substage.The approach described above assumes that planktic foraminifera have produced shell calcite in isotopic equilibrium with seawater, as determined by growth temperature. The relation between the growth temperature and summer SST has been calibrated for N. pachyderma (left-coiling) and G. bulloides species [Duplessy et al., 1991] in the North Atlantic and for G. ruber (white variety) in the eastern tropical Atlantic [Wang et al., 1995]. However, we also use N. pachyderma (right-coiling) in core JPC8, a species for which the growth temperature has not been calibrated, and G. ruber in two cores coming from the western Atlantic (JPC37 and MD95-2036) where oceanographic characteristics differ substantially from those in the eastern Atlantic (in the Sargasso Sea, Deuser [1987] has shown that G. ruber white was close to the equilibrium, within 0.296o). The accuracy of the salinity reconstructions is highly dependent on the temperature estimates: an average error of 2øC in SST will be
translated into an error of 1 in SSS. For these reasons and
because
the
151aO/salinity
relationship
of seawater
during
the
last
interglaciation may have differed from the modem one and not/5"0 benthic foraminifera (%0) 3 • I /5"0 benthic foraminifera (%0) I, ! . 2.5 ,I I ! ' .... •:•'•'•i•:•::*•i•::•: ß
....
.:-.:,
...
... ;½::.::• ...:½•5•:•::•.?'
.
...
f•[•:;•:•
V27-60
3.5
q•
•'• •
.•
•
....
;•..:::.-..•.:::.::::½:.>;
....
' ...
•..
***•
4.5
5.5 46
.
i?...•?,•...?•:•
..•½•i[
i !:
JPC8 d*'-: ß ! I ... 5.5 54øN, 15øW2
4.552øN,
30øW
SU90-03 * 4 40øN, 32øW •, I',:' 2 ß CH69-K9 41 øN, 47øW 3.5 '. 4.5 ... 5.5 MD95-2036 33øN, 57øW 4 2.5 5 ... . 3.5 JPC37 31 øN, 75øW 4.5 I!
i'
5
•
• I 5.5
110 118 129 135 Estimated age (ka) 110 118 129 135 Estimated age (ka)
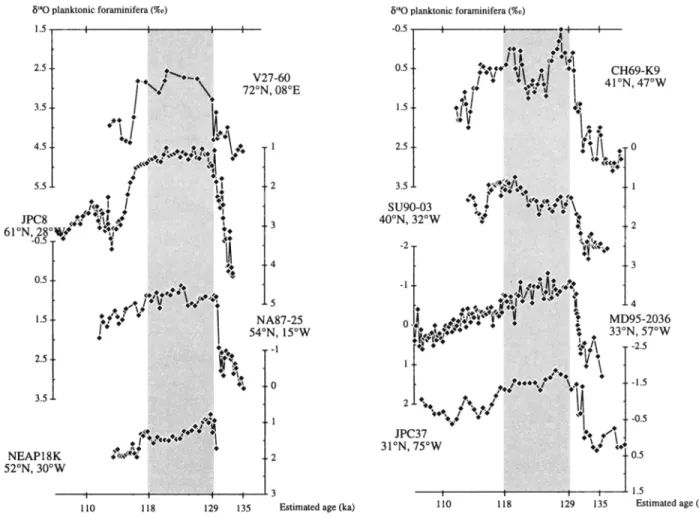
Figure 3a. Benthic foraminiferal l•aO in all the cores studied in this work put on the same age scale using four tie points (caption
CORTIJO ET AL.: EEMIAN MERIDIONAL TEMPERATURE AND SALINITY CHANGES 27
be constant through the North Atlantic Ocean [Rohling and Bigg, 1998] we will not consider absolute salinity values, and we will only discuss relative changes in estimated SSS.
3. Construction of an Age Scale and
Identification of Isotope Substage 5e
The chronology is established using benthie foraminiferal
fi•SO
records.
All studied
cores
except
NEAP18K
show
the
large
decrease in benthie foraminiferal fi•SO associated with the transition between isotope stage 6 and substage 5e. However, the high levels of ice-rafted debris input and the presence of N. pachyderma left-coiling at the base of the NEAP18K (>670cm),signals that also recorded in the 6/5e transition of cores NA87-25 and JPC8, indicate that the bottom of core NEAP18K corresponds to the 6/5e transition. The substage 5e-5d transition is much more difficult to identify with confidence (Figures 2 and 3a). However, in focusing on the interval of minimum ice volume within substage 5e we are able to side step some of the uncertainties in identifying isotopic transitions within the different cores. Whenever possible, we used the following four tie points to constrain the age scale: the isotopic maxima of stage 6, the isotopic maxima of substage 5d, and, when possible, the local isotopic minima at the beginning and end of the interval of sustained low values (events 5.53 and 5.51, respectively, in the
stacked and orbitally tuned timescale of Martinson et aL [1987] (Table 2)). We refer hereat•er to the latter interval as the "5e plateau". In some cases the bouqding isotopic minima were not obvious. In these cases, as, for example, in core CH69-K9, we chose to define the 5e plateau on the basis of the interval of
lowest
average
•O value
ñ0.2%o
(to account
for natural
isotopic
and temperature variability during the interval of minimum ice volume).All the cores studied in this work were placed on a common age scale following the method described above and using the age scale established by •tdkins et al. [1997] as reference (Table 2). Sediment thicknesses for stratigraphic sections corresponding to the 5e plateau (Table 2) range from 25 (core SU90-03) to 192 cm (core JPC8). These thicknesses equate to a range in average
sedimentation
rate
of 2.5 to 19.2
cm kyr
q with
the
.ddkins
et al.
[1997]
timescale
(or from
9.6 to 73 cm kyr
'• if we use
the
definition of the 5e plateau by Martinson et al. [1987]). Although the temporal resolution of sampling for core V27-60 is not as great as in the other cores, we include it here to provide needed constraint on possible changes in SST and SSS at polar latitudes. Unfortunately, there are as yet no better records available from this part of the Norwegian Sea with SST reconstructions.The precise duration of the Eemian period is not fully resolved [see, e.g., .ddkins et al., 1997; Kukla et al., 1997; Martinson et al., 1987]. However, neither the duration nor the precise timing
planktonic foraminifera (%•) ..*!•iii•!i• '?•i:•:-•':"•:•11:i V27-60
...
:•:.•::::• $.:: ... :•:• .•. •; :• • s •, •4':' -':' ... :":1.5
•, .
•:• ...
•
...
•
...
I
NA87-25
% o 3.5 NEAP 18K 52øN, 30øW -I I 3110 118 129 135 Estimated age (ka)
planktonic foraminifera (%,0 -0.5 t t ... •..:4---I-- :.-:.::•;•:•;:-:::;:.:.-'-•i •i::::!•::•.,'.•::;•!•i..-'..-::!::::i•ii• • . ... ::t;:;::t':.:l ::ii•!1%:•:;::•!i:,',::•'•',',i::•:::.:.-[:.•l
SU90-03
.
:•::•::•:•::•:•LL•;;
•,.:;:'•..•-;.:•--,•:.
•
• ... . ... • i _110 118 129 135 Estimated age (ka)
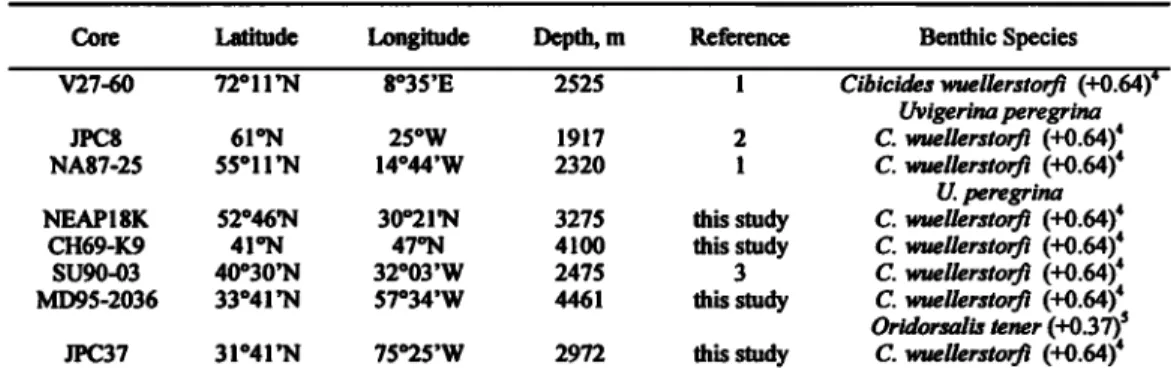
28 CORTIJO ET AL.' EEMIAN MERIDIONAL TEMPERATURE AND SALINITY CHANGES August SST (øC) 12 I I I 10 4 JPC8 61 øN, 28øW 16 14 <5. 12 l0 8 V27-60 72øN, 08øE NEAP18K 52øN, 30øW 12 4 NA87-25 54øN. 15øW 18 16 .14 12 0 t t I. t 16 t [
110 118 129 135 Estimated age (ka) 110 118 129 135 Estimated age (ka) Figure 3e. Summer sea surface temperature (SST) reconstructions using the modem analog method (the arrow indicates modem summer SST [from Levitus, 1982] at the site of each core).
of the beginning and end of the 5e plateau significantly affect our arguments regarding climatic forcing.
4. Results
• The 5e plateau, or ice volume minimum interval, is defined by
a succession of minimum benthie foraminiferal 8•80 values with little or no trend within marine isotope substage 5e (Figure 3a). The exceptions are cores CH69-K9 and MD95-2036 where values increase by 0.296o-0.396o during the same interval. Derailed benthie Cd/Ca results from core MD95-2036, which lies in the present-day mixing zone between lower North Atlantic Deep Water (NADW) and deep waters of southern source, indicate little change in the proportion of these water masses during the
interval
of gradually
increasing
benthie
foraminiferal
8180
at the
two sites [Adkins et al., 1997]. Thus one possible explanation forthe
changing
benthie
foraminiferal
81aO
values
is the
cooling
of
high-latitude surface waters involved in the formation of lower NADW during the interval of minimum ice volume, as seen inthe
planktic
foraminiferal
81aO
and
SST
records
of Norwegian
Sea core V27-60.
The
planktic
foraminiferal
81aO
records
in the different
cores
display a variation of 4-0.596o during the 5e plateau, most likely because of changes in SST and SSS (Figure 3b). However, the G.bulloides •SO record in cores CH69-K9 and SU90-03 show a
peculiar
positive
event,
with
foraminiferal
8•80
values
increasing
by 1%o, in the middle of isotopic substage 5e. The event is associated with a decrease in both estimated SSS and SST, suggesting that both changes may have resulted from the advance of the relatively cold freshwater of the Labrador Current over thesite.
Reconstructed summer SSTs follow different trends, depending on the latitude of the core location (Figure 3c). Northern cores V27-60, JPC8, and NA87-25 show a decrease,
primarily within the second half of the 5e plateau, during which
summer SST values decline by 2øC-4øC. The southern cores
CH69-K9, MD95-2036, and JPC37 generally show an opposite trend during the same interval, with summer SST values rising
(within the error bar) by 0.5øC-4øC. However, in the case of core
JPC37 the apparent rise does not exceed the root-mean-square
error of the estimate.
SSS reconstructions for the 5e plateau display trends that are
similar to those already described for summer SST (Figure 3d).
The northern cores exhibit a decrease during the second half of
the 5e plateau, while the southern cores exhibit an increase (or a
stability) during the same period. Table 3 summarizes the
calculated slope of the linear regression between the beginning and the end of the 5e plateau as a function of both depth in core
CORTIJO ET AL.: EEMIAN MERIDIONAL TEMPERATURE AND SAL1NITY CHANGES 29
õ'"O sea water (%0) õ'"O sea water (%0)
2 • ;"-'::.. • •':"Z"•'• ' - 1 NEAP 18K :' ... •-.- 41 øN, 47øW •:•::•:•::•:•::•::•::::::::•:::- *-' •:-
38
I
3
37 2 36 1 34 0 : 33 SU90-03 110 118 129 135 40ON, 32owEstimated age (ky)
i salinity 39 38 37 36 35 34 4O 38 36 34 32 • i ... , ... i 110 118 129 135 õ'"0 sea water (%0) 3 ,I , , I ... I. ,,I r<$ß •., •::•:•:•::•::e::•,::;.-•:•:-•...:•:::•::• salinity 0
•5.:
:•%%•::-.;7
.•:•:• 37
MD95-2036 :'"*•-•-•:•2•:•::•'¾:/:• 33øN, 57øW :•:•::::•:•:•g•:::::::::: ... ... ... [ •::-:•-•:'" +T--:--. -::':':... ;,':- 36 , , ::::::::::::::::?:::::::::::::::::::::::::::::.-:-:-:.:: : 34 110 118 129 135 40 39 38 37 35Estimated age (ky)
Estimated age (ky)
Figure
3d.
Seawater
8•"O
(solid
and
shaded
diamonds)
foisthe
whole
interval
and
sea
surface
salinity
(SSS)
reconstructions
(open
diamonds) for the 5e plateau only. Because the seawater80 values have not been corrected by the global ice volume variations, only the 5e plateau is interpretable in terms of trends of salinity (solid diamonds). Modem SSS values [frornI•vitus, 1982] are indicated by an arrow, but because of the uncertainties in calculating palco SSS, these values are not really comparable.
5. Discussion
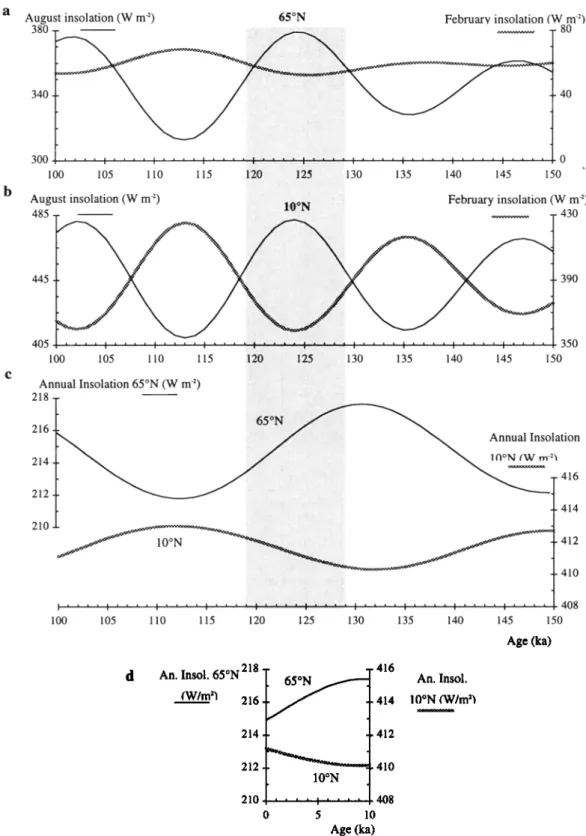
Summer insolation decreased at all northern latitudes by -•30
W m
4 (Figure
4a) during
the second
part
of the interval
of
minimum ice volume and lead eventually to renewed growth of terrestrial ice sheets [Imbrie et al., 1984; Paillard, 1998].However, the latitudinal distribution of these changes was strongly asymmetric and may have contributed to the latitudinal patterns of SST and SSS change documented for the 5e plateau and then ultimately led to the entrance in the glacial period
[Berger et al., 1992]. For example, Figure 4c shows that annually
averaged
insolation
decreased
by-•4.5 W m
4 at 65øN and
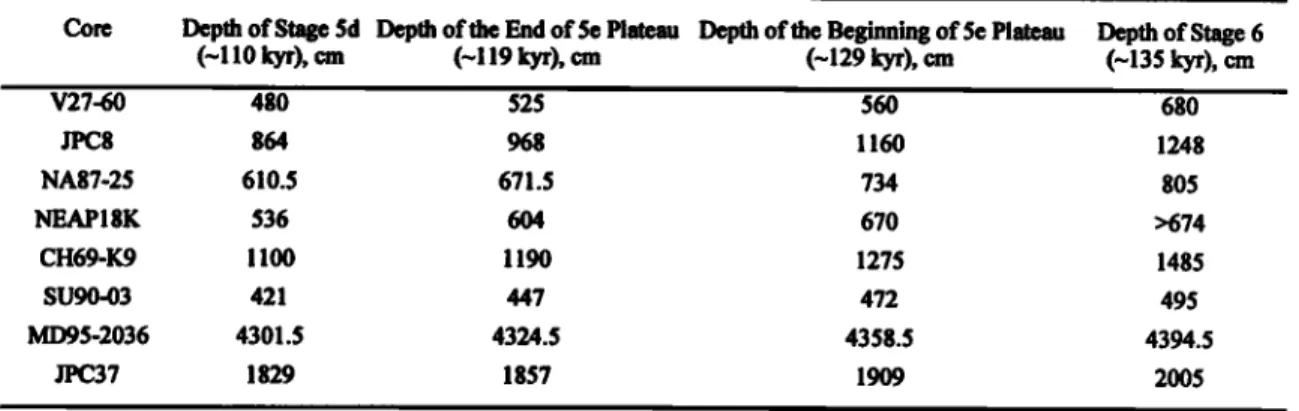
Table 2. Depth and Age of the Tie Points Used in the Different CoresCore Depth of Stage 5d Depth of the End of 5e Plateau Depth of the Beginning of 5e Plateau (--110 kyr), cm (--119 kY0, cm (-129 kY0, cm
V27-60 480 525 560 JPC8 864 968 1160 NA87-25 610.5 671.5 734 NEAPI 8K 536 604 670 CH69-K9 1100 1190 1275 SU90-03 421 447 472 MD95-2036 4301.5 4324.5 4358.5 JPC37 1829 1857 1909 , Depth of Stage 6 (-135 kY0, cm 680 1248 805 >674 1485 495 4394.5 2005
30 CORTIJO ET AL.: EEMIAN MERIDIONAL TEMPERATURE AND SALINITY CHANGES
Table
3. Estimation
of the
Slope
Variation
in the
Summer
Sea
Surface
Temperatures
and
Seawater
8•So
During
the
5e Plateau
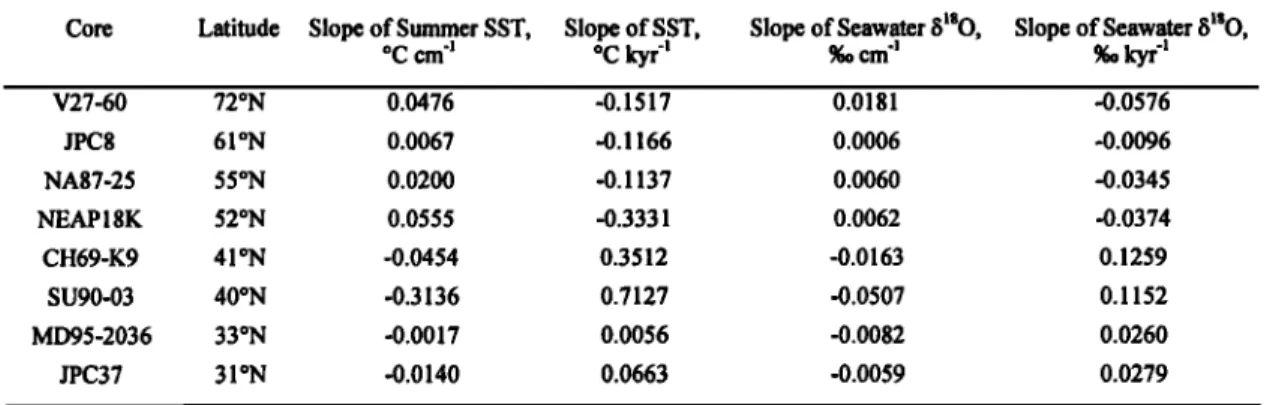
Core Latitude Slope of Summer SST, Slope of SST, Slope of Seawater $•80, Slope of Seawater øC cm '1 øC kyr '• 960 cm '! 960 kyr '! V27-60 72øN 0.0476 -0.1517 0.0181 -0.0576 JPC8 61 ON 0.0067 -0.1166 0.0006 -0.0096 NA87-25 55øN 0.0200 -0.1137 0.0060 -0.0345 NEAPI8K 52øN 0.0555 -0.3331 0.0062 -0.0374 CH69-K9 41øN -0.0454 0.3512 -0.0163 0.1259 SU90-03 40øN -0.3136 0.7127 -0.0507 0.1152 MD95-2036 33øN -0.0017 0.0056 -0.0082 0.0260 JPC37 31 ON -0.0140 0.0663 -0.0059 0.0279
The values are calculated between the beginning and the end of the 5e plateau, versus the depth in core JPC8 and versus time. A positive
slope
value
versus
depth
indicates
a decreasing
trend
in temperature
or seawater$•aO
record
and
corresponds
to a negative
slope
versus
time,
while
a negative
slope
versus
depth
indicates
an increasing
trend
in temperature
or seawatefiS•aO
record
and
corresponds
to a positive
slope versus time.increased
by -2 W m
'2 at 10øN
during
the
interval
of minimum
ice volume. Although the annually averaged changes are small,they may produce significant heating or cooling at the sea surface
because the upper ocean integrates direct insolation forcing over several years. The SST response at high latitude may be
amplified further by changes in the seasonal extent of sea ice and
associated albedo feedbacks. For example, summer insolation
receipts reached maximum values in the middle of the interval of
minimum ice volume but then declined rapidly. If sea ice cover
became more extensive in summer as a result of the decline in
summer radiation, less energy would be available for surface
heating. This, together with the larger change in annually
averaged insolation at 65øN, may explain why the decrease in
SST at high latitudes was considerably greater than the associated
increase at low latitudes (Table 3). Because of the strong
dependence
of evaporation
rate
on temperature
(~5%
øC'•),
the
same mechanism may also explain the associated (positivelycorrelated) changes in estimated SSS. The cores we studied are located along the Gulf Stream system, which is the major energy supplier to the northern latitudes. Changes in the location of the
core will result in a less clear signal, like in core MD95-2036, which is just on the boundary of the main current.
The same forcings and feedbacks may have also operated during the Holocene (cf. Figure 4d), though with less amplitude
as the orbital configuration is different and then the insolation
changes are smaller than during the Eemian. For example, an
SST reconstruction for 6 kyr B.P. indicates that the high latitudes in the North Atlantic were slightly warmer than today, while lower latitudes were cooler [Ruddiman and Mix, 1993], although the differences from the present climate are almost always within the error estimates. A similar SST pattern has been produced in simulations using atmospheric general circulation models with ocean heat fluxes fixed at control values and forced by 9 and 6
kyr B.P. insolation (Liao et al. [1994] and Mitchell et al. [1988],
respectively). These patterns may have been reinforced by changes in equatorial upwelling. Other Holocene proxies, like the
gray-scale reflectance from Cariaco basin cores [Hughen et al.,
1996], are also in favor of stronger equatorial upwellings and therefore cooler tropics at the beginning of the Holocene, leading to a progressive warming of the tropics as the winter insolation increased between 10 and 0 kyr B.P. (Figure 4d). Thus both data and models suggest that a slight cooling over the ocean at high latitudes and a slight warming at lower latitudes may have developed during the course of the Holocene. Our data suggest this was also the case for the Eemian but most likely with a larger amplitude because of the larger amplitude of the insolation changes during the last interglaciation.
We also note that the SST and SSS patterns we have reconstructed for the Eemian ice volume minimum period are characteristic of those associated with weakening of the large- scale overturning thermohaline circulation in numerical models. The replacement of newly formed and exported NADW is associated with a divergence of heat at the surface of the low- latitude North Atlantic and a corresponding convergence in high latitudes. If the rates of NADW formation and large-scale overturning are reduced, the ocean heat transport is relaxed, leading to cooling at high latitudes and warming in low latitudes. There are also pronounced feedbacks in the hydrologic cycle and in surface salinity. The dominant feedback is one of freshening at high latitudes and salt build up at low latitudes, due simply to the increasing residence time of surface waters in latitudes of net precipitation (>40øN) and evaporation (<40øN) [Bryan, 1986]. A long-term weakening of the overturning circulation may have been set in motion by insolation-induced freshening at high latitudes, as discussed above. This thermohaline feedback would
serve to reinforce the documented latitudinal trends in SST and
SSS. However, it must be pointed out that available proxy records of NADW show no clear evidence for a gradual decrease in strength during the interval of minimum ice volume within substage 5e. Low-resolution studies tend to show that the deep water circulation was always active during the isotopic substage 5e, but the resolution of these studies are not precise enough to follow the behavior of the system during the 5e plateau [Duplessy
and Shackleton,
1985].
•There
are still too few high-resolution
CORTIJO ET AL.: EEMIAN MERIDIONAL TEMPERATURE AND SALINITY CHANGES 31 August insolation (W m -2) 380 340 300 .... :.' :.:'-•:-.-'" ... . ...
August
insolation
(W m
485 65øN February insolation (W m -•) 80 40 150..-..i'ii::::i:?!-!::•.:
"10*N
..i:i.i'i:i'i:-:-.:-
February
insolation
(W m
'2)
... 430
. :...:...:.: :.:....:.
445 390
405 ... , ... , ... , , , , 350
100 105 110 115 'I20 •:• i:ii•i:i•iii:•iiii:•11i'i251'::i! !13 i!:• :: ::f: ':. 130 135 140 145 150
Annual
Insolation
65øN
(W m
-2)
•j:•.:•ii!i:!ii?•.•::i.•:ii!:j!i:i?!i.:i•i.•.?!i:??i:•i•!•.•.•:•:ii•i!?!•ii:.:•:•
!
:::!:i; :::!'-'•-"cO '":.' ii:•i:i'ii:•;:5::ii!!ii:3iiii:: •:•: ...
_ _ •.•.. ... ____..: _ ....•.•.:.:...?::.:..:?..?•.:•:..::..:...::-:: .. ?: .... .__ _
o
N
410 ' : .... : .... : .... I .... , 408 100 105 110 115 120 125 130 135 140 145 150 Age (ka)An.
Insol.
65øN
218
65øN416
(W/m•) 216 414 214 412 212 410 210, , ,408 0 5 10 Age (ka) An. Insol. l OøN (W/m:•We have estimated temperatures and salinity for the last interglacial period on a meridional transect of the North Atlantic
Figure
4. February
(February
1-28)
and
August
(August
1-30)
insolation
variations
at
(a)
650N
and
(b)
10*N
between
150
and
100
kyr. Annual (January 1 to December 30) insolation variations between (c) 150 and 100 kyr and (d) 10 and 0 kyr The shaded area give the boundaries of the 5e plateau as defined by the Adkins et al. [1997] age scale.proxy
records
(like
signals
of C. wuellerstorfi
8•So
and
8nC)
to [Adkins
et al., 1997;
Oppo
et al., 1997].
follow in great detail the palcocirculation through the 5e plateau.
The gradual
insolation-induced
changes
in the SST and SSS 6. Conclusion
fields may have lead ultimately to a dramatic and suddenweakening of the overturning circulation, such as has been documented at the end of the 5e plateau in several recent studies
32
from 31 ø to 72øN. During the minimal ice volume time interval the northern temperatures and salinities show a decreasing trend, while the southern ones increase. These changes are mainly gradual but appear to be rather rapid in the middle of substage 5e, at least in some locations. Such changes in sea surface hydrology are somewhat similar to the changes already observed during the Holocene. They may be linked to changes in insolation and in atmospheric circulation. They are also consistent with a reduction of the North Atlantic thermohaline circulation, though more high-resolution deep water records would be required to reach such a conclusion. More ocean-atmosphere coupled model experiments would be necessary to evaluate the real impact of the annual insolation changes on the glaciation incept.
Acknowledgments. We thank D. Oppo for providing us the isotopic and faunal data of core JPC8 and J. Adkins for providing us the age scale
CORTIJO ET AL.: EEMIAN MERIDIONAL TEMPERATURE AND SALINITY CHANGES
of core MD95-2036. We also thank V. Masson and G. Schmidt for useful
discussions. Thanks are due to D. Dole, B. Le Coat, and J. Tessier who
ran the mass spectrometer at LSCE, and to H. Leclaire who carried out
the faunal work on core CH69-K9. LSCE isotopic analyses were
supported by EUDG XII contract ENV4-CT95-0131, by the Centre
National de la Recherche Scientifique-Institut des Sciences de I'Univers
via the National Program for Climate Dynamics and by the Commissariat
• I'Energie Atomique. E. Franks and E. Roosen are thanked for technical
support at WHOI. EC thanks NOAA and her coworkers in the NOAA
Paleoclimatology Program for the enriching year she spent in Boulder,
Colorado, and the French Minist•re des Affaires Etrangb, res (bourse
Lavoisier) and the Soci•t• de Seeours des Amis des Sciences for their
financial support. MRC was supported by NEAPACC grants
GST/02/0724 and GST/02/1177 from the Natural Environment Research Council. We also thank three anonymous reviewers for their appreciated
comments. This is LSCE contribution 137.
References
Adkins, J.F., E.A. Boyle, L. Keigwin, and E. Cortijo, Variability of the North Atlantic thermohaline circulation during the last
interglacial period, Nature, 390, 154-156, 1997.
Berger, A., T. Fichefet, H. Gallic, C. Tricot, and J.
P. van Ypersele, Entering the glaciation with a
2-D coupled climate model, Quat. ScL Rev., 11,
481-493, 1992.
Bryan, F., High-latitude salinity effects and interhemispheric thermohaline circulations, Nature, 323, 301-304, 1986.
Chapman, M.R., and N.J. Shackleton, Millenial-
scale fluctuations in North Atlantic heat flux
during the last 150 000 years,Earth Planet. Sci.
Lett., 159, 57-70, 1998.
Climate: Long-Range Investigation, Mapping, and
Prediction (CLIMAP) Project Members, The
last interglacial ocean, Quat. Res., 21, 123-224,
1984.
Coplen, T.B., Normalization of oxygen and
hydrogen isotope data, Chem. Geol., 72, 293-
297, 1988.
Cortijo, E., J.C. Duplessy, L. Labeyrie, H. Leclaire,
J. Duprat, and T.C.E. van Weering, Eemian cooling in the Norwegian Sea and North
Atlantic Ocean preceding tontinehill ice-sheet
growth, Nature, 372, 446-449, 1994.
Craig, H., and L.I. Gordon, Deuterium and oxygen
18 variations in the ocean and the marine
atmosphere, in Stable Isotopes in
Oceanographic Studies and Paleotetnperatures,
edited by E. Tongiorgi, pp. 9-122, Lab. di Geol.
Nucl., Cons. Naz. delle Ric., Spoleto, Italy,
1965.
Dansgaard, W., S.J. Johnsen, H.B. Clausen, D.
Dahl-Jensen, N.S. Gundestrup, C.U. Hammer,
C.S. Hvidberg, J.P. Steffensen, A.E.
Sveinbj6rnsdottir, J. Jouzel, and G. Bond,
Evidence for general instability of past climate
from a 250-kyr ice-core record, Nature, 364,
218-220, 1993.
Deuser, W.G., Seasonal variations in isotopic
composition and deep-water fluxes of the tests
of perennially abundant planktonic foraminifera
of the Sargasso Sea: Results from sediment-trap
collections and their paleoceanographic
significance, J. Foraminiferal Res., 17, 14-27,
1987.
Duplessy, J.-C., L. Labeyrie, A. Juillet-Leclerc, F. year chrono-stratigraphy, Quat. Res., 27, 1-29, Maitre, J. Duprat, and M. Sarnthein, Surface 1987.
salinity reconstruction of the North Atlantic Mitchell, J.F.B., N.S. Grahame, and K.J. Needham, Ocean during the last glacial maximum, Climate simulations for 9000 years before
OceanoL •4cta, 14, 311-324, 1991.
Field, M.H., B. Huntley, and H. Mailer, Eemian
climate fluctuations observed in a European
_•llen record,_ Na. mre• 371, 779-783, 1994.
Fronval, T., and E. Jansen, Rapid changes in ocean
circulation and heat flux in the Nordic seas
during the last interglacial period,Nature, 383,
806-810, 1996.
Fuchs, A., and M.C. Leuenberger, $•gO of
atmospheric oxygen measured on the GRIP ice
core document stratigraphic disturbances in the
lowest 10% of the core, Geophys. Res. Lett., 23,
1049-1052, 1996.
Hughen, K.A., J.T. Overpeck, L.C. Peterson, and S.
Trumbore, Rapid climate changes in the tropical
Atlantic region during the last deglaciation, Nature, 380, 51-54, 1996.
Imbrie, J., J.D. Hays, D.G. Martinson, A. Mcintyre,
present: seasonal variations and effect of the
Laurentide ice sheet, J. Geophys. Res., 93,
8283-8303, 1988.
Nof, D., The collision between the Gulf Stream and
warm-core rings, Deep Sea Res., 33, 359-378,
1986.
Oppo, D.W., M. Horowitz, and S.J. Lehman,
Marine core evidence for reduced deep water
production during Termination II followed by a
relatively stable substage 5e (Eemian),
Paleoceanography, 12, 51-63, 1997.
Overpeck, J.T., T. Webb III, and I.C. Prentice,
Quantitative interpretation of fossil pollen
spectra: Dissimilarity coefficients and the
method of modern analogs, Quat. Res., 23, 87-
108, 1985.
Paillard, D., The timing of Pleistocene glaciations from a simple multiple-state climate model, A.C. Mix, J.J. Morley, N.G. Pisias, W.L. Prell, Nature, 391, 378-381, 1998.
and N.J. Shackleton, The orbital theory of Pfiaumann, U., J. Duprat, C. Pujol, and L. Pleistocene climate: Support from a revised Labeyrie, SIMMAX: A modern analog chronology of the marine b•gO record, in technique to deduce Atlantic sea surface
Milankovitch and Climate, edited by A. Berger temperatures from planktonic foraminifera in
et al., pp. 269-305, D. Reidel, Norwell, Mass., deep-sea sediments, Paleo-ceanography, 11,
1984. 15-35, 1996.
Keigwin, L.D., and G.A. Jones, Western North Prell, W.L., The stability of low-latitude sea-
Atlantic evidence for millenial-scale changes in surface temperatures: an evolution of the ocean circulation and climate,J. Geophys. Rev., CLIMAP reconstruction with emphasis on the 99, 12,397-12,410, 1994. positive SST anomalies, Rep. TR025, U.S. Kukla, G., J.F. McManus, D.D. Rousseau, and I. Dep. of Energy, Washington D.C., 1985.
R0hling E.J., and G.R. Bigg, Palcosalinity and
Chuine,
How
long
and
how
stable
was
the
last b•O,:
interglacial?, Quat. Sci. Rev., 16, 605-612, A critical assessment, J. Geophys. Res.,
1997. 103, 1307-1318, 1998.
Levitus, S., Climatological •4tlas of the World Ruddiman, W.F., and A.C. Mix, The North and Ocean, NOAA Prof. Pap., 13, 173, 1982. Equatorial Atlantic at 9000 and 6000 yr BP, in Liao, X., A. Street-Perrott, and J.F.B. Mitchell, Global Climates Since the Last Glacial
GCM experiments with different cloud Maximum, edited by H.E.J. Wright et al., pp.
parameterization: Comparisons with 94-124, Univ. of Minn. Press, Minneapolis,
palaeoclimatic reconstructions for 6000 years 1993.
B.P., Palcoclimates, 1, 99-123, 1994. Saunders, P.M., Anticyclonic eddies formed from Mangerud, J., E. Sonstegaard, and H.P. Sejrup, shoreward meanders of the Gulf Stream, Deep
Correlation of the Eemian (interglacial) stage Sea Res., 18, 1207-1219, 1971.
and the deep-sea oxygen-isotope stratigraphy, Seidenkrantz, M.-S., P. Kristensen, and K.L.
Nature, 277, 189-192, 1979. Knudsen, Marine evidence for climatic
Duplessy, J.-C., and N.J. Shackleton, Response of Martinson, D.G., N.G. Pisias, J.D. Hays, J. lmbrie, instability during the last interglacial in shelf global deep-water circulation to Earth's climatic T.C. Moore, and N.J. Shackleton, Age dating records from northwest Europe, J. Quat. Sci., change 135,000-107,000 years ago, Nature, and the orbital theory of the ice ages: 10,77-82, 1995.
CORTIJO
ET AL.: EEMIAN
MERIDIONAL
TEMPERATURE
AND SALINITY
CHANGES
33
equilibrium
between
ocean
water
and
benthonic
Tchemia,
P., Cours
d'Ocdanographie
Rdgionale,
E. Cortijo,
L. Labeyrie,
and
D. Paillard,
foraminifera
genus
Uvigerina:
isotopic
changes Serv.
Hydrograph.
de
la
Mar.,
Paris,
1969.
Laboratoire
des
Sciences
du Climat
et de
in the
ocean
during
the
last
glacial,
in
Les Wang,
L., M. Samthein,
J.C. Duplessy,
H. l'Environnernent,
Laboratoire
mixte
CHRS/CEA,
Mdthodes
Quantitatives
d•tude
des
Variations Erlenkeuser,
S. Jung,
and
U. Pflaumann,
Paleo 91198 Gif-sur-Yvette
Cedex, France.
du Climat
au Cours
du Pleistocene,
pp.
203-
sea surface
salinities
in the low-latitude
(Elsa.
Cortijoi•lsce.cnrs-gif.
fr)
209,
Cent.
Nat.
de
la Rech.
Sci.,
Gif-sur-Yvette,
Ariantic:
The
5•SO
record
of Globigerinoides
L. Keigwin,
Woods
Hole •ographic
France,
1974.
tuber
(white),
Paleoceanography,
10,
749-761,
Institution,
Woods
Hole,
MA 02543.
Shackleton,
N.J.,
and N.D. Opdyke,
Oxygen 1995.
S. Lehman,
Institute
of Arctic
and
Alpine
isotope
and palmmagnetic
stratigraphy
of Worthington,
L.V., Evidence
for a two gyre Research,
Campus
Box 450, University
of
equatorial
Pacific
core
V28-238:
Oxygen. circulation
system
in the
North
Atlantic,Deep
Colorado,
Boulder,
CO
80309.
isotope teml•.)erature and ice volume on a 10 • Sea Res., 9, 51-67, 1962.
year and 10 ø year scale, Quat. Res., 3, 39-55,
1973.
Streeter, S.S., P.E. Belanger, T.B. Kellogg, and
J.C. Duplessy, Late Pleistocene
![Figure 3e. Summer sea surface temperature (SST) reconstructions using the modem analog method (the arrow indicates modem summer SST [from Levitus, 1982] at the site of each core)](https://thumb-eu.123doks.com/thumbv2/123doknet/13031528.381896/7.894.112.800.113.626/figure-summer-surface-temperature-reconstructions-analog-indicates-levitus.webp)