ORIGINAL PAPER
Systematic studies on the determination of Hg-labelled
proteins using laser ablation-ICPMS and isotope
dilution analysis
Daniel J. Kutscher&Mattias B. Fricker&
Bodo Hattendorf&Jörg Bettmer&Detlef Günther
Received: 7 April 2011 / Revised: 26 May 2011 / Accepted: 21 June 2011 / Published online: 20 July 2011 # Springer-Verlag 2011
Abstract A method was developed for the precise and accurate determination of ovalbumin labelled with p-hydroxy-mercuribenzoic acid (pHMB) using polyacrylamide gel electrophoresis with ns-laser ablation–inductively coupled plasma mass spectrometry. Following systematic optimisation of the ablation process in terms of detection sensitivity, two different quantification strategies were applied: external calibration using standards of the derivatized protein after 13C+normalization and, as a proof of concept, label-specific isotope dilution analysis (IDA) using pHMB enriched in the isotope199Hg. Due to the inhomogeneous distribution of the protein within the gel bands, it could be demonstrated that the IDA approach was superior in terms of precision and accuracy. Furthermore, it permits a reliable quantification, if more complex separation proto-cols are applied, as typically occurring analyte loss and degradation can be compensated for as soon as complete mixture of spike and sample is achieved. The estimated limit of detection was 160 fmol in the case of ovalbumin. In contrast to earlier studies using metals naturally present in proteins, no loss of mercury was observed during separation under denaturing conditions and other sample
preparation steps. Using label-specific IDA, the measured isotope ratios in the gel corresponded to recoveries between 95% and 103%.
Keywords ICPMS . Laser ablation . Gel electrophoresis . Protein quantification . Isotope dilution analysis . Protein labelling
Introduction
Gel electrophoresis is one of the most applied separation techniques for protein samples in biochemistry and molecular biology. It is widely employed as a first-dimension separation for the investigation of protein expression in biological systems. Besides the classical detection methods such as gel staining with dyes and fluorophores, mass spectrometry (MS)-based methods have gained interest [1], since different ways of labelling (for example metabolic or chemical labelling) were described that allow unambiguous identifi-cation and mostly relative quantifiidentifi-cation of the proteins at the same time [2]. These approaches were usually developed for so-called soft ionisation sources such as electrospray ionisation (ESI)-MS or matrix-assisted laser desorption ionisation (MALDI)-MS.
An appealing alternative for the quantification of proteins is the use of elemental MS, especially inductively coupled plasma (ICP)-MS [3]. In recent years, its potential for protein quantification has attracted a lot of attention [4]. Besides heteroatoms like phosphorous and sulfur, metals were frequently detected and quantified in different types of proteins [5].
Laser ablation (LA) is the method of choice for solid sampling in ICPMS. Since its introduction for the ablation of metal-containing proteins separated in polyacrylamide Published in the special issuePlasma Spectrochemistry with guest
editors Juan Castillo and Martín Resano. D. J. Kutscher (*)
:
J. BettmerDepartment for Physical and Analytical Chemistry, University of Oviedo,
C/ Julián Clavería 8, 33006 Oviedo, Spain
e-mail: [email protected]
M. B. Fricker
:
B. Hattendorf (*):
D. GüntherDepartment of Chemistry and Applied Biosciences, ETH Zurich, Wolfgang-Pauli-Strasse 10,
8093 Zurich, Switzerland e-mail: [email protected] DOI 10.1007/s00216-011-5199-5
gel electrophoresis (PAGE) [6], the combination of PAGE and LA-ICPMS was widely applied for the detection of different elements present in proteins, either heteroelements like phosphorous [7–9] and selenium [10] or metals such as Cu, Zn and Cd [11,12]. However, LA is prone to elemental fractionation and other matrix effects so that accurate quantification still remains difficult. Several approaches for quantification have been published in recent years. Already the first publication on this technique suggested the use of element doped gels as standards for external calibration [6]. Although the authors achieved a good calibration precision of 6% RSD, this calibration approach does not take into account the possibility of inhomogeneous distribution of the protein within the gel, and therefore, may lead to greater uncertainty and inaccuracy of the quantifi-cation. Also, the use of liquid standards has been suggested [8]. This however, besides the aforementioned problems of the heterogeneous distribution, the different characteristics of a nebulised solution and the laser-generated aerosol in an ICP, leads to another significant source of uncertainty. Another approach frequently used for LA is to use the ion signal of a matrix element as internal standard, in the case of PAGE13C+[10]. However, the internal standard and the analyte have to enter the ICP in the same form, which might not always be given in the case of carbon and other analytes (Frick, unpublished results). Therefore, different results using C as internal standard have been observed.
On the other hand, isotope dilution analysis (IDA) was demonstrated to be a useful tool for accurate quantification with LA-ICPMS sampling [13–15], and a strong impact of IDA can be expected in the field of absolute protein quantification [16,17]. Recently, the use of species-specific IDA was described for the quantification of superoxide dismutase (SOD) using non-denaturing GE-LA-ICPMS [18]. As the isotopically enriched spike, in this case SOD enriched in 65Cu and 68Zn, was chemically identical, instrumental drifts, e.g. during the ablation process and the aerosol transport, could be compensated. Furthermore, this type of internal standardisation allowed correcting for any loss during the separation process and especially for inhomogeneous protein distribution within the gel spots or bands. In general, this approach is limited to the analysis of thermodynamically and kinetically stable metalloproteins, so that its application might be restricted to a relatively small number of analytes.
In order to broaden the applicability of ICPMS-based methods in quantitative protein studies, concepts were developed for their sensitive detection after chemical labelling with an ICPMS detectable element [19, 20], Several methods were suggested, either using the labelling of antibodies [21] or the direct labelling of proteins or peptides [22]. In contrast to metals naturally incorporated in a protein, these labels can exhibit a higher stability under
typically applied separation conditions, as for example, denaturing SDS-PAGE. Among these labelling approaches, mercury compounds have been investigated extensively [22–25]. One of the most widely used compounds is p-hydroxymercuribenzoic acid (pHMB). Due to the highly covalent binding of mercury to free sulfhydryl groups in proteins and the relatively small size of the derivatisation agent, complete derivatisation is achieved under mild reaction conditions. Characterisation of the resulting bio-conjugates is possible using molecular MS-techniques such as electrospray- or MALDI-MS.
In this study, a method was developed for the sensitive detection of ovalbumin from PAGE gels after labelling with pHMB. Ovalbumin was chosen as a model protein, as earlier studies already showed that treatment with pHMB resulted in specific and selective derivatisation of the four sulfhydryl groups theoretically available [23]. The LA process was first optimized in order to achieve high sensitivity and spatial resolution of separated compounds. In order to explore the potential of label-specific IDA for accurate quantification, it was compared to external calibration using standard solutions of the labelled protein. Overall, this study represents a proof of concept of the potential of labelling with pHMB and label-specific IDA for quantitative protein analysis.
Experimental
Sample preparation and gel electrophoresis
All solutions were prepared from reagents with the highest purity available. Ovalbumin (SwissProt Nr. P01012, Sigma
Aldrich, Madrid, Spain) was dissolved in 50 mmol L−1
ammonium bicarbonate (Sigma Aldrich). After appropriate dilution, pHMB (dissolved in 0.05 mol L−1NaOH, Suprapur, Merck, Darmstadt, Germany) was added in tenfold molar excess per cysteine either with natural isotopic composition (Sigma Aldrich) or enriched in the isotope 199Hg (synthe-sized as described elsewhere [26]; safety note: pHMB is highly toxic!). Reaction conditions for the derivatisation were 1 h at room temperature. After twofold ultrafiltration using a 10-kDa cut-off membrane (Amicon Ultra, Millipore, Bedford, MA, USA), the purified protein was diluted in 50 mmol L−1 NH4HCO3. Before electrophoresis, aliquots corresponding to the desired protein amount were further diluted if necessary and incubated in sample buffer. For IDA, different mixtures between analyte (ovalbumin derivatized with pHMB in natural isotopic composition) and spike (ovalbumin derivatised with 199Hg-pHMB) were prepared and also incubated in sample buffer. The sample buffer contained 62.5 mmol L−1tris(hydroxymethyl)aminomethane (Tris; Merck), 2% sodium dodecylsulphate (SDS, Sigma
Aldrich), 25% glycerol (Merck) and 0.1% bromophenol blue (Sigma Aldrich) at pH of 6.8. The addition of dithiothreitol (DTT) or other reducing agents was avoided due to possible side reactions with the derivatized protein. Gel electropho-resis was carried out using the PhastGel System (GE Healthcare, Otelfingen, Switzerland). Precast gels on a plastic support were used (dimensions 50×43×0.45 mm, GE Healthcare) with acrylamide concentrations in the separation gel of 12.5% if not otherwise stated. Running buffer for denaturing electrophoresis was provided by buffer strips supplied from the same manufacturer. Electropho-resis was carried out at 15 °C with 250 V applied for 30 min. After electrophoresis, the gels for LA were kept in 30% MeOH (Merck), 10% acetic acid (Carlo Erba Reagents, Rodano, Italy) to precipitate the proteins and thus stop their continuing migration due to diffusion. Before drying for 2 h at 70 °C, the gels were shaken in glycerol for exchange with remaining water to prevent deformation and cracking of the gels during drying [27]. Some gels were also stained using Coomassie blue for visual comparison. Although no protein loss or contami-nation has been observed due to the staining process and because the migration distance was reproducible within <2%, gels for LA were generally not stained. For LA, the gels were cut in the middle and attached to a glass slide using double-sided tape to mount them inside the ablation cell. In order to determine the spatial distribution of mercury within the gel, line scans were acquired following the migration direction of the protein.
Laser ablation ICPMS
An ArF excimer laser operated at a wavelength of 193 nm (GeoLasC, Lambda Physik, Göttingen, Germany), with a computer-controlledxyz-stage was used during this study. Observation of the sample surface was possible through an Olympus BX 51 microscope. Helium was used as carrier gas at a flow rate of 1.0 Lmin−1. Table1shows a summary of the operating conditions.
The ablation cell used in this study was custom made at the mechanical workshop of ETH Zurich. The effective gas volume and gas dynamics in the ablation region are optimized in order to minimize the aerosol distribution across the cell. This reduces the aerosol washout times significantly and thus improves the attainable spatial resolution for scanning mode or depth profile ablation. Additionally, the design of this cell allows to directly insert samples of larger size (maximum dimensions, 230×34× 16 mm (L×W×D)), which are placed on an internal sled that allows a fast change of the respective sampling position without the need to open the cell. A more detailed description can be found elsewhere [28]. The cell outlet was connected to the torch of the ICPMS via a laminar flow
adapter where argon gas was added as make-up gas for stable operation of the ICP.
All measurements were carried out using an Agilent 7500cs ICPMS instrument under dry plasma conditions. A more detailed summary of instrumental parameters can be found in Table 1. The use of a collision or reaction gas in the octopole ion guide was unnecessary as potential spectral interferences are not to be expected in the mass range of mercury from the sample matrix in this study.
The instrument was optimized daily for high sensitivity using a NIST 610 glass standard. Besides sensitivity, also the ratios238U+/232Th+and248ThO+/232Th+were monitored to check for plasma temperature and oxide formation. 238
U+/232Th+was optimized by adjusting the make up gas flow to a value near 1, while 248ThO+/232Th+ under these conditions was typically below 0.3%.
For LA, the following isotopes were measured:13C+ as matrix element and 34S+ as indicator for the buffer front. During method optimisation, only 199, 200, 202Hg+ were monitored, whereas all mercury isotopes were monitored for IDA.
For liquid analysis (characterization of the spike and determination of the initial isotope ratio of isotope diluted samples), the Agilent 7500cs ICPMS was used with a self-aspirating pneumatic nebulizer (PFA 100, ESI Omaha, USA) made from perfluoroalkane (PFA) with a nominal flow rate of 100 μL min−1. An aliquot of the protein solution after labelling with pHMB was digested with nitric acid, and the concentration of mercury was determined using inverse IDA against a standard solution with certified concentration (Merck, Darmstadt, Germany). All isotopes of mercury (196Hg,198Hg,199Hg,200Hg,201Hg,202Hg and 204
Hg) were monitored with a dwell time of 100 ms, and 50 Table 1 Instrumental parameters of the LA-ICPMS system Agilent 7500cs ICPMS
Forward power 1,600 W
Carrier gas (He) 1.0 Lmin−1
Nebulizer gas (Ar) 0.75 Lmin−1
Plasma gas 1.0 Lmin−1
Coolant gas 12.0 Lmin−1
Ion optics setting Maximized intensity for202Hg+
Collision cell Evacuated
Dwell time per isotope 100 ms GeoLas C
Energy density 14.5 J cm−2
Repetition rate 20 Hz (5–20 Hz)a
Spot size 160μm (44–160 μm)a
Scan velocity 50μm s−1(25–100 μm s−1)a aValues in brackets refer to the range in which the parameters were optimised
repetitions were acquired to improve counting statistics. The initial isotope ratio of the samples was determined after dilution of the protein solution in 2% nitric acid to a final Hg concentration of about 10 ng g−1.
Results and discussion
Optimization of the LA-ICPMS system
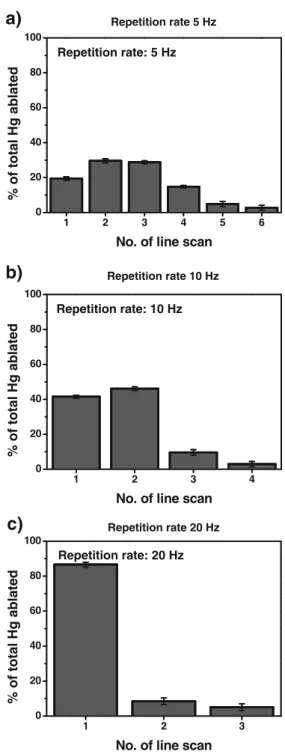
For method optimisation, a gel containing approximately 40 pmol of ovalbumin, labelled with pHMB containing Hg with natural isotope composition (corresponding to 32 ng of Hg), in each of the total eight lanes of the gel was used. The obtained sensitivity in LA-ICPMS is dependent on the amount of ablated material containing the analyte of interest. Therefore, the most influential parameters such as laser repetition rate, spot size and scan velocity were carefully optimised. This optimisation aimed to find conditions that enable a complete in-depth ablation of the entire protein amount present in one line scan with a sufficient spatial resolution to separate proteins and short analysis time. Figure 1 shows the fractions of the Hg ion signals acquired in a sequence of line scans across the protein band in the same lane using different laser repetition rates with identical scan speed. A higher repetition rate corresponds to a proportionally greater number of laser pulses on the gel surface, thus creating deeper ablation lanes. After each line scan, the surface of the ablation crater was refocused, and another line scan was acquired. This procedure was repeated until no further Hg signal was detectable above the instrumental background. After peak integration and normalization to the sum of all signals, the fraction of the respective ion signal for each line scan was determined. Using a repetition rate of 5 Hz (Fig. 1a), four consecutive line scans were necessary to remove the majority of the Hg-containing protein. With a repetition rate of 10 Hz
(Fig. 1b), the same amount was removed in two line
scans, whereas consistently a repetition rate of 20 Hz
(Fig. 1c) was able to remove the same amount in one
single line scan. For this experiment, also 29Si+ was monitored as an indicator whether the laser beam had removed the entire gel matrix and thus started to ablate on the microscope slide. However, complete ablation of the gel was not observed. The maximum depth penetration necessary for complete removal of the protein from the gel was estimated using light microscopy to be 170 ± 5μm, whereas the gel matrix had a thickness of 450 μm. It is also important to note that the highest concentration of the protein is found close to but not directly at the surface of the gel, which would be removed when using lower frequency or higher scan rates.
The signal intensity obtained is furthermore directly correlated with the spot size of the laser beam. A larger spot size leads to an increase in signal intensity with approxi-mately quadratic dependency, but might compromise lateral resolution attainable. Figure2bshows that the resolution of the protein bands in the transient signals was not improved with a smaller beam diameter, so the largest spot size available on the laser system (160μm) was used through-out this work. The protein amount per band was 15 pmol in
a)
1 2 3 4 5 6 0 20 40 60 80 100 % of total Hg ablatedNo. of line scan Repetition rate: 5 Hz
b)
1 2 3 4 0 20 40 60 80 100 % of total Hg ablatedNo. of line scan Repetition rate: 10 Hz
c)
1 2 3 0 20 40 60 80 100 % of total Hg ablatedNo. of line scan Repetition rate: 20 Hz
Repetition rate 5 Hz
Repetition rate 10 Hz
Repetition rate 20 Hz
Fig. 1 Depth profile of the Hg content in the band using different laser repetition rates (spot size, 160μm; scan rate, 50 μms−1). a Repetition rate 5 Hz. b Repetition rate 10 Hz. c Repetition rate 20 Hz
this case. It needs to be noted, however, that the actual width of the scan was significantly wider than the beam diameter employed. Typical ablation lines showed a lane width of 225±5μm, which is most likely due to additional thermal desorption of material during the ablation event.
Together with the laser repetition rate, the scan velocity determines the number of laser pulses that will hit a certain area of the gel surface. Therefore, it affects sensitivity, but also the time needed to conduct a line scan and may additionally influence the spatial resolution attainable. A scan velocity of 50μm s−1 was finally chosen for further measurements because it represents a reasonable compro-mise between analysis time and sensitivity. Even shorter analysis times or higher sensitivity might be attainable by using lasers with higher repetition rates. Using this velocity, the time necessary for one line scan was around 700 s. Under optimised conditions (20 Hz repetition rate, 160μm
spot size, 50 μm s−1 scan velocity), ablation of the
ovalbumin standard resulted in a mercury (and thus protein) distribution along the migration direction in the gel as shown in Fig.2a. Although only ovalbumin was presumed to be present in the sample, two distinct peaks are clearly
separated and can be observed in both the ICPMS-based data and also the Coomassie blue stained gel. As both peaks were also observed in untreated ovalbumin after electro-phoresis (data not shown), we attribute the second signal to impurities or degradation products present in the ovalbumin standard. Analysis of the protein standard with MALDI-MS indicated the presence of a second protein species with a molecular weight of 40 kDa, which fits well to the molecular weight of the second peak, when considering the respective migration distances. In any case, the migration distance and width of the protein bands showed good agreement between the stained gel and the transient signal obtained by ICPMS. Reproducibility of the migration distance was in all cases better than 2%, also between different gels.
Calibration using external standards
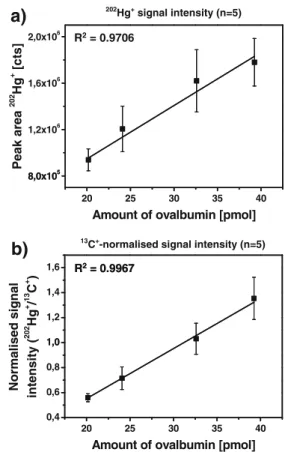
Under optimized ablation conditions, a linear calibration was carried out using external standardization with different amounts of derivatized ovalbumin in order to determine the figures of merit and for comparison with IDA analysis for quantification. For each electrophoresis lane, five individual line scans were acquired. Figure 3 shows the calibration curves obtained using the signal intensity of mercury
Typical electropherogram of pHMB-labelled ovalbumin (denaturing GE-LA-ICPMS)
0 5 10 15 20 25 30 35 40 0 10000 20000 30000 Signal intensity 202 Hg + [cps] Signal intensity 202 Hg + [cps] Migration distance [mm] Line scan: 35.7 mm pHMB-labelled ovabumin Degradation product or impurity 0 Line scan: 35.7 mm pHMB-labelled ovabumin
Enlarged view of the transient signals obtained for variation of the laser spot size, when using 20 Hz
laser repetition rate and 50 µm/s translation speed
15 20 25 0 20000 40000 60000 80000 100000 Migration distance [mm] 44 µm 90 µm 160 µm a) b)
Fig. 2 a Typical electropherogram of pHMB-labelled ovalbumin (denaturing GE-LA-ICPMS). b Enlarged view of the transient signals obtained for variation of the laser spot size, when using 20 Hz laser repetition rate and 50μm/s translation speed
a)
202 Hg+ signal intensity (n=5) 20 25 30 35 40 8,0x10⁵ 1,2x10⁶ 1,6x10⁶ 2,0x10⁶ Peak area 202 Hg + [cts]Amount of ovalbumin [pmol]
R2= 0.9706
8,0x10⁵
b)
13C+-normalised signal intensity (n=5)
20 25 30 35 40 0,4 0,6 0,8 1,0 1,2 1,4 1,6 Normalised signal intensity ( 202 Hg + / 13 C + )
Amount of ovalbumin [pmol]
R2= 0.9967
1,0
R2= 0.9967
Fig. 3 Comparison of external calibration using the (a)202Hg+signal intensity (n=5) and the (b)13C+-normalised signal intensity (n=5)
(Fig. 3a), and the signal intensity normalised to the ion signals of13C+ (Fig.3b). It can be seen that normalization to the matrix element carbon does significantly improve the correlation and precision [10]. As the surface of the gel is not perfectly uniform after drying, slight changes in its height lead to changes of the surface relative to in the focus position of the laser beam. This results in varying ablation rates and thus varying signal intensities. Normalization to13C+ can to some extent compensate for this. Hg and C are both predominantly transported in a gaseous form (presumably as elemental Hg and CO2), which was verified using a gas exchange device [29]. This most likely alleviates the potential problem of different transport efficiencies for particle and vapour, which could otherwise lead to problems in the quantification. However, this must not necessarily be true for other metals attached to proteins.
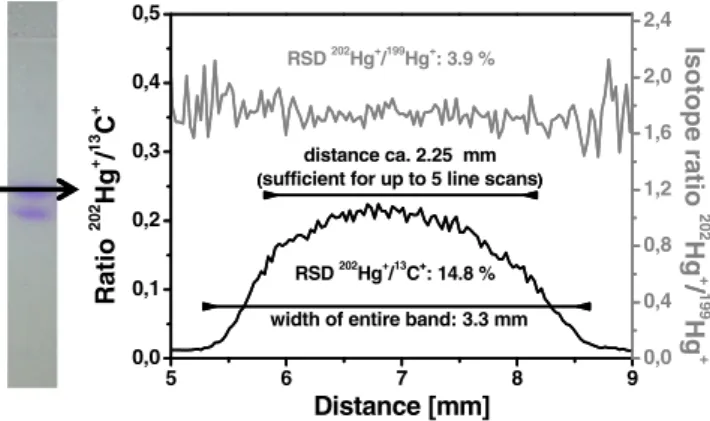
Taking into account the 3σ criterion (standard deviation of the mean signal during ablation of a point where no protein is found), the limit of detection was estimated to be 8 pg of mercury (corresponding to 160 fmol of ovalbumin). The signals for the Hg-isotopes recorded at a protein-free position however did not show significantly higher inten-sities than the gas blank recorded without ablation of the gel. The variability of the intensity ratios from individual line scans in a single lane showed relative standard deviations between 15% and 20%, which would ultimately limit any precise quantification of the labelled proteins. This is mostly a result of the non-uniform distribution of the protein in the gel. A line scan perpendicular to the migration direction (Fig. 4) shows that the protein is enriched in the centre of the lane. From these data, the width of the entire band can be estimated to be 3.3 mm. Furthermore, it was also observed that the signal intensity between two lanes did not completely reach the background level, so that slight diffusion effects cannot be excluded. Taking into account a distance of about 2.25 mm (the width necessary to ablate up to five individual line scans), the standard deviation obtained for the normalised signal
intensities (202Hg+/13C+) is about 15%, corresponding well with the value observed for the individual line scans conducted for the linear calibration. In contrast, the isotope ratio (here the natural isotope ratio for 202Hg/199Hg,Rnat= 1.77) remains constant over the entire width of the protein containing band (see also Fig. 4). The standard deviation was determined to be lower than 4% for the same distance as mentioned above. Obviously, the determination of the isotope ratio can be carried out more precisely for quantification than the determination of the peak area and comparison to external standards. Whereas for the use of external calibration slight deviation from the centre of the gel lane may lead to an erroneous determination of the protein amount, the isotope ratio remained constant (Fig.4). Furthermore, the absolute amount of ablated material is becoming only relevant for the sensitivity but not for quantification anymore. For external calibration, it has to be assured that the same amount of material is ablated for all standards and samples to give similar signal intensities, whereas the isotope ratio measurement is independent of the absolute amount ablated. Also, the distribution of the analyte, e.g. due to diffusion effects, played a critical role for the accurate determination.
Isotope dilution analysis
In order to verify the better precision offered by IDA for the determination of proteins from PAGE gels, ovalbumin derivatised with pHMB with natural isotopic composition was quantified with label-specific IDA after derivatisation with 199Hg-pHMB [26]. As there is a lack of appropriate certified reference materials, the methodology proposed only represents a proof of concept. Mixtures with different quantities (from 3 to 21 pmol) and spike-to-sample ratios between 0.4 and 2.5 were prepared and subjected to gel electrophoresis. Each sample was analysed in duplicate with one empty lane (filled with sample buffer only) in between [18]. Additionally, after digestion in nitric acid and appropriate dilution, the initial Hg isotope ratio in the samples was determined using ICPMS with pneumatic nebulisation. The concentration of the spike was deter-mined by inverse IDA. Mass bias was deterdeter-mined by analyzing a standard with natural isotopic composition of
Hg. For LA-ICP-MS, this was done using nat
pHMB-derivatised ovalbumin. Isotope ratios were corrected using the exponential function (currently more prominent as “exponential law”) [30]. The gels were treated as usual and ablated using optimized conditions as mentioned above. After evaluation of the isotope ratio in the electro-pherograms, the quantity of ovalbumin was calculated. Table2summarises the obtained results. As it can be seen, the determined amounts of ovalbumin correspond very well to the expected values. The analysis was quantitative with
5 6 7 8 9 0,0 0,1 0,2 0,3 0,4 0,5 RSD 202Hg+/13C+: 14.8 % distance ca. 2.25 mm (sufficient for up to 5 line scans)
Distance [mm] Ratio 202 Hg + / 13 C +
width of entire band: 3.3 mm
RSD 202 Hg+ /199 Hg+ : 3.9 % 0,0 0,4 0,8 1,2 1,6 2,0 2,4 Isotope ratio 202 Hg + / 199 Hg + + ( ) /
Fig. 4 Line scan perpendicular to the protein band showing the13C+ -normalised signal intensity and the isotope ratio202Hg+/199Hg+
accuracy between 94.5% and 102.7%, whereas the preci-sion was between 5% and 9%. The isotope ratio was similar for both protein bands observed in the electropherograms, which indicates that the unknown protein was also successfully derivatised by natpHMB and the isotopically enriched reagent. However, the precision obtained here takes into account not only the isotope ratio measurement but also possible errors occurring during sample prepara-tion. Therefore, it is slightly higher than the values obtained for the RSD of the isotope ratio measurements (about 4%). In comparison to external calibration, the use of IDA was not only superior in terms of precision but also less prone to instrumental drifts or matrix effects.
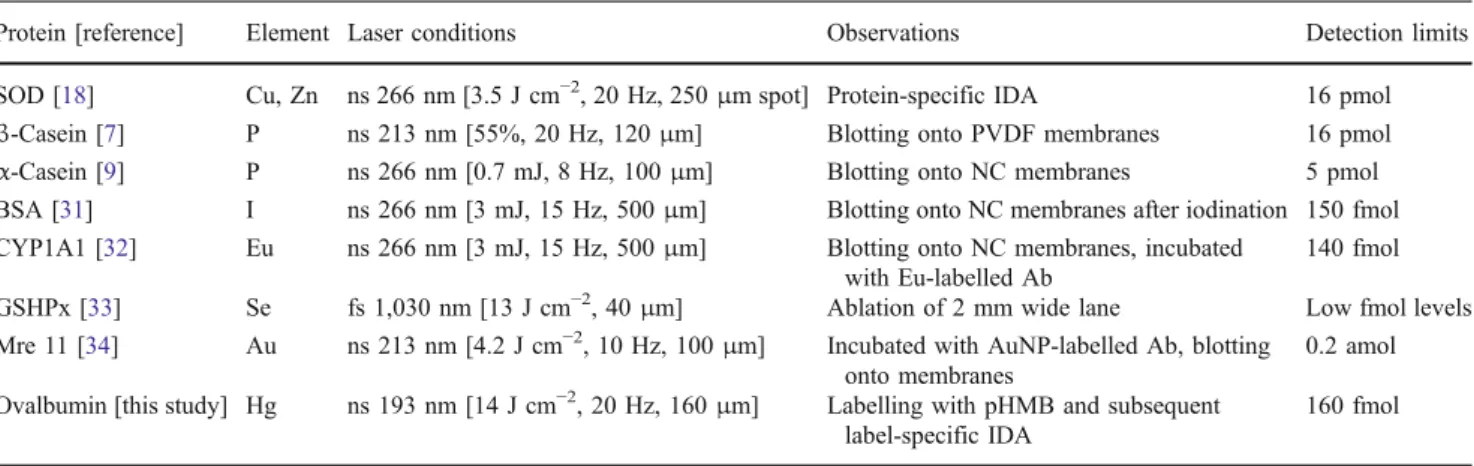
The limit of detection (160 fmol for ovalbumin) was identical to those obtained using the external calibration. In comparison to other GE-LA-ICPMS approaches for the detection of proteins (Table 3), it is obvious that the artificial labelling with metals significantly improves the achievable detection limits [17,19]. Therefore, the proposed methodology (GE-LA-ICPMS in combination with label-specific IDA) can help to combine the principle features for the precise and accurate absolute quantification of proteins.
Conclusion
The combination of gel electrophoresis and LA-ICPMS was demonstrated for the determination of ovalbumin labelled with pHMB. The comparison of two different quantification strategies showed that external calibration required signal normalization to 13C+ in order to improve correlation and precision. Label-specific IDA (using199 Hg-enriched pHMB) on the other hand improves precision and accuracy of the results. It was found that the analytical results were independent from the analyte distribution within the bands. As the quantitative information is encoded in the isotope ratio, which is constant over the entire width of the spot, the effective amount of ablated sample in one line scan does not affect the analytical result. This might be of special importance when spots from two-dimensional gels are investigated. Here, the small size of the spots will impede uniform distribution in any direction; therefore, external calibration might be probably prone to errors. For the analysis of real samples in a proteomic study, more sophisticated separation protocols are mandatory which may require additional sample fractionation, e.g. Table 3 Comparison of laser ablation conditions and detection limits for the determination of proteins using GE-LA-ICPMS
Protein [reference] Element Laser conditions Observations Detection limits
SOD [18] Cu, Zn ns 266 nm [3.5 J cm−2, 20 Hz, 250μm spot] Protein-specific IDA 16 pmol β-Casein [7] P ns 213 nm [55%, 20 Hz, 120μm] Blotting onto PVDF membranes 16 pmol α-Casein [9] P ns 266 nm [0.7 mJ, 8 Hz, 100μm] Blotting onto NC membranes 5 pmol BSA [31] I ns 266 nm [3 mJ, 15 Hz, 500μm] Blotting onto NC membranes after iodination 150 fmol CYP1A1 [32] Eu ns 266 nm [3 mJ, 15 Hz, 500μm] Blotting onto NC membranes, incubated
with Eu-labelled Ab
140 fmol GSHPx [33] Se fs 1,030 nm [13 J cm−2, 40μm] Ablation of 2 mm wide lane Low fmol levels Mre 11 [34] Au ns 213 nm [4.2 J cm−2, 10 Hz, 100μm] Incubated with AuNP-labelled Ab, blotting
onto membranes
0.2 amol Ovalbumin [this study] Hg ns 193 nm [14 J cm−2, 20 Hz, 160μm] Labelling with pHMB and subsequent
label-specific IDA
160 fmol
PVDF polyvinylidene fluoride, NC nitrocellulose, Ab antibody, AuNP gold nanoparticle Sample R (202Hg+/199Hg+) (PN-ICP-MS) R (202 Hg+/199Hg+) after GE (LA-ICP-MS) n expected [pmol] n found [pmol] Recovery [%] 1 0.2858±0.0083 0.2818±0.0088 3.04 3.03±0.17 99.9±5.6 0.2815±0.0166 3.03±0.21 99.8±8.9 2 0.3761±0.010 0.3780±0.0243 3.24 3.32±0.17 102.7±5.2 0.3770±0.0153 3.31±0.22 102.3±6.6 3 0.2819±0.0070 0.2767±0.0097 10.06 9.72±0.66 96.7±6.8 0.2771±0.0018 9.74±0.62 96.9±6.4 4 0.2173±0.0063 0.2165±0.0052 13.02 13.25±1.05 101.8±7.9 0.2154±0.0042 13.17±0.68 101.1±5.2 5 0.5642±0.0186 0.5610±0.0093 21.47 20.65±1.25 96.5±6.1 0.5545±0.0073 20.29±1.19 94.5±5.9
Table 2 Results obtained for the determination of labelled ovalbumin using label-specific isotope dilution analysis
2D gel electrophoresis. Due to the high stability of the labelled protein, the isotope dilution step can already be accomplished in an early point of sample preparation, which can help to improve accuracy of the quantitative data obtainable.
With respect to achievable sensitivity and accuracy in protein determinations, it is possible to conclude that the combination of protein labelling with metal-containing compounds, label-specific IDA and gel electrophoretic separations with subsequent laser-ablation ICPMS might serve as a powerful tool in absolute protein quantification.
Acknowledgements This work was supported by the Spanish MICINN (Spanish Ministry for Science and Innovation, Grant No. CTQ2008-01725). Furthermore, D.J.K. acknowledges a Ph.D. grant from MICINN and J.B. a contract within the Ramón y Cajal program of MICINN. The group of Prof. Dr. D. Hilvert, ETH Zurich, is kindly acknowledged for their support in the gel electrophoretic separations.
References
1. Shevchenko A, Wilm M, Vorm O, Mann M (1996) Anal Chem 68:850–858
2. Bantscheff M, Schirle M, Sweetman G, Rick J, Kuster B (2007) Anal Bioanal Chem 389:1017–1031
3. Baranov VI, Quinn ZA, Bandura DR, Tanner SD (2002) J Anal At Spectrom 17:1148–1152
4. Sanz-Medel A, Montes-Bayon M, de la Campa MDRF, Encinar JR, Bettmer J (2008) Anal Bioanal Chem 390:3–16
5. Prange A, Pröfrock D (2008) J Anal At Spectrom 23:432–459 6. Neilsen JL, Abildtrup A, Chrsitensen J, Watson P, Cox A, McLeod
CW (1998) Spectrochim Acta B 53:339–345
7. Marshall P, Heudi O, Bains S, Freeman HN, Abou-Shakra F, Reardon K (2002) Analyst 127:459–461
8. Becker JS, Boulyga SF, Becker JS, Pickhardt C, Damoc E, Przybylski M (2003) Int J Mass Spectrom 228:985–997 9. Wind M, Feldmann I, Jakubowski N, Lehmann WD (2003)
Electrophoresis 24:1276–1280
10. Chery CC, Günther D, Cornelis R, Vanhaecke F, Moens L (2003) Electrophoresis 24:3305–3313
11. Binet MRB, Ma RL, McLeod CW, Poole RK (2004) Anal Biochem 318:30–38
12. Becker JS, Lobinski R, Becker JS (2009) Metallomics 1:312–316 13. Tibi M, Heumann KG (2003) J Anal At Spectrom 18:1076–1081 14. Heilmann J, Boulyga SF, Heumann KG (2009) J Anal At
Spectrom 24:385–390
15. Fernández B, Claverie F, Pécheyran C, Alexis J, Donard OFX (2008) Anal Chem 80:6981–6994
16. Brun V, Masselon C, Garin J, Dupuis A (2009) J Proteomics 72:740–749
17. Bettmer J (2010) Anal Bioanal Chem 397:3495–3502
18. Deitrich CL, Braukmann S, Raab A, Munro C, Pioselli B, Krupp EM, Thomas-Oates J, Feldmann J (2010) Anal Bioanal Chem 397:3515–3524
19. Tholey A, Schaumlöffel D (2010) Trends Anal Chem 29:399–408 20. Bomke S, Sperling M, Karst U (2010) Anal Bioanal Chem
397:3483–3494
21. Zhang C, Wu FB, Zhang YY, Wang X, Zhang XR (2001) J Anal At Spectrom 16:1393–1396
22. Takatera K, Watanabe T (1992) Anal Sci 8:469–474
23. Kutscher DJ, del Castillo Busto ME, Zinn N, Sanz-Medel A, Bettmer J (2008) J Anal At Spectrom 23:1359–1364
24. Xu M, Yan XW, Xie QQ, Yang LM, Wang QQ (2010) Anal Chem 82:1616–1620
25. Rao YL, Xiang BR, Bramanti E, D’Ulivo, Mester Z (2010) J Agric Food Chem 58:1462–1468
26. Kutscher DJ, Bettmer J (2009) Anal Chem 81:9172–9177 27. Raab A, Pioselli B, Munro C, Thomas-Oates J, Feldmann J (2009)
Electrophoresis 30:303–314
28. Fricker MB, Kutscher D, Aeschlimann B, Frommer J, Dietiker R, Bettmer J, Günther D (2011) Int. J Mass Spectrom. doi:10.1016/j. ijms.2011.01.008
29. Kovacs R, Nishiguchi K, Utani K, Günther D (2010) J Anal At Spectrom 25:142–147
30. Taylor PDP, De Bièvre P, Walder AJ, Entwistle A (1995) J Anal At Spectrom 10:395–398
31. Jakubowski N, Messerschmidt J, Garijo Añorbe M, Waentig L, Hayen H, Roos PH (2008) J Anal At Spectrom 23:1487–1496 32. Roos PH, Venkatachalam A, Manz A, Waentig L, Koehler CU,
Jakubowski N (2008) Anal Bioanal Chem 392:1135–1147 33. Ballihaut G, Claverie F, Pécheyran C, Mounicou S, Grimaud R,
Lobinski R (2007) Anal Chem 79:6874–6880
34. Müller SD, Diaz-Bone RA, Felix J, Goedecke W (2005) J Anal At Spectrom 20:907–911