PAPER IN FOREFRONT
Authenticity and provenance studies of copper-bearing
andesines using Cu isotope ratios and element analysis
by fs-LA-MC-ICPMS and ns-LA-ICPMS
Gisela H. Fontaine&Kathrin Hametner&Adolf Peretti& Detlef Günther
Received: 20 August 2010 / Revised: 17 September 2010 / Accepted: 21 September 2010 / Published online: 22 October 2010 # Springer-Verlag 2010
Abstract Whereas colored andesine/labradorite had been thought unique to the North American continent, red andesine supposedly coming from the Democratic Republic of the Congo (DR Congo), Mongolia, and Tibet has been on the market for the last 10 years. After red Mongolian andesine was proven to be Cu-diffused by heat treatment from colorless andesine starting material, efforts were taken to distinguish minerals sold as Tibetan and Mongolian andesine. Using nanosecond laser ablation–inductively coupled plasma mass spectrometry (ICPMS), the main and trace element composition of andesines from different origins was determined. Mexican, Oregon, and Asian samples were clearly distinguishable by their main element content (CaO, SiO2Na2O, and K2O), whereas the
compo-sition of Mongolian, Tibetan, and DR Congo material was within the same range. Since the Li concentration was shown to be correlated with the Cu concentration, the formerly proposed differentiation by the Ba/Sr vs. Ba/Li ratio does not distinguish between samples from Tibet and Mongolia, but only between red and colorless material. Using femtosecond laser ablation multi-collector ICPMS in high-resolution mode, laboratory diffused samples showed variations up to 3‰ for65
Cu/63Cu within one mineral due to the diffusion process. Ar isotope ratio measurements proved that heat treatment will reduce the amount of
radiogenic 40Ar in the samples significantly. Only low levels of radiogenic Ar were found in samples collected on-site in both mine locations in Tibet. Together with a high intra-sample variability of the Cu isotope ratio, andesine samples labeled as coming from Tibet are most probably Cu-diffused, using initially colorless Mongolian andesines as starting material. Therefore, at the moment, the only reliable source of colored andesine/labradorite remains the state of Oregon.
Keywords Authenticity . Isotope ratios . Laser ablation . Gemstone analysis . Multi-collector ICPMS . Cu
Introduction
Whereas a colorless diamond in itself is very precious, other minerals are not nearly as valuable without their distinguished color. Occasionally, very common rock-forming minerals are considered gemstones provided they are intensively colored, of good quality, and rarely occur-ring in nature. Prime examples are certain kinds of feldspars, namely, labradorite and andesine. The composi-tion of those two minerals lies in between the two most extreme plagioclase feldspar types, the calcium aluminosil-icate anorthite (An, CaAl2Si2O8), containing Ca and Al,
and the sodium aluminosilicate albite (Ab, NaAlSi3O8) with
Na and Al as the cations in their triclinic crystal structure. Defined as 70–50% Ab and 30–50% An, the composition of andesine is Na90–70%Ca10–30%(Al,Si)AlSi2O8.
The discovery of colored labradorite due to native copper incorporations in 1980 in the US state of Oregon was followed by successful mining activities. The schiller effect in some gems lead to its trade name Oregon sunstone labradorite [1]. In 1987, the Oregon sunstone became the G. H. Fontaine
:
K. Hametner:
D. Günther (*)Laboratory of Inorganic Chemistry, ETH Zurich, Wolfgang-Pauli-Str. 10,
8093 Zürich, Switzerland
e-mail: [email protected] A. Peretti
GRS Gemresearch Swisslab AG, Sempacherstr. 1, P.O. Box 3628, 6002 Lucerne, Switzerland e-mail: [email protected] DOI 10.1007/s00216-010-4245-z
official state gemstone of Oregon [2]. Even more valuable in its completely red or green variety, the strict locality in the North American continent was another high-selling argument—until 10 years ago. Whereas the colorless or yellowish schiller variations are also found in Mexico [3], from 2002 on, mainly red feldspars labeled andesines appeared at the Tucson Gem Show. Reputedly, their origin was the Democratic Republic of the Congo (DR Congo). The following years brought more red feldspar material supposedly being mined in Mongolia and Tibet, which was sold extensively by jewel trading TV channels. In 2008, red feldspar was even considered as a candidate for the official gemstone of the 2008 Olympic Games in Beijing [4].
However, from as early on as 2006 and initiated by customer concerns, the International School of Gemology raised doubts about the authenticity of andesines of Asian origin [5]. They identified some of the material as oligoclase rather than andesine/labradorite by inclusions and refractive indices (RI) which did not match that of the biaxial positive labradorite with an RI of 1.57 to 1.58 [1]. In addition, examination in an immersion cell revealed close similarities to diffusion-treated sapphire [6, 7]. Raman spectra on red specimens bought from many sources turned out to be nearly identical to the Mexican labradorite which is colorless to yellow and of which a large quantity (30,000 kg) is said to have been sold to China in the early 2000s [8]. Whereas the first findings were mainly debated on Internet discussion boards, the topic then spread to the scientific community and was taken up by the Gemological Institute of America (GIA) which initiated a special issue on red feldspar in 2009 [4] in collaboration with the Gemmological Associations of All Japan, the Japan Germany Gemmological Laboratory, and the German Gemmological Association.
Material found in cracks and glassy depositions on the surface enriched in potassium and copper [9] as well as color concentrations around surface-reaching channels [10] in Chinese andesines suggested treatment of a colorless starting material by Cu diffusion. Thirangoon [11] has shown that local Cu enrichments by accumulation of native copper platelets in material from Oregon can be evened out by heating (1,200 °C for 50 h). The proven mobility of Cu in feldspar makes it possible to introduce significant amounts externally by embedding the rough, colorless andesine/labradorite in a matrix containing Cu and heating for a certain time. Emmet and Douthit [12] have used refractory ZrO2doped with 1% Cu metal (−300 mesh) and
have shown rapid Cu incorporation by bulk and lattice diffusion as well as pipe or short-circuit diffusion through structural imperfections. The highly temperature-dependent process requires temperatures >1,000 °C to color rough colorless material from China as well as Oregon and Mexico into shades of green and red or dark brown.
Thus, the potential for fraud was proven. In 2008, Abduriyim [13, 14] led an investigation team to mines in Mongolia and Tibet for a visual inspection of the minerals on-site. The organized mining in Inner Mongolia in Guyang County was found to produce a yearly output of up to 100 tons of fine-quality andesine/labradorite of nearly exclusively pale yellow color with some colorless and yellow species. In Tibet, Bainang County, the survey team encountered a small mine in which they were presented orangey red to deep red crystals with an estimated output of 700–800 kg.
The journey confirmed that no red andesine can come from Inner Mongolia. Still, even with the eye proof, there remained doubts about the authenticity of the Tibetan red feldspars. As put by McClure [15], it remains to be found out whether this mine is“real or a very elaborate hoax.” To determine this, an analytical technique or method needs to be applied or developed to either irrevocably distinguish andesine/labradorite from Tibet from known treated materi-als or to provide evidence that it has actually undergone treatment.
To support the aforementioned gemological methods, elemental analysis methods can also serve to elucidate authenticity by determining the main and trace elemental composition or by identifying treatment. For example, energy-diffractive X-ray fluorescence and laser ablation-inductively coupled plasma mass spectrometry (LA-ICPMS) have been effective in revealing coating of tanzanite [16].
Feldspars from Oregon and Mexico (Casas Grandes) can be easily distinguished from Asian material based on the content of the main components calcium as well as potassium [9]. Labradorite from Oregon is the most calcic one, whereas crystals claimed to come from the DR Congo, Tibet, and China (Inner Mongolia) showed the lowest calcium and highest potassium contents. Differentiation using the main elements was not possible between those three latter sources. Concerning the trace elements, Ti and Mg concentrations allow differentiation even between the mine locations Ponderosa and Plush in Oregon and are very different from the pattern of the Mexican feldspars [11]. However, minerals from Inner Mongolia and Tibet again fall into one region and cannot be distinguished, although the mine locations are more than 2,000 km apart. To the best of our knowledge, the only separation between the sources so far has been shown by Abduriyim [13] in a Ba/Sr vs. Ba/Li plot: Variation in the Ba/Li ratio for Tibetan samples ranged from 1 to 9, whereas Inner Mongolian andesine feature ratios >11 within a limited range of Ba/Sr ratios (0.14–0.18). What is important to note, however, is that all Mongolian samples are stated to be pale yellow and therefore have not been subjected to treatment [13].
Testing for treatment was carried out by Rossman [9]. The high K content of Chinese andesine (∼0.5 mass% K2O)
leads to an accumulation of40Ar via the 40K→40Ar decay (t1/2=1.3 × 109 years) in the mineral over time. Thus,
release experiments of natural crystals should show a relatively high ratio of the radiogenic 40Ar to 36Ar. Since Cu diffusion can only be achieved at high temperatures, the diffusion treatment will allow volatile species such as the Ar in the mineral to escape. Consequently, material subjected to heat in recent time will have a lower40Ar/36Ar. When measured, yellow rough from Mongolia released high amounts of radiogenic argon. All colored material from Mongolia as well as Tibet and claimed to come from the DR Congo, however, showed low levels of 40Ar and
40
Ar/36Ar close to the atmospheric value of air, indicating recent exposure to heat. However, no quantitative data are reported in this report [9].
Another test for diffusion treatment might lie in the introduced Cu itself. Since diffusion is a mass-dependent process, treatment should be reflected in the Cu isotope ratio. Stable Cu isotopes have been explored as geochem-ical tracers in various applications, especially to describe hydrothermal processes [17–19]. Femtosecond laser abla-tion multi-collector ICPMS (fs-LA-MC-ICPMS) was used to evaluate this new potential differentiation possibility on a large range of red and greenish red “andesine” crystals claimed to have come from two mines in Tibet as well as Mongolia and obtained from various sources. The femto-second laser was chosen since no internal calibration of the isotope ratios was possible in this case and reduced pulse durations have been shown to minimize matrix dependen-cies and to improve precision in comparison to laser pulses in the nanosecond range [20,21]. Furthermore, the smaller heat-affected zone into the lattice for femtosecond com-pared to nanosecond pulse duration reduces the diffusion of the Cu out of the sample during laser ablation, which otherwise might cause additional fractionation [22].
In addition, an Oregon sunstone and initially colorless feldspars from Oregon, Mexico, and China treated in the laboratory by copper diffusion were available. LA-ICPMS studies were carried out on all samples to provide a library of main and trace element data.
Experimental Samples
If not stated otherwise, all samples investigated within this study were taken from the GemResearch SwissLab refer-ence collection (GRS, Luzern, Switzerland). The total number of tested samples is 100. They can be separated into 12 different groups:
(A) Rough andesine samples obtained from the mine in Tibet explored by Abduriyim [14] and provided to GRS. The mine is situated in Bainang County (29.03984° N, 89.38791° E [14], SW of Lhasa). (B) Approximately 1 kg of rough sample collected by one
of the authors (AP) during an expedition in 2009 to a new mine of copper–andesine in Tibet close to Gyaca (29.13444° N, 92.59916° E, SE of Lhasa) and presented by the same mine owner as (A).
(C) Fifty samples claimed as being natural rough copper– andesine from Tibet (indicated as not diffusion-treated) were supplied by a company from Shenzen (China). Two generations of materials were supplied as “old mine” (2008, group C1) and “new mine” (2009, group C2). The material was indicated to originate from the waste area of the Tibet from different mining spots. Some of the samples have been surface-polished.
(D) Three faceted gem-quality red andesines claimed to come from the DR Congo, acquired at the Tucson Show in 2006. These materials had been described by Krzemnicki [23] as a new source, which has since been reinterpreted as not existing.
(E) Three faceted gem-quality samples claimed to be diffusion-treated copper–andesines from Tibet ac-quired at the Hong Kong Jewellery Show in Septem-ber 2009.
(F) Faceted gem-quality labradorites from Oregon ac-quired from the jewelry show 2008 in Bangkok. (G) Rough samples of Asian origin claimed as
diffusion-treated, obtained from traders in September 2009. (H) One kilogram of untreated rough material of light
yellow andesine declared as originating from Mongo-lia supplied by a company from Shenzen (China). For this study, 11 samples from this batch were selected randomly.
(I) Untreated near-colorless andesine from Mexico sup-plied by a company in Bangkok in 2009. These samples were reported in the trade as being used for Cu diffusion treatment. The claim has not been verified independently.
(J) Four samples of originally near-colorless and exper-imentally diffusion-treated andesine provided by GIA (Thailand) to GRS (Thailand) for research loan. The rough materials used are indicated as originating from Inner Mongolia (ref nos. 17401891 and 17401893), Plush, Oregon (ref no. 668715302), and Mexico (ref no. 668714802).
(K) Six additional samples of category (B) were also experimentally diffusion-treated by Prof. Emmet for GRS in early 2010. One sample of this group had been broken into two parts prior to treatment, after which it showed prominent reaction to red (ref no.
10722). The colorless, untreated half (ref no. 10722-1) was also analyzed.
(L) A Mongolian andesine labeled as diffusion-treated provided by A. Abduriyim from the Gemmological Associations of All Japan. It was cut open and showed a distinct color gradient from a dark red outer rim becoming successively lighter red toward a colorless core.
Fractures of not gem-quality material were not continu-ously colored, but showed different colors and shades from different angles of observation. Rough material was mostly zoned (mainly red and colorless) and featured a dull outer surface, appearing to have been slightly tumbled. Some samples featured concave cavities with glassy remnants. Shape and surface texture of the samples from groups (A), (B), (C), and (H) were identical. Some of the rough was cut by GRS.
The rough, colorless Mongolian samples (H) were used to determine the composition of the untreated mineral for comparison. The four andesines of group (J) had been treated by Cu diffusion at 1,200 °C at Crystal Chemistry by Prof. Emmet (Brush Prairie, WA, USA). However, no untreated reference sample was available from this group. Group (K) was therefore prepared to have untreated and diffusion-treated material from the same rough piece available for comparison. For the treatment process, the rough material was first cut into polished plates. Samples of group (K) were then broken into two pieces and one half not further treated, but kept as reference. After diffusion treatment, only the flat surfaces of the crystals from group (J) were repolished, while the rough rims remained unpolished.
Since some samples have compositions at the crossing point between labradorite and andesine or even oligoclase, we refer to all of them as“andesines” except for the Oregon species to avoid random assignment.
The glass reference material NIST610 is certified for the concentration of a large number of elements. Although not certified for the Cu isotope ratio, the widely applied glass standard served as an external standard to account for temporal drift and to compare relative differences between the samples.
Sample and standard preparation
All mineral samples were cleaned with ethanol (p.a., Fluka, Sigma-Aldrich, Switzerland) prior to ablation. Since the half-treated red (ref no. 10722, group (K)) and the on-site collected samples (A) and (B) had been broken apart for Ar analysis, their interiors could be measured.
Solutions were prepared using ultrapure water (18 MΩ cm, Millipore, Bedford, MA, USA) and HNO3(Fluka, analytical
grade, further purified by sub-boiling distillation). Liquid standards of various Cu/alkali metal ratios were diluted from single element standards of Cu (1,000 mg/l, Merck CERTIPUR, lot no. C804290) and Li, Na and K (1,000 mg/l, Merck CERTIPUR) in 1% HNO3. Sample
introduction was achieved using a membrane desolvation system (DSN-100, Nu Instruments, Wrexham, UK) and an autosampler (ASX-110 FR, CETAC, Omaha, NE, USA) for the comparison of pure Cu solutions and alkali metal matrix samples.
Cu isotope analysis
Pulses of ∼150-fs duration and 2.1-mJ energy at a frequency of 10 Hz were generated using a chirped pulse amplification Ti/sapphire-based laser system operated at a wavelength of 795 nm (Legend, Coherent Inc., Santa Clara, CA, USA). The laser radiation was focused below the surface of the samples which were positioned in a cylindrical ablation cell (V=50 cm3). The ablation spots were 150–200 μm in diameter (kept the same for one measurement session) and were scanned across the surface at a scan rate of 10 μm/s. A helium gas flow (∼1 l/min) transported the aerosol formed upon ablation in Tygon® tubing to the Nu Plasma HR (Nu Instruments, Wrexham, GB) MC-ICPMS. Prior to the plasma, argon (∼1 l/min) was admixed to the carrier gas flow via a laminar flow adapter. The MC-ICPMS was tuned to conditions where highest signal intensity was obtained and run in pseudo-high-resolution mode to avoid the40Ar23Na+interference on Cu on mass-to-charge ratio (m/z) 63. The 63Cu+ signal was measured about∼0.0114 m/z (distance to half height) away from the position where it has reached half of its intensity. This position was determined prior to each laser ablation session with solution nebulization by introducing a Cu solution (25 μg/l) spiked with sodium (5 mg/l) in 1% HNO3using the DSN-100. The resulting magnet position
was checked repeatedly to avoid including the interference due to temporal drifting and adjusted when necessary. The cup configuration for laser ablation MC-ICPMS is given in Table1and the operating conditions in Table 2.
To account for interferences from the different gas sources, the gas blank signals obtained for 30 s prior to ablation were subtracted from the ablation signals obtained in time-resolved analysis (0.2-s integration time per data point). After discarding the first 5 s, the scanning ablation signals for NIST610 and the samples were integrated for 55 s. If not given directly, the isotope ratios of the samples are presented as permil deviation from the average of the bracketing measurements: Deviation [‰] = 1000* ((65Cu/63Cu)sample / (65Cu/63Cu)std-1). Long scans across
the surface of the minerals were integrated in intervals of 60 s to create a space-resolved isotope ratio pattern. Linear
approximation of the bracketing standard measurements was used to calculate the respective value for each integration interval.
Interference studies
The influence of potential interferences coming from hydrides, oxides, argides, and doubly charged species was evaluated following the studies and considerations of Mason et al. [24].
Due to the low Ni and Zn content (see Fig.1), no Zn correction was applied and neither abundance sensitivity nor hydride formation deriving from these two elements was considered problematic. After subtracting the gas blank from the signal intensities, no significant signal intensity was found on the Faraday cups monitoring doubly charged species on m/z 64.5 (129Xe++) and m/z 65.5 (131Xe++), indicating a sufficient correction for interferences from the gas. Due to its high second ionization potential, doubly charged Te is commonly below the instrumental back-ground [24]. With a Ba concentration a factor of five lower than the Cu concentration, the interference of its minor isotope130Ba (natural abundance approx. 0.1%) as a doubly charged species on m/z 65 will be lower than the measurement uncertainty.
Only Ti is present in the sample in sufficient quantities to form an interfering oxide of significant abundance. How-ever, its influence on Cu isotope ratios has been determined to be <2‰ for solution nebulization and <0.5‰ for desolvated aerosols for equal concentrations of analyte and matrix element [24]. Since the Ti concentration between the Tibetan and the Mongolian samples differs <5% (see Fig.1), a potential interference would affect the relative isotope ratios by <0.1‰, which is also below analytical uncertainty.
The 40ArM+/M+ rate of the Nu Plasma HR is approxi-mately 10−5. Therefore, the contribution of 40Ar25Mg+ on m/z 65 was negligible. The major source of interference is the argide-forming main matrix element Na. For a solution of 5 μg/l Cu and 5 mg/l Na, the signal interference by
40
Ar23Na+was between 22% and 26% of the63Cu+signal as determined in pseudo-high-resolution mode, depending on the daily tuning parameters. The contribution by tailing of the 40Ar23Na+ peak was estimated by the slope of the 63Cu+ signal on the low mass side to be 0.6–1.2‰. The remaining contribution of the interference caused by 5 mg/l Na on 5 μg/l Cu in the high-resolution mode was subsequently 0.1–0.3‰ on the selected peak position. This assumption is, however, hampered by the inability of the exponential fitting curve to approach zero values and might therefore overestimate the actual contribution.
To check the feasibility of the high-resolution mode, 50μg/l Cu standards with increasing Na concentration (0.1, 1, and 5 mg/l) were bracketed by a pure 50 μg/l Cu standard (Fig.2). In addition, Cu standards were also doped with two other alkali metals, Li and K, in equivalent concentrations to differentiate between spectral and non-spectral interferences. Before each measurement, the beam position was checked by the software by scanning over the signal and then choosing a position at a fixed distance (∼0.0114 m/z) from the position where the 63
Cu+ signal reaches half its height. In a preliminary run, drifting of the peak position moved the interference toward the chosen magnet setting point and caused deviations of up to 14‰ for a 50 μg/l Cu solution containing 5 mg/l Na. This finding underlines the importance of checking the peak position.
The influence of the alkali metal matrix on the isotope ratio was consistent for the three matrix elements. For low matrix levels (0.1 mg/l), a positive deviation from the pure standard was observed, whereas the highest matrix concen-Table 1 Cup configuration and nominal m/z signals in each Faraday cup
H6 H5 H4 H3 H2 H1 Ax L1 L2 IC0 L3 IC1 L4 IC2 L5
68 67 66 65.5 65 64.5 64 63 62 61
The magnet set point was kept constant in the axial (Ax) cup during time-resolved analysis. Mass separation was set to 0.5 u
Table 2 LA settings and ICPMS operating conditions for isotope ratio determination and elemental analysis
fs-LA-MC-ICPMS ns-LA-ICPMS
fs Laser ArF excimer
Wavelength (nm) 795 193
Pulse duration Δt=150 fs
Repetition rate (Hz) 10 10
Spot size (μm) ∼205 80
Fluence (J/cm2) ∼6.4 ∼18
Beam profile Gaussian Flat
Nu Plasma HR Elan6100 DRC
Rf power (W) 1,300 1,350
Carrier gas flow rate 1 l/min He ∼1 l/min He
Additional gas flow rate 1 l/min Ar 0.84 l/min Ar Auxiliary gas flow rate 0.75 l/min Ar 0.7 l/min Ar Coolant gas flow rate 13 l/min Ar 17.5 l/min Ar
tration caused deviations which showed a significant dependence on element mass. Li gave a slightly positive deviation from the pure standard (0.17±0.15‰), whereas Na and K showed an increasingly negative deviation of −0.44±0.16‰ and −0.93±0.17‰, respectively. The positive deviation at low matrix concentrations is most probably caused by a matrix bias on the isotope ratio (which usually causes a shift to heavier isotope ratios) [25, 26]. The correlation of the more negative deviation with element mass for the highest matrix content might be due to two different reasons. On the one hand, K has the highest molar weight. Since the alkali characteristics are similar, the “zone model” of Vanhaecke et al. [27] predicts that its zone of maximum density is closer to the interface. At this high concentration, the local cooling by the matrix might shift the zone of highest ion concentration for the now trace element Cu away from the torch [28] and closer to the sampler. A more representative sampling might then be
responsible for the relative increase in the lighter Cu isotope.
On the other hand, at the same mass fraction, the molar concentration for Li, Na, and K is reversely proportional to their molar mass. Thus, Li adds the highest ion number to the plasma and the interface, causing the highest matrix effect by an easily ionizable element.
The contribution of each of the sources cannot be separated from each other. However, the matrix effects from all three alkali elements correlate. Thus, the influence of the 40Ar23Na+ interference is considered to be much lower than the matrix bias caused by the high amount of an easily ionizable element. In addition, dissociation of the copper oxides as well as ionization effects might play a role. Whereas different sodium concentrations in liquid samples cause great differences in the total matrix, the complex composition of the mineral samples is much more similar for all measurements. Therefore, only the tailing
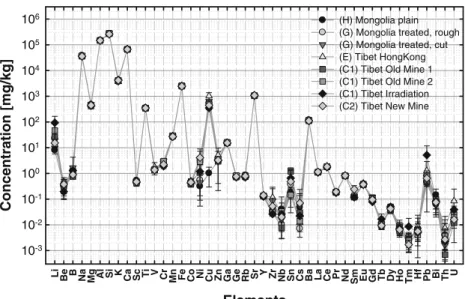
Elements Li Be B Na Mg Al Si K Ca Sc Ti V Cr Mn Fe Co Ni Cu Zn Ga Ge Rb Sr Y Zr Nb Sn Cs Ba La Ce Pr Nd Sm Eu Gd Tb Dy Ho Tm Hf Pb Bi Th U Concentration [mg/kg] 10-3 10-2 10-1 100 101 102 103 104 105 106 (H) Mongolia plain
(G) Mongolia treated, rough (G) Mongolia treated, cut (E) Tibet HongKong (C1) Tibet Old Mine 1 (C1) Tibet Old Mine 2 (C1) Tibet Irradiation (C2) Tibet New Mine Fig. 1 Main and trace element
composition of plain, colorless Mongolian andesine (n=9, group (H)), rough (n=27), and cut (n=9) red Mongolian andesine (group (G)), andesine from the Hong Kong market (n=4, group (E)), and red Tibetan andesine from the“old mine” (batch 1 (n=4) and batch 2 (n=9), group C1), the“new mine” (n=14, group C2), and two irradiation-treated samples (group C1) measured using ns-LA-ICPMS and NIST610 as external standard. Labels of sample origin were provided by the gemstone traders
Alkali Concentration [mg/L] 0 1 2 3 4 5 Deviation of 65Cu/ 63 Cu [‰] -1.5 -1.0 -0.5 0.0 0.5 1.0 1.5 2.0 Sensitivity [V/(mg/L)] 0.0 0.5 1.0 1.5 2.0 Deviation (Na) Deviation (Li) Deviation (K) Sensitivity (Na) Sensitivity (Li) Sensitivity (K) Sensitivity (standard)
Fig. 2 Cu beam intensity (open symbols) and Cu isotope ratio deviation in permil (closed symbols) from pure Cu standard (50μg/l) for the same Cu solutions doped with different Alkali metal matrix concentra-tions (0.1, 1, and 5 mg/l) vs. the matrix concentration. Standard errors are 1 SE
contribution of the sodium argide will be of importance as a potential source of interference. The Na/Cu ratio varies from 24:1 up to 112:1 in all colored Asian samples and from 50:1 to 90:1 for 80% of the samples. The variation of the Na concentration is, however, <20%. The contribution of the interference to the 63Cu signal intensity thus varies from 0.03‰ to 0.35‰ considering the range of tuning-dependent abundance sensitivities.
Due to the lower Cu concentration, the Oregon samples have much higher Na/Cu ratios (175:1 and 640:1).
With their close-to-perfect matrix matching and the measurements run in pseudo-high-resolution mode, differ-ences in the isotope ratios determined in the Tibetan and Mongolian andesines and the Oregon labradorite should therefore reflect the isotopic variation between the two minerals.
Ar isotope analysis
Measurements were carried out at the Institute for Isotope Geology of the University of Bern (Switzerland) using a modified MAP® 215-50B rare gas mass spectrometer. Samples were heated up in a resistance oven in three steps, 1,000, 1,200, and 1,400 °C. The released Ar was measured separately for each heating step. 40Ar+ was collected in a Faraday cup and36Ar+both in a Faraday cup and in an ion counter. The 40Ar/36Ar ratio measured in a mixed cup configuration was gain-corrected.
Minor and trace element analysis
The analyses of the mineral samples were carried out using a 193-nm ArF excimer ablation system (Lambda Physik, Göttingen, Germany) coupled to an ICPMS (Elan6100 DRC, Perkin Elmer, Norwalk, CT, USA). Samples were ablated for 40 s (10 Hz, 80-μm crater diameter) in spot ablation mode. Operating conditions are summarized in Table 2. Data evaluation was carried out following the procedure by Longerich et al. [29] on the isotopes7Li,9Be,
11
B, 23Na, 24,25Mg, 27Al, 29Si, 39K, 42,43,44Ca, 45Sc, 49Ti,
51
V,52,53Cr,55Mn,57Fe,59Co,60Ni,65Cu,66Zn,71Ga,72Ge,
85
Rb, 88Sr, 89Y, 90Zr, 93Nb, 118Sn, 133Cs, 137Ba, 139La,
140
Ce, 141Pr,146Nd, 147Sm, 151,153Eu,157Gd,159Tb, 163Dy,
165
Ho,169Tm,178Hf,208Pb,209Bi,232Th, and238U. Al was used as the internal standard element.
Results Main elements
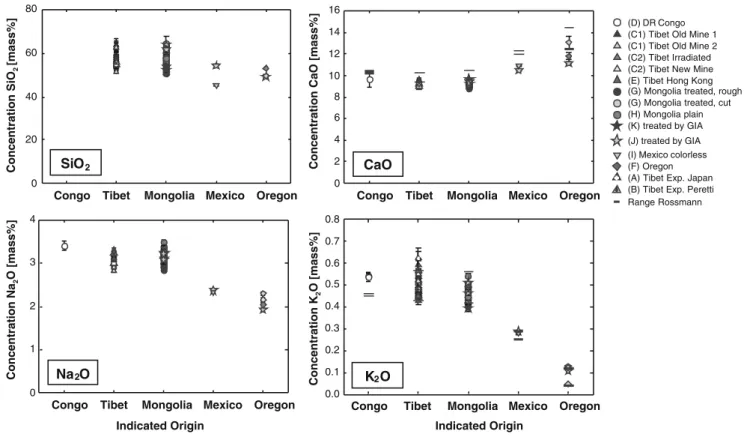
The samples from Oregon, Mexico, and Asia were clearly distinguishable by their main element concentration (see
Fig. 3). All main element data are in agreement with the LA-ICPMS data of Abduriyim [14]. The K2O concentration
also agrees with the values reported by Rossman [9], whereas the mass fractions of CaO were consistently lower than in the reference. The constant underestimation of CaO for the LA-ICPMS measurements is most probably caused either by a systematical bias of the method used in [9] (which is not given) or by the internal normalization using Al in the LA-ICPMS measurements. The large difference in the range of values given by Rossman [9] and our result for the potassium concentration of DR Congo material might be due to a small sample number in their report (not given).
The systematic change of increasing Ca concentration from the Asian to the Mexican and Oregon samples is accompanied by the respectively lower concentration of Na2O. The main element concentrations confirm Oregon
labradorite as the mineral with the highest anorthite fraction, whereas the main composition of Tibetan and Mongolian samples is indistinguishable. The andesine labeled as“Congo” falls into the same range.
Minor and trace elements
The matrix and trace element composition of the Mongo-lian and Tibetan andesines are very similar. Of course, the main difference between the colored and the plain Mongo-lian andesines is the Cu content. Only 1.0±0.7μg/g Cu (n= 9) is present in the colorless species of group (H). The concentration determined in colored samples varies be-tween 310±12 μg/g in a Tibetan andesine labeled as irradiation-treated from group (C1) and 1,500±208 μg/g in a sample from group (E). Fifty-nine out of 69 samples (85%), however, have Cu concentrations in the range of 400–700 μg/g.
The highest variations in the trace elements between the untreated Mongolian andesine and the colored stones were found for the Li, Ni, Zr, Sn, Cs, Tm, and the Pb contents (see Fig.4). Those large relative deviations, however, were mainly caused by their low element concentrations. Except for Li, the samples contained <8 mg/kg of these elements. Whereas the Ni concentration was higher in all groups of Tibetan andesine than in Mongolian andesines, no consis-tent trend was observed for the other elements. Along with a high variability within each group, assignment of the origin by those traces is questionable at best.
The diffusion treatment on the red part of the half-Cu-treated Mongolian andesine (ref no. 10722, group K) mainly affected the Ni, Zn, Sn, Hf, and Pb concentration. Whereas Ni, Zr, Sn, and Hf were close to or represented the detection limit (approx. 0.03μg/g) in the colorless starting material, their concentrations in the treated half were higher than 4, 25, 0.34, and 2.5 μg/g, respectively. Their origin
from the doping Cu powder or ZrO2matrix was also shown
by their initial signal rise compared to the matrix components upon drilling into the surface of the unpolished sample. The concentration differences show that impurities in the treatment agents are readily incorporated into the sample and may provide a means to identify treatment (if they are present in the substances used).
Elemental ratios
The difference in Li content has been used before to assign the source of the respective andesine [14]. The variability in the Ba/Li ratio in comparison to the Ba/Sr ratio for the Tibetan and the Mongolian andesines reported by Abduriyim [14], however, was only found for plain Congo Tibet Mongolia Mexico Oregon
Concentration Na 2 O [mass%] 0 1 2 3 4 Na2O
Congo Tibet Mongolia Mexico Oregon
Concentration SiO 2 [mass%] 0 20 40 60 80 SiO2
Congo Tibet Mongolia Mexico Oregon
Concentration CaO [mass%]
0 2 4 6 8 10 12 14 16 CaO
Congo Tibet Mongolia Mexico Oregon
Concentration K 2 O [mass%] 0.0 0.1 0.2 0.3 0.4 0.5 0.6 0.7 0.8 K2O (D) DR Congo (C1) Tibet Old Mine 1 (C1) Tibet Old Mine 2 (C2) Tibet Irradiated (C2) Tibet New Mine (E) Tibet Hong Kong (G) Mongolia treated, rough (G) Mongolia treated, cut (H) Mongolia plain (K) treated by GIA (J) treated by GIA (I) Mexico colorless (F) Oregon (A) Tibet Exp. Japan (B) Tibet Exp. Peretti Range Rossmann
Indicated Origin Indicated Origin
Fig. 3 Main element composition of all samples measured given as mass fraction of the respective oxides. Al was taken as internal standard. For CaO and K2O, the range of values reported by Rossman [9] was estimated from the tables and is represented by black bars
Elements
Li Be B Na Mg Al Si K Ca Sc Ti V Cr Mn Fe Co Ni Zn Ga Ge Rb Sr Y Zr Nb Sn Cs Ba La Ce Pr Nd Sm Eu Gd Tb Dy Ho Tm Hf Pb Bi Th U
Concentration rel to Mongolia, plain 0
2 4 6 8 10 12
(G) Mongolia treated, rough (G) Mongolia treated, cut (E) Tibet HongKong (C1) Tibet Old Mine 1 (C1) Tibet Old Mine 2 (C1) Tibet Irradiation (C2) Tibet New Mine
Fig. 4 Main and trace element composition of the different red samples in comparison to the elemental composition of the plain, colorless Mongolian andesine (H): crel=csample/cplain− 1
colorless andesine from Mongolia (see Fig.5). In contrast, in this study, reportedly diffusion-treated red andesine from Mongolia showed very similar elemental ratios to the red andesine coming from Tibet.
The higher Li content in almost all red andesines might indicate that Li is diffusing into the samples together with Cu. It has already been reported that Li diffusion rates are exceptionally high in plagioclase feldspar (logD0=−3.8±
1.0 m2/s) compared to other cations [30–32]. In combina-tion with a low activacombina-tion energy (146±14 kJ/mol), Li is easily diffused into feldspars. Another indication in this direction is the decreasing Li content of the Cu-doped Mongolian andesine (L) from the rim to the core. With the Cu concentration decreasing from 1,290±75 to 1,028± 59μg/g and 773±56 μg/g from the red outer part into the transparent center, the Li concentration measured was 24.3± 1.0 μg/g through 22.6±1.5 to 19.5±1.4 μg/g. The same parallel behavior was found for another andesine from Tibet as shown in Fig.6. Thus, small amounts of Li might have diffused together with Cu into the sample.
The samples measured by Abduriyim [14] included only red andesines sampled in Tibet and near-colorless Mongo-lian andesines. With the enhanced Li content being found in most of the red andesines, the Ba/Li cannot serve as a tool to distinguish diffused samples from potentially naturally red colored samples.
Cu isotope ratios
Scanning profiles of diffusion-treated samples
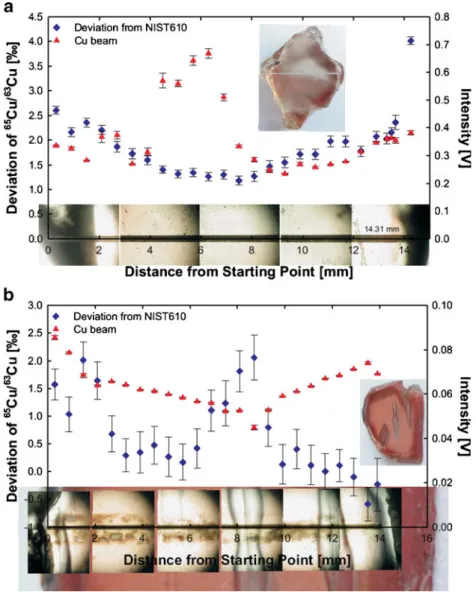
The Cu signal intensities as well as the deviation of the measured isotope ratios from the bracketing standard of the laboratory Cu-diffused Oregon and Mexican andesine are summarized in Fig. 7. The diffusion process is represented by the decreasing isotope ratios from the rim to the core in the Oregon sample (ref no. 668715302, group (J)). Interestingly, this is not dependent on the Cu signal intensity which shows a significant increase 4–6 mm away from the starting point of ablation. Since the Zn signals increased at these positions as well, this is most probably caused by changes in the ablation efficiency due to differences in the absorption. The unaffected trend of the measured isotope ratio at this point underlines the feasibil-ity of the method.
The isotope ratios obtained from the line scan across the Cu-treated Mexican sample (ref no. 668714802, group (J)) were less continuous. Whereas the Cu isotope ratio generally decreased from the starting point at the rim toward the center, the trend was intercepted twice when the laser crossed green-colored areas of the otherwise evenly transparent red sample. The Cu signal intensity in these regions decreased while the isotope ratios accordingly were enriched in the heavier isotope. The green color is situated around straight cracks or cuts through the sample. Through these channels, the Cu dopant can more easily diffuse into the sample. The heavier isotope ratio in those regions is most probably caused by an unfractionated transport of the dopant through the channel. From there, it diffuses sideways into the bulk and thereby undergoes fractionation. The third green region was not or not distinctly accompanied by an isotope ratio increase. Since it is located below the ablated surface, any influence should consequently be smaller.
Both samples show that Cu diffusion is reflected in the Cu isotope ratios within one mineral.
A real case sample was available in the form of a Cu-doped Mongolian andesine (group (L)). The data derived from the line scan from the dark red rim region toward the transparent core are shown in Fig.8.
The trend toward a lighter isotope ratio from the rim to the core of the Cu-doped Mongolian andesine is distinc-tively shown. The higher ratios observed at the last position and ∼0.5 cm away from the starting point are associated
Ba/Li 0 5 10 15 20 25 Ba/Sr 0.06 0.07 0.08 0.09 0.10 0.11 0.12 0.13 0.14
(C1) Tibet Old Mine 1 (C1) Tibet Old Mine 2 (C2) Tibet Irradiated (C2) Tibet New Mine (E) Tibet HongKong (G) Mongolia treated, rough (G) Mongolia treated, cut (J) Mongolia treated by GIA (H) Mongolia plain
Fig. 5 Ba/Sr vs. Ba/Li elemental ratio in various andesine samples
Distance from Starting Point [mm]
0 1 2 3 4 5 6 7 8 9 10 Li Concentration [mg/kg] 0 2 4 6 8 10 12 14 16 Cu Concentration [mg/kg] 100 150 200 250 300 350 400 Li Concentration Cu Concentration
Fig. 6 Li and Cu concentration measured in 130 spot analyses across a Tibetan andesine sample (ref no. 8024, group C1)
with temporarily increasing Cu signal intensities. This increase is, however, not visible in the graph shown in Fig.8since it is evened out by the 60-s integration interval. In total, the intensity decreases by a factor of∼3.6 from the start to the end point. The successively lighter isotope ratio
fits well with a mass-dependent diffusion process. As shown on the laboratory-treated sample group (J), diffusion is the most probable mechanism by which the copper has been incorporated into the mineral.
Since the Cu isotope ratio on the rim depends very much on the method used to get the Cu into the colorless andesine (isotope ratio of the Cu dopant, temperature, exposure time, degree of diffusion, etc.), this approach does not allow distinguishing between a naturally colored and a Cu-doped andesine by comparing the Cu isotope ratios of two minerals. However, the part of the tampered gem mentioned above (L), which is already transparent, has still a higher Cu content than the naturally Cu containing Oregon andesines (group F).
Comparison of Tibetan and Mongolian andesine
To compare the Cu isotope ratios of andesines coming from different origins, samples from both Asian locations were analyzed. The results are presented in Fig. 9.
Fig. 7 Total Cu beam signal intensity and65Cu/63Cu (error given as 1 SE) of the Cu-treated Oregon (a ref no. 668714802) and Mexican (b ref no. 668715302) sample for a line scan across the entire surface. Microscope pictures (Olympus BX51 TRF, Olympus Optical Co. LTD., Japan) show the ablation line and reveal the correlation between the green intersections and the isotope ratio as well as the Cu intensity in the Mexican sample. The difference in the standard errors is caused by the lower sensitivity during the second experiment
Distance from Starting Point [mm]
0 2 4 6 Deviation of 65 Cu/ 63 Cu [‰] -3 -2 -1 0 1 2 3 Intensity [V] 0.00 0.02 0.04 0.06 0.08 0.10 0.12 0.14 Deviation from NIST610
Cu beam
Fig. 8 Cu signal intensity and deviation of the65Cu/63Cu from the bracketing NIST610 of the Cu-doped Mongolian andesine (L) measured in a line scan from the dark red rim region toward the transparent core
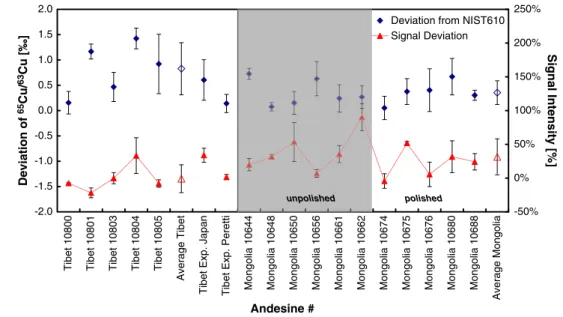
The tendency for the Tibetan samples (group C1) to have a lower Cu content is reflected in their lower Cu signal intensity and accompanied by an averaged higher isotope ratio. However, the difference from the averaged Mongo-lian samples (group (G)) is not significant. Furthermore, the large spread of isotope ratios in between the Tibetan andesines does not allow distinguishing between the two sources. The isotope ratio spread for the Mongolian samples is lower for the range of samples analyzed, yet the Cu content and signal intensity vary to an even greater degree. No difference in the Cu isotope ratios was found between polished and rough andesines from Mongolia. The isotope ratio deviations of the andesines collected on-site during the expeditions to the Tibet mines (groups (A) and (B)) fall within the range of both the Mongolian and the Tibetan samples.
The Oregon sample (group (F)) which was included in most analyses always showed a significantly higher isotope ratio. Due to its low Cu content, only measurements with a Cu signal intensity >10 mV were taken into account to derive an averaged deviation from NIST610 as 3.6±1.0‰. Interference by a remaining40Ar23Na+signal on m/z63 should be most problematic for samples of high Na/Cu ratios. However, the65Cu/63Cu ratio of the Oregon sample with a Na/Cu ratio of 640:1 showed the highest positive bias from NIST610 and consequently the highest enrich-ment in65Cu relative to63Cu. This confirms the feasibility of interference control in the high-resolution mode. Argon isotope ratios
The temperature for the diffusion treatment process has to be below the solidus lines of andesine which contains
∼50% anorthite (<1,250 °C) to avoid melting. At the same time, the temperature has to allow rapid diffusion of Cu into the sample. At 1,000 °C, Emmett and Douthit [12] observed no significant coloration by the Cu dopant, whereas treatment at 1,100 and 1,170 °C resulted in various shades of red, green, and dark red/brown. So any treatment is most probably carried out at temperatures between 1,100 and 1,200 °C. Since the release temperature of argon in feldspar is well below this value (180–330 °C) [33], a significant amount of argon should have been released by the heat treatment.
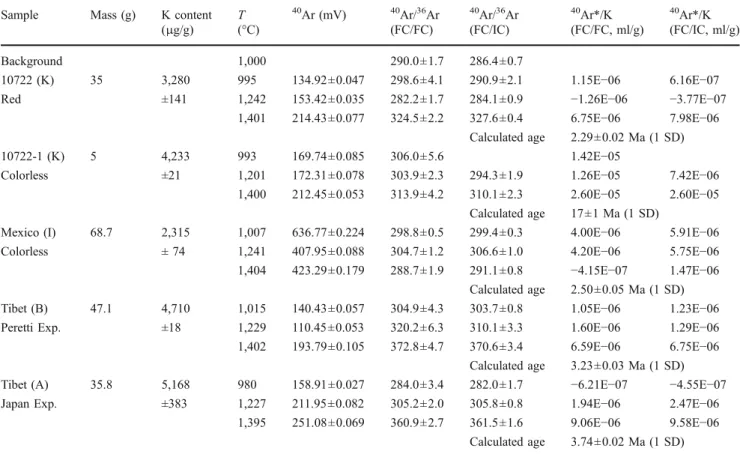
Both halves of the partly Cu-treated Mongolian andesine (ref no. 10722 and 10722-1, group (K)) were analyzed as well as the samples directly collected on-site (groups (A) and (B)). A Mexican colorless andesine (group (I)) with a lower K concentration was also analyzed for comparison. The amount of radiogenic argon Ar* was calculated by subtracting the atmospheric argon and then normalizing to the sample mass and K concentration.
All red-colored samples showed low amounts of Ar at the first two temperature steps and a significant increase in total Ar as well as the fraction of radiogenic argon released at the highest heating temperature of 1,400 °C. The release of 40Ar* was at least a factor of four higher than at 1,000 and 1,200 °C. From the colorless samples, the Mexican sample released the highest total amount of argon during the first heating step, but in general showed a 40Ar* concentration close to zero. The colorless and thus untreated part of the Mongolian andesine gave the overall highest ratio of 40Ar*/K. Whereas it also released an elevated amount of radiogenic Ar at 1,400 °C, when the small sample melted away, the increase was only a factor of two higher than at both lower temperatures.
polished -2.0 -1.5 -1.0 -0.5 0.0 0.5 1.0 1.5 2.0
Tibet 10800 Tibet 10801 Tibet 10803 Tibet 10804 Tibet 10805
Average Tibet
Tibet Exp. Japan Tibet Exp. Peretti Mongolia 10644 Mongolia 10648 Mongolia 10650 Mongolia 10656 Mongolia 10661 Mongolia 10662 Mongolia 10674 Mongolia 10675 Mongolia 10676 Mongolia 10680 Mongolia 10688 Average Mongolia
Andesine # Deviation of 65 Cu/ 63 Cu [‰] -50% 0% 50% 100% 150% 200% 250% Signal Intensity [%]
Deviation from NIST610 Signal Deviation
unpolished
Fig. 9 Deviation of 65Cu/63Cu and the signal intensity of Tibetan (group C1, expedition samples groups (A) and (B)) and Mongolian (group (G)) andesine (full symbols) from NIST610. The error is presented as 1 SD of three bracketed scans. The average of the samples from each origin is represented by open symbols. All Tibetan as well as Mongolian samples from 10644 to 10662 were rough materials, whereas the Mongolian andesines 10674 to 10688 were cut and polished
The significant release of40Ar* from both red samples only at very high temperatures well above a potential treatment temperature gives a strong indication that an old mineral containing a high amount of radiogenic Ar has been subjected to substantial temperatures before analysis.
The amount of radiogenic argon released can be used to calculate the age of formation of the feldspar (see Table 3). However, one has to be very careful in using these age approximations in this case since no external reference standard was used and secondary changes of the minerals were not considered. The age calculation depicts, however, very clearly the effect of heat treatment. The amount of 40Ar* from the colorless half of the Mongolian andesine 10722 corresponds to an age of 17 ± 1 Ma (1 SD). The same andesine 10722 after heat treatment has lost so much of the argon it contained that its calculated age only amounts to 2.29 ± 0.02 Ma. The ages of the two samples collected on-site of 3.23 ± 0.03 Ma (group (B)) and 3.74 ± 0.02 Ma (group (A)) are very close to this value.
Another“mine trip to Tibet” [14]
Invited by the mine owner to visit the copper–andesine occurrence in Tibet, one of the authors (AP) went to Tibet in November 2009 to collect further evidence from the field. He was shown a new mine about 8 h from Lhasa by driving over a 5,500-m high pass and down into a steep valley. The presented mining spot (29.13444° N, 92.59916° E) was situated in an alluvial bed of a 100-m-thick layer containing rounded boulders and sand layers with variations in grain size and a variety of sedimentary structures. A mining camp with a tent and eight miners was present. About five open pits of 10 m in diameter were dug 3–5 m deep into the alluvial beds. Three miners were sorting copper-bearing andesine from the loose sedimentary gravels at the time of the visit. The size of the andesines was about 0.5–1 cm on average. A few smaller pieces were also found in the same spot. The other gravels consisted of more feldspars and rock fragments with the absence of mica. Copper–andesine occurred only in certain areas of the bottom layer of the mine. Hundreds of copper–
Table 3 40Ar+signal intensities, isotope ratios, and ratio of radiogenic40Ar* released by the mineral at each oven temperature relative to the respective K content
Sample Mass (g) K content
(μg/g) T (°C) 40 Ar (mV) 40Ar/36Ar (FC/FC) 40 Ar/36Ar (FC/IC) 40 Ar*/K (FC/FC, ml/g) 40 Ar*/K (FC/IC, ml/g) Background 1,000 290.0±1.7 286.4±0.7 10722 (K) 35 3,280 995 134.92±0.047 298.6±4.1 290.9±2.1 1.15E−06 6.16E−07
Red ±141 1,242 153.42±0.035 282.2±1.7 284.1±0.9 −1.26E−06 −3.77E−07
1,401 214.43±0.077 324.5±2.2 327.6±0.4 6.75E−06 7.98E−06
Calculated age 2.29±0.02 Ma (1 SD)
10722-1 (K) 5 4,233 993 169.74±0.085 306.0±5.6 1.42E−05
Colorless ±21 1,201 172.31±0.078 303.9±2.3 294.3±1.9 1.26E−05 7.42E−06
1,400 212.45±0.053 313.9±4.2 310.1±2.3 2.60E−05 2.60E−05
Calculated age 17±1 Ma (1 SD)
Mexico (I) 68.7 2,315 1,007 636.77±0.224 298.8±0.5 299.4±0.3 4.00E−06 5.91E−06
Colorless ± 74 1,241 407.95±0.088 304.7±1.2 306.6±1.0 4.20E−06 5.75E−06
1,404 423.29±0.179 288.7±1.9 291.1±0.8 −4.15E−07 1.47E−06
Calculated age 2.50±0.05 Ma (1 SD)
Tibet (B) 47.1 4,710 1,015 140.43±0.057 304.9±4.3 303.7±0.8 1.05E−06 1.23E−06
Peretti Exp. ±18 1,229 110.45±0.053 320.2±6.3 310.1±3.3 1.60E−06 1.29E−06
1,402 193.79±0.105 372.8±4.7 370.6±3.4 6.59E−06 6.75E−06
Calculated age 3.23±0.03 Ma (1 SD)
Tibet (A) 35.8 5,168 980 158.91±0.027 284.0±3.4 282.0±1.7 −6.21E−07 −4.55E−07
Japan Exp. ±383 1,227 211.95±0.082 305.2±2.0 305.8±0.8 1.94E−06 2.47E−06
1,395 251.08±0.069 360.9±2.7 361.5±1.6 9.06E−06 9.58E−06
Calculated age 3.74±0.02 Ma (1 SD) Ratios with40Ar+
measured in the FC while36Ar+ measured in an IC were corrected for the gain which was determined by the ratio of the36Ar+ beam measured in both detectors, FC or IC. The40Ar+ release from the system was measured without a sample in the oven (n=4). The error is given as 1σ. Sample groups are given in parentheses
andesine specimens were found, but only occurred in disturbed spots and a single grain size layer. Undisturbed layers with fine sedimentary structures of other grain sizes featured no copper–andesine specimens. When checking another cross-section toward the river side to examine the presence of andesine-bearing lenses, miners were quick to follow and were observed positioning samples into different spots. Copper–andesines were finally presented to AP as existing in a primary occurrence in a hard rock boulder (a hard black carbonate with isolated red mineral inclusions). Sam-ples were hammered out on the spot and an investigation using a portable laboratory (microscope, hardness tester, etc.) revealed that the red mineral inclusion in the blackish marble was a red carbonate similar in color and size to copper-bearing andesine samples. This test on the spot was later confirmed in the laboratory.
The mine, mining operation, and testing at the mine have been recorded on DVD and stored in the archive of GRS.
Conclusion
This study shows that neither element nor isotope ratio analyses can attribute Tibetan and Mongolian samples to different sources, although the mining sites are nearly 2,000 miles apart. Andesines supposedly coming from there are much more similar than labradorites from the two Oregon mining sites, Plush and the Ponderosa mine in Harney County, between which the distance is <200 miles. The main element concentration allowed excluding the possibility that diffusion-treated Mexican raw material is sold as coming from any other source since its composition is clearly distinguishable.
The fact that close to all colored Asian samples had low Ba/Li ratios and a potential concurrent diffusion of Li with Cu rules out the use of this criterion for provenance testing. Especially a differentiation between different Asian mine locations is not possible. This finding is in contrast to what has been proposed before [14].
The Cu isotope ratio measurements are hampered by the many factors influencing the isotopic composition present in the samples: Starting from the isotope composition of the treatment, the exposure time and temperature will define penetration depth and concurrent diffusion rates which determine the diffusion-induced fractionation. As observed in the laboratory-treated andesines as well as the diffusion-treated Mongolian sample, relative differences to NIST610 might vary up to 3‰ within one mineral. Whereas a potential origin authenticity test has shown promising results for natural Paraíba tourmalines [34], diffusion-treated samples have an inherently large intra-sample spread in their isotope ratios. An additional problem in differentiation might be the incorrect assignment of the
location of the gemstone material selected for analysis as provided by the gemstone traders. The large spread in isotope ratios found within different and on single samples might, however, already be an indication for diffusion treatment in both cases.
Differences in the Cu contents and isotope ratios between gemstones labeled as Tibetan or Mongolian might be explainable by different treatment processes using slightly different substances and conditions on the same starting material. However, the only irrevocably naturally colored mineral from Oregon always showed the highest isotope ratio. The Ar isotope ratio data indicate a heat treatment of both andesines collected on-site by the Gemmological Association of All Japan as well as by the GRS expedition. Our results are in agreement with the findings by Rossman [9] and strongly support the theory of a Cu diffusion treatment of the“Tibet”-labeled andesines.
One of the authors’ (AP’s) trip to the claimed Tibetan mines in 2009 confirmed the analytical findings. Based on his examination of the site and in accordance with our data, it is highly probable that these mining sites are actually a “very elaborate hoax,” as McClure [15] guessed them to be.
If all currently available Asian samples can now be considered as treated, the criterion to distinguish between treated and untreated andesines might be very simple: Oregon samples contain Cu in concentrations varying from 40 to 200 μg/g when colored [3]. Only
schiller-bearing samples—which are easily picked out—may
contain up to 300 μg/g Cu [3]. Except for one gem in this study, samples of Asian origin, however, contained at least 350 μg/g Cu and, in most cases, more. In addition, main element analysis unmistakably distinguishes ande-sines of Mexican, Oregon, and Asian origin. In combina-tion with isotope ratio measurements, elemental analysis is therefore a viable technique for provenance and authen-ticity studies of gemstone material.
Addendum
At the point of printing this paper, a group of scientist was invited to visit Tibet for further exploring the authenticity of a further Copper andesine mine. Material or information from this expedition was not available for this report. Acknowledgments Prof. Igor Villa from the Institute of Geology of the University in Bern is warmly thanked for access to and substantial help with the use of the noble gas spectrometer and argon data evaluation. In addition, his comments, suggestions, and critical remarks to general and special aspects of the topic were greatly appreciated. Prof. George Rossman’s personal description of their Ar analysis procedure was very helpful in carrying out the experiments. We thank Ken Scarratt of GIA (Thailand) for providing diffusion-treated andesine samples for this research project. Dr. John Emmet’s diffusion treatment of our samples from Mongolia—carried out at his
own cost and a key experiment for the interpretation of our data—is highly valued. We thank those companies that helped by supplying samples, organizing the expedition to Tibet, and being interested in the outcome of the research, whatever it may be. It was a very important, clarifying field expedition and an experience unique of its kind. Dr. Joachim Koch, Dr. Helmar Wiltsche, and Reto Glaus are thanked for software and hardware support with the laser system.
References
1. James R (2008) Sunrise over Oregon.http://www.yourgemologist. com/ISGForumsBoard/showthread php?p=24578post24578,
accessed 10 June 2009
2. HRJ4 (2009) State emblems; State Boundary: chapter 186 3. Hofmeister AM, Rossman GR (1985) Exsolution of metallic
copper from Lake County labradorite. Geology 13:644–647 4. GIA (2009) Introduction. GIA: News from Research (Special
Issue on Red Feldspar)
5. Brooks-Pike L (2006) What’s in a name?http://www.yourgemologist. com/ISGForumsBoard/showthread.php?t=1372&highlight=Labrado rite+Feldspar, accessed 18 August 2010
6. James R (2008) Answers on“andesine/labradorite” color source. http://www.yourgemologist.com/ISGForumsBoard/showthread php?t=3412, accessed 10 June 2009
7. Emmett JL, Scarratt K, McClure SF, Moses T, Douthit TR, Hughes R, Novak S, Shigley JE, Wang WY, Bordelon O, Kane RE (2003) Beryllium diffusion of ruby and sapphire. Gems Gemol 39:84–135 8. James R (2008) ISG report on the diffusion treatment of
andesine. http://www.schoolofgemology.com/GemResearch/ ISGAndesineReport.html, accessed 18 August 2010
9. Rossman GR (2009) The red feldspar project. GIA: News from Research (Special Issue on Red Feldspar)
10. Fritsch E, Rondeau B, Mocquet B, Lulzac Y (2008) “Red andesine” from China: possible indication of diffusion treatment. Gems Gemol 44:166
11. Thirangoon K (2009) Observation on effects of heating and copper diffusion in feldspar (an on-going research). GIA: News from Research (Special Issue on Red Feldspar)
12. Emmett JL, Douthit TR (2009) Copper diffusion in plagioclase. GIA: News from Research (Special Issue on Red Feldspar) 13. Abduriyim A (2008) Visit to andesine mines in Tibet and Inner
Mongolia. Gems Gemol 44:369
14. Abduriyim A (2009) Gemological properties of andesine collected in Tibet and Inner Mongolia. GIA: News from Research (Special Issue on Red Feldspar)
15. McClure SF (2009) Observations on identification of treated feldspar. GIA: News from Research (Special Issue on Red Feldspar) 16. McClure SF, Shen AH (2008) Coated tanzanite. Gems Gemol
44:142–147
17. Zhu XK, O'Nions RK, Guo Y, Belshaw NS, Rickard D (2000) Determination of natural Cu-isotope variation by plasma-source mass spectrometry: implications for use as geochemical tracers. Chem Geol 163:139–149
18. Mason TFD, Weiss DJ, Chapman JB, Wilkinson JJ, Tessalina SG, Spiro B, Horstwood MSA, Spratt J, Coles BJ (2005) Zn and Cu
isotopic variability in the Alexandrinka volcanic-hosted massive sulphide (VHMS) ore deposit, Urals, Russia. Chem Geol 221:170–187 19. Markl G, Lahaye Y, Schwinn G (2006) Copper isotopes as monitors of redox processes in hydrothermal mineralization. Geochim Cosmochim Acta 70:4215–4228
20. Gonzalez J, Dundas SH, Liu CY, Mao XL, Russo RE (2006) Assessment of the precision and accuracy of thorium (232Th) and uranium (238U) measured by quadrupole based inductively coupled plasma-mass spectrometry using liquid nebulization, nanosecond and femtosecond laser ablation. J Anal At Spectrom 21:778–784
21. Horn I, von Blanckenburg F (2007) Investigation on elemental and isotopic fractionation during 196 nm femtosecond laser ablation multiple collector inductively coupled plasma mass spectrometry. Spectrochim Acta B 62:410–422
22. Kuhn HR, Pearson NJ, Jackson SE (2007) The influence of the laser ablation process on isotopic fractionation of copper in LA-MC-ICP-MS. J Anal At Spectrom 22:547–552
23. Krzemnicki MS (2004) Red and green labradorite feldspar from Congo. J Gemmol 29:15–23
24. Mason TFD, Weiss DJ, Horstwood M, Parrish RR, Russell SS, Mullane E, Coles BJ (2004) High-precision Cu and Zn isotope analysis by plasma source mass spectrometry. Part 1. Spectral interferences and their correction. J Anal At Spectrom 19:209– 217
25. Fontaine GH, Hattendorf B, Bourdon B, Gunther D (2009) Effects of operating conditions and matrix on mass bias in MC-ICPMS. J Anal At Spectrom 24:637–648
26. Barling J, Weis D (2008) Influence of non-spectral matrix effects on the accuracy of Pb isotope ratio measurement by MC-ICP-MS: implications for the external normalization method of instrumental mass bias correction. J Anal At Spectrom 23:1017–1025 27. Vanhaecke F, Dams R, Vandecastelle C (1993) Zone model as an
explanation for signal behavior and non-spectral interferences in inductively-coupled plasma-mass spectrometry. J Anal At Spec-trom 8:433–438
28. Groh S, Garcia CC, Murtazin A, Horvatic V, Niemax K (2009) Local effects of atomizing analyte droplets on the plasma parameters of the inductively coupled plasma. Spectrochim Acta B 64:247–254
29. Longerich HP, Jackson SE, Günther D (1996) Laser ablation inductively coupled plasma mass spectrometric transient signal data acquisition and analyte concentration calculation. J Anal At Spectrom 11:899–904
30. Giletti BJ, Shanahan TM (1997) Alkali diffusion in plagioclase feldspar. Chem Geol 139:3–20
31. Cherniak DJ, Watson EB (1994) A study of strontium diffusion in plagioclase using Rutherford backscattering spectroscopy. Geo-chim CosmoGeo-chim Acta 58:5179–5190
32. Cherniak DJ (2003) REE diffusion in feldspar. Chem Geol 193:25–41
33. Dickin AP, Muller R (1995) Radiogenic isotope geology. Phys Today 49:6–60
34. Fontaine GH, Hametner K, Günther D, Peretti A (2009) Identification test for copper-bearing gemstones (copper–andesine and paraiba-type tourmalines) using copper–isotope ratio deter-minations by femtosecond laser ablation-MC-ICPMS. Hong Kong Jewellery & Gem Fair