HAL Id: hal-01625414
https://hal.archives-ouvertes.fr/hal-01625414
Submitted on 27 Oct 2017
HAL is a multi-disciplinary open access
archive for the deposit and dissemination of
sci-entific research documents, whether they are
pub-lished or not. The documents may come from
teaching and research institutions in France or
abroad, or from public or private research centers.
L’archive ouverte pluridisciplinaire HAL, est
destinée au dépôt et à la diffusion de documents
scientifiques de niveau recherche, publiés ou non,
émanant des établissements d’enseignement et de
recherche français ou étrangers, des laboratoires
publics ou privés.
Arctic springtime low-level mixed-phase clouds over the
Greenland and Norwegian seas
Guillaume Mioche, Olivier Jourdan, Julien Delanoë, Christophe Gourbeyre,
Guy Febvre, Régis Dupuy, Marie Monier, Frédéric Szczap, Alfons
Schwarzenboeck, Jean-François Gayet
To cite this version:
Guillaume Mioche, Olivier Jourdan, Julien Delanoë, Christophe Gourbeyre, Guy Febvre, et al..
Verti-cal distribution of microphysiVerti-cal properties of Arctic springtime low-level mixed-phase clouds over the
Greenland and Norwegian seas. Atmospheric Chemistry and Physics, European Geosciences Union,
2017, 17, pp.12845-12869. �10.5194/acp-17-12845-2017�. �hal-01625414�
https://doi.org/10.5194/acp-17-12845-2017 © Author(s) 2017. This work is distributed under the Creative Commons Attribution 3.0 License.
Vertical distribution of microphysical properties of Arctic
springtime low-level mixed-phase clouds over the Greenland
and Norwegian seas
Guillaume Mioche1,2,4, Olivier Jourdan1,2, Julien Delanoë3, Christophe Gourbeyre1,2, Guy Febvre1,2, Régis Dupuy1,2, Marie Monier1,2, Frédéric Szczap1,2, Alfons Schwarzenboeck1,2, and Jean-François Gayet1,2
1Université Clermont Auvergne, OPGC, Laboratoire de Météorologie Physique, 63000 Clermont-Ferrand, France 2CNRS, UMR 6016, LaMP/OPGC, BP80026, 63177 Aubière, France
3Laboratoire Atmosphère, Milieux et Observations Spatiales, UVSQ/CNRS/UPMC-IPSL, 78035 Guyancourt, France 4IUT d’Allier, CS 82235, 03101 Montluçon, France
Correspondence to:Guillaume Mioche ([email protected]) and Olivier Jourdan ([email protected]) Received: 1 February 2017 – Discussion started: 15 February 2017
Revised: 29 July 2017 – Accepted: 12 September 2017 – Published: 27 October 2017
Abstract. This study aims to characterize the microphysi-cal and optimicrophysi-cal properties of ice crystals and supercooled liquid droplets within low-level Arctic mixed-phase clouds (MPCs). We compiled and analyzed cloud in situ measure-ments from four airborne spring campaigns (representing 18 flights and 71 vertical profiles in MPCs) over the Green-land and Norwegian seas mainly in the vicinity of the Sval-bard archipelago. Cloud phase discrimination and represen-tative vertical profiles of the number, size, mass and shape of ice crystals and liquid droplets are established. The re-sults show that the liquid phase dominates the upper part of the MPCs. High concentrations (120 cm−3on average) of small droplets (mean values of 15 µm), with an averaged liq-uid water content (LWC) of 0.2 g m−3are measured at cloud top. The ice phase dominates the microphysical properties in the lower part of the cloud and beneath it in the precipita-tion region (mean values of 100 µm, 3 L−1and 0.025 g m−3 for diameter, particle concentration and ice water content (IWC), respectively). The analysis of the ice crystal mor-phology shows that the majority of ice particles are irregu-larly shaped or rimed particles; the prevailing regular habits found are stellars and plates. We hypothesize that riming and diffusional growth processes, including the Wegener– Bergeron–Findeisen (WBF) mechanism, are the main growth mechanisms involved in the observed MPCs. The impact of larger-scale meteorological conditions on the vertical pro-files of MPC properties was also investigated. Large values of LWC and high concentration of smaller droplets are
possi-bly linked to polluted situations and air mass origins from the south, which can lead to very low values of ice crystal size and IWC. On the contrary, clean situations with low temper-atures exhibit larger values of ice crystal size and IWC. Sev-eral parameterizations relevant for remote sensing or model-ing studies are also determined, such as IWC (and LWC) – extinction relationship, ice and liquid integrated water paths, ice concentration and liquid water fraction according to tem-perature.
1 Introduction
The Arctic region is more sensitive to climate change than any other region of the Earth (Solomon et al., 2007). Clouds and particularly low-level mixed-phase clouds related pro-cesses have a major impact on the Arctic surface energy budget (Curry, 1995; Curry et al., 1996; Morrison et al., 2012). Observations suggest that boundary layer mixed-phase clouds (MPCs, mixture of liquid droplets and ice) are ubiquitous in the Arctic and persist for several days under a variety of meteorological conditions (Mioche et al., 2015; Morrison et al., 2012; Shupe et al., 2011; Shupe and Intrieri, 2004). They occur as single or multiple stratiform layers of supercooled droplets near the cloud top in which ice crystals can form and precipitate. These clouds have a large impact on the surface radiative fluxes and Arctic climate feedbacks
(Kay et al., 2012; Kay and Gettelman, 2009). The strong im-pact of MPCs on the energy budget stems from their persis-tence and microphysical properties which result from a com-plex web of interactions between numerous local and larger-scale processes that greatly complicate their understanding and modeling (Klein et al., 2009; Morrison et al., 2012).
However, major uncertainties limit our understanding of the interactions and feedbacks between the physical pro-cesses involved in their life cycle. This complexity translates into the large discrepancies that can be found in numerical models to represent the cloud processes, which in turn im-pacts their capability to forecast cloud properties in the Arc-tic. For instance, global climate models (GCMs) tend to un-derestimate the amount of liquid water in MPCs (Komurcu et al., 2014). Therefore, the representation of ice formation and growth processes and their interactions with the liquid phase (e.g., liquid/ice partitioning, Wegener–Bergeron–Findeisen process) has to be improved, as already shown in previous modeling studies (Prenni et al., 2007 or Klein et al., 2009). Among the various cloud properties which need to be de-scribed more accurately, the cloud thermodynamic phase is a parameter of primary importance since it governs the cloud optical and therefore radiative properties as well as its life cycle (longevity and precipitation formation).
However, measuring the spatial phase distribution in low-level Arctic mixed-phase clouds, in order to relate it to en-vironmental conditions (height, temperature, surface condi-tions, air mass origins, etc.) to parameterize and model it, remains a challenge. The parameterizations of liquid and ice partitioning in numerical simulations vary from one model to another. A study carried out by Klein et al. (2009) compared outputs from 26 different numerical models. They found that using different schemes of temperature-dependent partition-ing yields liquid water content rangpartition-ing from 12 to 83 % for the same cloud top temperature of −15◦C.
Beyond the experimental limitations related to the accurate measurement of the phase partitioning (discussed hereafter), the cloud phase quantification is also hampered by difficul-ties to translate observational characterization into realistic representations for cloud models with a wide range of scales. The definition of a mixed-phase system is actually contro-versial. A mixed-phase cloud can be regarded as a complete cloud system that contains both liquid and ice involved in mixed microphysical processes but does not necessarily im-ply that all volumes in the system contain both phases (Shupe et al., 2008). Additionally, the definition of a mixed-phase cloud or volume could be based either on a threshold value for its optical properties or for the ratio between supercooled liquid droplets and ice crystal mass or number (Cober et al., 2001). The threshold values are questionable. The standard assumption in climate models is that liquid and ice are uni-formly mixed throughout each entire model grid box (with a typical horizontal resolution of 100 and 1 km in the vertical; Tan and Storelvmo, 2016). However, some field measure-ments (see, among others, Rangno and Hobbs, 2001 or
Ko-rolev and Isaac, 2003) suggest that different pockets of solely water or ice in mixed-phase regions coexist with typical scale of tens of meters. This has consequences on how processes like the Wegener–Bergeron–Findeisen process (WBF, Berg-eron, 1935; Findeisen, 1938; Wegener, 1911) should be pa-rameterized in large-scale models.
A better assessment of the ice/liquid partitioning will im-prove our understanding of the life cycle and more precisely the persistence of MPCs since modeling studies show that this persistence is governed by a delicate balance between dynamical, radiative and microphysical processes occurring mainly in the boundary layer (Savre and Ekman, 2015). This understanding is still limited by the description of the mi-crophysical processes related to the initiation and the main-tenance of the ice phase. The cloud processes responsible for the production of ice crystals in the upper part of the cloud seem to be mostly driven by the cloud top temperature and the entrainment rates (Savre and Ekman, 2015). In par-ticular, the assessment of ice nuclei (IN) concentration and its time evolution is of primary importance but relies on a very limited set of in situ observations and needs to be im-proved (Ovchinnikov et al., 2014). The ice crystal number concentrations usually exceed the number of IN particles. These discrepancies could be explained by the limitations of in situ instruments and especially the overestimation of the ice crystal number due to the shattering of large ice crystals on the probe inlets or the inability of instruments measuring IN particles to detect all the activation modes (Baumgardner et al., 2012; Korolev et al., 2011). Secondary ice formation processes or the recycling of IN particles through subcloud sublimation (Lawson et al., 2001; Rangno and Hobbs, 2001; Solomon et al., 2015) may also play an important role and explain such discrepancies. Given the temperatures observed in MPCs, heterogeneous ice nucleation mechanisms are pref-erentially involved. The concentration of large ice crystals (> 100 µm) in particular may be due to heterogeneous ice formation mechanisms (Eidhammer et al., 2010; Prenni et al., 2009). However, which process (among deposition, conden-sation, immersion or contact freezing processes) is mainly responsible for the initiation of ice crystals is still under debate, as modeling studies fail to reproduce the observed ice number concentration (Avramov and Harrington, 2010; Fridlind et al., 2007). In a recent modeling study linked to the Aerosol-Cloud Coupling and Climate Interactions in the Arctic (ACCACIA) campaign, Young et al. (2017) showed that small differences in the predicted ice concentration can have large effects on the microphysical structure (such as ice/liquid partitioning) and lifetime of single-layer MPCs. They suggested that the method of parameterizing primary ice concentration in bulk microphysical models is therefore of primary importance.
The recent developments of ground-based stations (Bar-row, EUREKA, Ny-Ålesund, among others) and spaceborne remote sensing observations (as lidar and radar observations from the CALIPSO and CloudSat platforms, respectively)
allow reliable studies today of Arctic cloud phase variabil-ity from a few kilometers to the pan-Arctic region (Dong et al., 2010; Kay and Gettelman, 2009; Liu et al., 2012; Shupe et al., 2011). Moreover, remote sensing observations from space performed by active instruments onboard CALIPSO (Winker et al., 2003) and CloudSat (Stephens et al., 2002) satellites as a part of the A-Train constellation provide a unique way of characterizing Arctic cloud vertical proper-ties. However, the cloud phase distribution and characteriza-tion are highly dependent on the measurement principle of the instruments.
The aforementioned techniques provide cloud properties typically averaged over 1 km, which may be insufficient to study cloud processes at a microphysical scale (i.e., mea-surements of microphysical cloud properties, spatial resolu-tion less or equal to 100 m). In situ observaresolu-tions are based on direct measurement techniques at a higher spatial resolution (generally < 100 m). Numerous previous studies dedicated to the assessment of the in situ microphysical properties of Arc-tic clouds focused on specific case studies (Avramov et al., 2011; Gayet et al., 2009; Rangno and Hobbs, 2001; Verlinde et al., 2007). Statistical analysis of mixed-phase cloud prop-erties derived from several in situ datasets or airborne cam-paigns are very scarce and often focus on the western Arctic region (McFarquhar et al., 2007; Jackson et al., 2012). Such data analysis strategy is still missing in the European Arctic region (and in the vicinity of Svalbard, over the Greenland and Norwegian seas in particular).
In Mioche et al. (2015), the spatial, seasonal and sur-face conditions’ variability of MPC properties using Cloud-Sat and CALIPSO spaceborne observations has been investi-gated. The study showed a large occurrence of MPCs all year long both over the whole Arctic and the Svalbard regions. It was clearly evidenced that the Svalbard region, due to its spe-cific location near the Atlantic Ocean, presents a larger oc-currence of low-level MPCs compared to the averaged Arc-tic. Then, it appears important to investigate the microphys-ical properties of MPCs in the Svalbard and Greenland Sea regions from a statistical point of view to provide representa-tive profiles that can be compared to previous works focused on the western Arctic region.
This work provides statistical analysis of liquid and ice properties of low-level Arctic MPCs from in situ data col-lected in single-layer MPCs during several airborne cam-paigns in the region of Norwegian and Greenland seas car-ried out between 2004 and 2010. We compiled observa-tions of microphysical composition of Arctic mixed-phase clouds (cloud phase, hydrometeor number, mass and shape) to present vertical profiles of liquid and ice properties. The main objective is a step to a better understanding of the processes involved in the Arctic low-level MPC life cycle at the microphysical scale. We aimed to relate these prop-erties to environmental conditions in order to improve the cloud parameterizations used in models and remote sensing algorithms. The results will also complement previous works
concerning Arctic cloud characterizations performed in the western Arctic.
This paper is organized in four sections. The description of the field experiments, instrumentation and datasets will be made in Sect. 2. Section 3 will present and discuss the vertical profiles of microphysical properties of the low-level MPCs. Finally, key parameterizations useful for modeling or remote sensing will be proposed in Sect. 4.
2 Field experiments, airborne measurements and meteorological situations
2.1 Airborne campaigns
This study is based on in situ data collected in single-layer MPCs during the following four international airborne cam-paigns organized in the “European” Arctic region:
i./ii. The Arctic Study of Tropospheric Aerosols, clouds and Radiation experiments (ASTAR; Herber et al., 2004; Jourdan et al., 2010; Ehrlich et al., 2009; Gayet et al., 2009; Lampert et al., 2009) took place in the vicinity of Svalbard (Longyearbyen, Norway, 78◦N, 15◦E) in April 2004 and April 2007. The Polar-2 aircraft oper-ated by AWI (Alfred Wegener Institute) was flown dur-ing these two experiments.
iii. The Polar Study using Aircraft, Remote Sensing, Sur-face Measurements and Models, of Climate, Chem-istry, Aerosols, and Transport (POLARCAT-France; Delanoë et al., 2013; Law et al., 2008; Quennehen et al., 2011) was carried out in northern Sweden (Kiruna, 68◦N, 20◦E) in April 2008 during the International
Po-lar Year. Measurements were performed onboard the French ATR-42 aircraft of SAFIRE (Service des Avions Français Instrumentés pour la Recherche en Environ-nement).
iv. The Solar Radiation and Phase Discrimination of Arc-tic Clouds experiment (SORPIC; Bierwirth et al., 2013) was performed in the Svalbard region in May 2010 with the AWI Polar-5 aircraft.
All the clouds sampled during these four campaigns were lo-cated over the Arctic Greenland and Norwegian seas as dis-played in Fig. 1. The scientific flights during ASTAR and SORPIC covered latitudes ranging from 75 to 79◦N
(Green-land Sea) while the flights during POLARCAT were per-formed between 70 and 73◦N (Norwegian Sea). Moreover, the data were all collected during spring (April and May).
For this study, we restricted the measurements to contin-uous ascent and descent flight sequences into single-layer MPCs at the aircraft speed (between 80 and 100 m s−1for all campaigns) since our main objective is to study the vertical partitioning of ice and liquid thermodynamical phases. Our
Figure 1. Location of the MPC measurements during the ASTAR, POLARCAT and SORPIC campaigns.
dataset consists of 71 cloud profiles (see Table 1) represent-ing more than 21 000 measurement points at 1 Hz (350 min of cloud observations), spread out over 18 flights performed above Arctic open sea water.
2.2 In situ instrumentation
A similar in situ instrumentation was loaded on the three air-craft: the German Polar-2 and Polar-5 and the French ATR-42. The same data processing procedure was used in order to derive the cloud microphysical parameters (at the same scale: i.e., ∼ 100 m). This consistent cloud dataset is used to achieve a statistically representative description of the prop-erties of Arctic mixed-phase clouds sampled over the Green-land and Norwegian seas during spring.
The suite of in situ instruments used to measure the MPC microphysical and optical properties consists of the follow-ing:
– The cloud particle imager (CPI; Lawson et al., 2001) captures cloud particle images on a 1024 × 1024 pixel CCD camera with a pixel resolution of 2.3 µm and 256 grey levels. At least 5 pixels are necessary to identify a cloud particle, so the particle sizes derived from the CPI range from 15 µm to approximately 2 mm. The images are processed using the software developed at the Laboratoire de Météorologie Physique (LaMP; Lefèvre, 2007) based on the original CPIView software (Lawson et al., 2001; Baker and Lawson, 2006). In
par-ticular, it provides particle size distribution (PSD) and derived microphysical parameters such as particle con-centration, effective diameter, extinction coefficient and ice water content as well as a particle habit classifica-tion. The data processing method used to derive the ex-tinction coefficient (σ ) and the ice water content (IWC) is described in Appendix A.
– The forward scattering spectrometer probe (FSSP-100; Baumgardner et al., 2002; Knollenberg, 1981) provides the droplet size distribution from 3 to 45 µm. The de-rived parameters from the PSD are the droplet concen-tration, the effective diameter, the extinction coefficient (σ ) and the liquid water content (LWC).
– The polar nephelometer (PN; Gayet et al., 1997) mea-sures the angular scattering intensities (non-normalized scattering phase function) of an ensemble of cloud par-ticles (either droplets, ice crystals or a mix), from a few micrometers to about 800 µm. In particular, these measurements are used to distinguish spherical from non-spherical particles and thus discriminate the dom-inant cloud thermodynamical phase. The extinction co-efficient and the asymmetry parameter (g) are calcu-lated following the methodology presented in Gerber et al. (2000) and Gayet et al. (2002).
– The Nevzorov probe (Korolev et al., 1998) uses the hot-wire technique to retrieve the liquid water content and the total water content. Note that the Nevzorov data are only used to determine liquid water content during AS-TAR 2004 because the FSSP-100 was not used during this campaign. The retrieval method used to determine the liquid water content is described in Appendix A. All these cloud probes were heated in order to avoid ic-ing duric-ing the flights. The combination of these probes pro-vides the microphysical properties of cloud particles from a few micrometers (typically 3 µm) to about 2 mm. Data are recorded at 1 Hz frequency, which corresponds to a spatial resolution of about 100 m (according to the aircraft speed). The uncertainties and measurement ranges associated with the derived cloud parameters are summarized in Table 2. However, it should be noted that in situ measurements’ ac-curacy may be hampered by the shattering of large ice crys-tals on the probe inlets, inducing smaller particle artifact (Heymsfield, 2007), leading to an overestimation of small particle concentration. For example, previous studies of Field et al. (2003) and Heymsfield (2007) showed that the shatter-ing effect may lead to an overestimation of about 20 % on the bulk properties and a factor 2 or 3 on the number concentra-tion of ice crystals. Moreover, the recent study by Guyot et al. (2015) that compared in situ measurements with the same probes and similar inlet design in a wind tunnel experiment showed that measured particles can vary from one instrument to another and careful calibration is needed. Even through no
Table 1. Summary of in situ observations of Arctic single-layer MPCs.
Field experiment Location Date Number of Number of Duration of data (latitude range) flights in MPCs profiles in MPCs (min) ASTAR 2004 Spitsbergen (Norway) 76–79◦N May 2004 4 7 30 ASTAR 2007 Spitsbergen (Norway) 76–79◦N April 2007 5 34 173 POLARCAT 2008 Kiruna (Sweden) 68–73◦N April 2008 4 10 45 SORPIC 2010 Spitsbergen (Norway) 75–78◦N May 2010 5 20 109
Total 18 71 357
standard method was available during the campaigns to ac-curately determine and remove the impact of the shattering (designed tips, particle interarrival time measurement, etc.), a short analysis is described in Appendix B for the control of the data quality and the significance of the shattering ef-fect. Comparing the extinction coefficient measured by the PN measurements to the extinction derived from the combi-nation of the CPI and FSSP measurements showed that the shattering effect, in our case, was smaller than the measure-ment uncertainties (i.e., 25, 35 and 55 % for PN, FSSP and CPI, respectively; see Table 2).
The three research aircraft also measured basic meteoro-logical parameters along the flight track (see Gayet et al., 2009). We recall that the static air temperature is calculated with an accuracy better than ±0.5 K. If high liquid water contents can alter these temperature measurements, the ob-served contents, lower than 0.6 g m−3 during most of the MPC flights, ensure that this effect was not significant along the cloud transects. The altitude and geographical position parameters were measured by the airborne GPS systems with an accuracy of 50 m.
2.3 Normalized altitudes
Table 3 summarizes, for the 71 selected profiles, the statistics of altitudes for the MPCs’ top and base, as well as the thick-ness of the cloud layer containing liquid water. The mean cloud top altitude is located around 1200 ± 310 m, while the mean cloud base altitude (referring to the altitude below which liquid phase is no longer present) is 756 ± 283 m. This is consistent with observations performed in the western Arc-tic where cloud top altitudes lie between 885 and 1320 m, and cloud base altitudes between 420 and 745 m (McFarquhar et al., 2007). Our measurements also indicate that the thickness of the liquid layer spans from 100 to 950 m with an aver-aged value of 444 m. The objective of this study is to merge and analyze the MPC microphysical data obtained during the four airborne campaigns to derive representative vertical pro-files. Since cloud top and cloud base heights exhibit large variability (see Table 3), the altitudes are normalized follow-ing the method presented in Jackson et al. (2012). The cloud top and cloud base refer to the liquid phase layer, i.e., the cloud layers containing liquid droplets (mixed-phase or
liq-uid only). These layers are identified based on the PN asym-metry parameter values greater than 0.8 (Jourdan et al., 2010; see Sect. 2.4 below). Within these layers (Eq. 1) and below the cloud base (Eq. 2) the normalized altitudes Znare defined
as follows: Zn= Z − Zb Zt−Zb for zb< z < zt (1) Zn= Z Zb −1 for z < zb, (2)
where Zn is the normalized altitude, Z the altitude
corre-sponding to the aircraft measurements, and Zt and Zb the
cloud top and base altitudes, respectively. Thus, an altitude of 1 corresponds to the top-of-the-cloud liquid-containing layer and 0 to its base. Negative values characterize regions of ice precipitation below the cloud layer and the altitude of −1 defines the ground level according to Eq. (2).
To obtain representative statistical results, the cloud lay-ers have been stratified in 10 levels with intervals of 0.2 of normalized altitude, each containing around 2000 obser-vations (i.e., about 10 % of the dataset). The vertical pro-files of MPC microphysical properties presented hereafter are obtained by averaging the in situ measurements over each normalized altitude layer. The profiles are computed for the whole dataset and for each main meteorology situation sepa-rately (see Sect. 2.5) for a better analysis and discussions of the results.
2.4 Determination of the cloud thermodynamical phase from in situ measurements
As stated above, the asymmetry parameter (g) derived from the PN scattering phase function (PhF) measurements is used to discriminate cloud thermodynamic phase. Indeed, in a pre-vious study, Jourdan et al. (2010) have shown with a princi-pal component analysis that g is a reliable proxy to deter-mine the cloud phase of Arctic MPCs. One can notice that our phase discrimination is considered from an optical point of view and differs from the one used by Korolev et al. (2003) which is based on the ice water fraction (IWC/TWC) to iden-tify cloud phase. Large values of g (> 0.83) are typical of an ensemble of particles optically dominated by liquid water droplets where ice crystals do not significantly affect the op-tical properties. On the contrary, smaller values of g (< 0.80)
Table 2. Uncertainties of cloud properties derived from CPI, FSSP, PN and Nevzorov instruments.
Probe Number Extinction Effective diameter Water contents Asymmetry (measurements range) concentration (N ) coefficient (σ ) (Deff) (IWC or LWC) parameter (g)
CPI (15 µm to 2.3 mm) 50 % 55 % 80 % 60 % –
FSSP-100 (3 to 45 µm) 10 % 35 % 4 % 20 % –
PN (< 800 µm) – 25 % – – 4 %
Nevzorov (LWC > 0.003–0.005 g m−3) – – – 20 % –
Table 3. Statistics of cloud base and cloud top altitudes along with cloud layer thickness obtained from the 71 profiles sampled in MPCs. Mean SD Median 25th percentile 75th percentile Max. Min.
ztop(m) 1200 310 1200 1000 1370 2120 525
zbase(m) 756 283 700 510 850 1700 400
Layer thickness (m) 444 211 420 270 600 950 100
are characteristic of a cloud optically dominated by ice crys-tals, with negligible contribution of liquid droplets. For g ranging from 0.80 to 0.83, both liquid droplets and ice crys-tals contribute to the optical properties. The optical signa-ture of the ice is more pronounced (i.e., g decreases) as the concentration and/or the size of ice particles become larger. These results are well illustrated and discussed by Febvre et al. (2012) where PN measurements were combined with FSSP and CPI data.
Figure 2 displays the mean PN scattering phase function (Fig. 2a) according to the normalized MPC altitude levels as well as the vertical profile of the corresponding g values (Fig. 2b). At cloud top, the PhF is characterized by rather high scattering at forward angles (angles lower than 60◦) as-sociated with lower scattering at sideward angles (60–130◦) and enhanced scattering around 140◦. These features are rep-resentative of cloud layers dominated by spherical particles (mainly supercooled liquid droplets), corresponding to typi-cal g values greater than 0.83. As Zndecreases, the PhF
be-comes smoother and more featureless. A side scattering en-hancement is observed along with an attenuation of the 140◦
peak. This behavior can be attributed to the presence of non-spherical ice crystals increasing towards the cloud base. This is in agreement with the continuous decrease of g values ob-served from cloud top (0.84) to cloud base (0.82). Figure 2 also shows that the ice phase region below the cloud layer (−1 < Zn<0) is characterized by a featureless and flat (at
side scattering angles) PhF, with no significant influence of the altitude. These PhF shapes are associated with g values smaller than 0.8. It is thus clearly shown that the PhF and asymmetry parameter are related to specific microphysical properties encountered at different cloud levels. These ob-servations demonstrate that the PhF and the asymmetry pa-rameter can be regarded as an accurate signature of the main microphysical properties observed in the MPC layer parti-cles.
The liquid droplet properties are determined from the FSSP or Nevzorov probe measurements when g values are greater than 0.8 (i.e., indicating a “liquid-containing” phase). Accordingly, the ice crystal properties are derived from CPI measurements when g values are lower than 0.83 (i.e., indi-cating an “ice-containing” phase). For g ranging between 0.8 and 0.83, both liquid and ice properties are derived. More-over, CPI particle images classified as spherical droplets are not taken into account for the determination of ice crystal mi-crophysical parameters. Table 4 summarizes the cloud phase analysis.
2.5 Meteorological situations
All the selected situations correspond to low-level single-layer mixed-phase clouds in the boundary single-layer during spring. If these criteria ensure the homogeneity of the dataset, weather conditions still vary significantly from one campaign to another or even within a campaign. In order to provide a comprehensive dataset to improve model parameterization, it is of great importance to discriminate and classify the observations depending on environmental conditions. The most trivial classification is the temperature regime. Savre and Ekman (2015), showed that it is one of the major fac-tors (with cloud top entrainment) controlling the produc-tion of new ice crystals and the maintenance of MPCs. In the present study, two temperature regimes have been se-lected based on the mean cloud top temperature of each sit-uation: the “cold” situations (−22◦C < T
Top< −15◦C) and
the “warm” situations (−15◦C < T
Top< −8◦C). In spring,
the cold polar vortex that covers the Arctic region weakens and inclusions of midlatitude air masses are more likely. At-mospheric properties such as temperature, humidity and par-ticle loading can change significantly. Arctic cloud proper-ties are then strongly linked to the air mass origin (Gultepe et al., 2000; Gultepe and Isaac, 2002), since their formation is driven by the aerosol particle properties and
thermodynami-Figure 2. (a) Normalized scattering phase function according to the normalized altitude from polar nephelometer measurements (few µm to around 800 µm size range), averaged over all the campaigns. g values indicate the cloud phase: g < 0.80: ice; 0.80 < g < 0.83: mixed; and g >0.83: liquid. (b) Mean vertical profile of asymmetry parameter (for all the campaigns). The grey bars indicate the threshold g values for the assessment of ice, mixed and liquid cloud phases.
Table 4. Summary of the method for the assessment of the cloud thermodynamical phase and liquid droplet and ice crystal properties from the combination of PN, CPI, FSSP and Nevzorov probes.
PN g values (corresponding cloud phase) g <0.80 0.80 < g < 0.83 g >0.83 (ice) (mixed) (liquid) Instrument (measurement range)
FSSP (15 to 45 µm) No Yes Yes Nevzorov probe (LWC > 0.003–0.005 g m−3) No Yes Yes CPI (15 µm to 2.3 mm) Yes Yes No
cal and dynamical conditions. For these reasons, we also in-cluded the air mass origin in the classification, which was determined from the analysis of back trajectories computed with the NOAA HYSPLIT model (Hybrid Single-Particle Lagrangian Integrated Trajectory model; Stein et al., 2015). The back trajectories can be classified into two groups: the air masses originating from the north (over sea ice or open water of the Arctic Ocean and Greenland Sea) that are cold and clean, and the air masses more continental which have traveled over more polluted regions in the south and/or east. We made the choice of only two temperature regimes and two main air mass origin in order to ensure representative and statistically significant datasets for each class. Table 5 shows that all the cold situations are correlated with a north origin air mass (blue in Table 5). Among the 12 warm situa-tions, 7 correspond to air masses originating from the north (green in Table 5) and 5 from the south/east (red in Table 5). So, at the end, this classification leads to only three types of situations: (i) cold cloud top temperature situations with
air masses originating always from the north (hereafter re-ferred to as COLD cases); warmer situations with air masses which originate either (ii) in the north (hereafter WARM_NO cases) or (iii) from the continent: south and east (hereafter WARM_SO cases).
The mean vertical profiles of temperature of these three regimes are displayed in Fig. 3. The results show a well-pronounced temperature inversion (∼ −10◦C) for the WARM_SO situations, whereas WARM_NO cases do not exhibit such clear temperature inversion. The COLD situa-tions are characterized by a temperature of −20◦C at cloud top and by weather situations dominated by cold air out-breaks from higher latitudes (Gayet et al., 2009).
3 Vertical properties of liquid droplets and ice crystal particles within MPCs
The purpose of this section is to provide a quantitative as-sessment of the average microphysical and optical
proper-Table 5. Classification of the MPC situations according to temperature regimes and air mass origins.
Experiment Date Mean TTop Air mass origin N: north (Arctic Ocean) Regime
(◦C) S/E: south or east (continental)
ASTAR 2004 15 May −16.5 N COLD
22 May −8.5 S WARM_SO
25 May −8 N WARM_NO
5 June −11 N WARM_NO
ASTAR 2007 2 April −21 N COLD
3 April −16 N COLD
7 April −22 N COLD
8 April −19 N COLD
9 April −21 N COLD
POLARCAT 2008 31 March −15 N WARM_NO
1 April −10 N WARM_NO
10 April −14 N WARM_NO
11 April −14 N WARM_NO
SORPIC 2010 4 May −13 S/E WARM_SO
5 May −11 S/E WARM_SO
6 May −13 S/E WARM_SO
9 May −15 S WARM_SO
10 May −13.5 N WARM_NO
Figure 3. Vertical profiles (normalized altitude) of the mean tem-perature for each regime. Shaded spreads represent the standard de-viation. The mean cloud base and top altitudes and their standard deviation for each regime are indicated.
ties of the MPC cloud layers at a spatial scale of approxi-mately 100 m. The vertical profiles presented in this study come from aircraft in situ measurements and are obtained from several distinctive clouds. It should be emphasized that these profiles cannot be strictly regarded as vertical and in-stantaneous profiles (each ascending or descending flight se-quence is generally made in 5 to 10 min). It differs from the
remote sensing measurements that usually provide snapshots of the same cloud.
3.1 Liquid phase properties
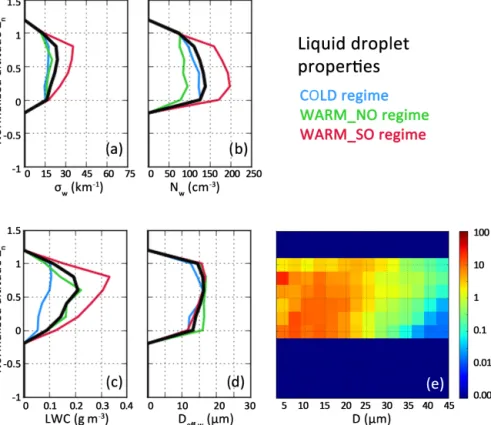
Figure 4 displays the average vertical profiles expressed with the normalized altitude reference for the liquid phase prop-erties: the extinction coefficient, the droplet number concen-tration, the liquid water content and the effective diameter (Fig. 4a to d). These profiles are obtained using FSSP-100 or Nevzorov probe measurements and constrained by PN g val-ues greater than 0.8. In this figure, the average profiles for liquid properties are discriminated for each environmental conditions class: COLD in blue, WARM_NO in green and WARM_SO in red. The mean profile corresponding to the average over all situations (or campaigns) is also shown (in black). The average vertical distribution for the liquid droplet number size distribution is shown in Fig. 4e.
The MPC properties are characterized by increasing val-ues of LWC with altitude. LWC mean valval-ues range be-tween 0.1 g m−3at the bottom of the liquid layer and nearly 0.2 g m−3close to the cloud top. The concentration of cloud droplets remains nearly constant throughout the MPC layers with mean values around 120 cm−3. However, smaller values are observed near the cloud top. Clouds corresponding to the WARM_SO situations are characterized by larger values of droplet concentration and LWC (200 cm−3 and 0.3 g m−3) compared to the COLD and WARM_NO cases. This is re-lated to the fact that air masses originating from midlati-tudes are more humid. The extinction coefficient profiles are
Figure 4. Vertical profiles (expressed in normalized altitude) of liquid droplet properties from FSSP or Nevzorov probe measurements (3– 45 µm size range): (a) extinction coefficient, (b) droplet concentration, (c) LWC, (d) effective diameter for the three regimes and averaged over all the campaigns and (e) averaged droplet size distribution for all the campaigns.
correlated with the LWC measurements, indicating that liq-uid droplets mainly drive the optical properties of the up-per MPC layers. This is consistent with the observed shape of the scattering phase function at cloud top displayed in Fig. 2. The extinction coefficient presents maximum values in the upper part of the cloud (average around 25 km−1) and smaller extinction in the lower part of the liquid layer (down to 15 km−1). Finally, the vertical profiles of the ef-fective diameter (Fig. 4a) and droplet number size distribu-tion (Fig. 4e) are consistent with the extincdistribu-tion coefficient, LWC and droplet concentration. Indeed, the effective diam-eter is proportional to the ratio of the LWC to the extinction coefficient. The cloud layers dominated by the liquid phase exhibit small droplet sizes, with a slight increase of the di-ameter from cloud base to cloud top (from 10 to 15 µm).
The main features of the vertical distribution for the liq-uid phase properties are in agreement with previous observa-tions (e.g., Lawson et al., 2001; McFarquhar et al., 2007 or Jackson et al., 2012). These studies focused on MPCs in the western Arctic region under meteorological situations that can be connected to the ones presented in our work. Law-son et al. (2001) studied a boundary layer MPC in spring over the Beaufort Sea during the First International Satellite Cloud Climatology Regional Experiment Arctic Cloud Ex-periment (FIRE-ACE). The temperature range lied between
−22 and −25◦C. This case could be regarded as the COLD situations in our study. Lawson et al. (2001) showed LWC values around 0.15 g m−3and droplet concentration close to 200 cm−3.
McFarquhar et al. (2007) merged four MPC situations (corresponding to 53 cloud profiles) in autumn over Barrow and Oliktok Point, Alaska, during the Mixed-Phase Arctic Cloud Experiment (M-PACE). The MPCs were associated with a low-level northeasterly flow over the ice pack resulting in persistent roll clouds at low-level altitude. Cloud top tem-peratures lied between −12 and −16◦C. These situations can be related to our COLD and WARM_NO cases. They also observed the increase of liquid droplet size, LWC and num-ber concentration with the altitude. The LWC range (0.15– 0.19 g m−3)is consistent with our study but the droplet size range (from 14 µm at cloud base to 22 µm at cloud top) is slightly larger and the droplet number concentrations signif-icantly lower (between 23 and 72 cm−3). Finally, Jackson et al. (2012) merged 41 MPC profiles during the Indirect and Semi-Direct Aerosol Campaign (ISDAC). They observed liq-uid droplet properties with mean LWC around 0.15 g m−3at cloud top, droplet size from 8 to 16 µm and droplet concen-tration around 150 cm−3. These results are consistent with our observations of the liquid phase within MPCs observed over the Greenland and Norwegian seas.
3.2 Ice phase properties
The ice crystal properties derived from the CPI measure-ments when the PN g values are lower than 0.83 are dis-played in Fig. 5 with the same representation as the one used for the liquid phase. In the following, the ice crystal concen-tration corresponds to particles larger than 100 µm in order to minimize the effect of potential shattering artifacts on this parameter (see Febvre et al., 2012). However, the extinction coefficient, the ice water content, the effective diameter and particle size distribution are determined using all CPI images excluding those identified as liquid droplets. This choice has been made to be consistent with previous studies and allow for accurate comparisons with microphysical parameters ob-tained during western Arctic campaigns. Averaged values of ice crystal concentration (Ni)and extinction coefficient (σi)
are around 3 L−1and 0.4 km−1, respectively. IWC and effec-tive diameter (Deff,i)display mean values ranging from 0.01
to 0.035 g m−3and from 80 to 130 µm, respectively. No clear trend in the mean profiles of these properties is observed, as no significant correlation with height is found. However, the values of these parameters decrease to nearly zero at cloud top (Zn=1). This indicates that the cloud top layer is
al-most exclusively composed of supercooled liquid droplets and eventually a very low concentration of small ice crystals as shown by the PSD in Fig. 5e. These results corroborate the findings from the previous experiments such as the ISDAC and M-PACE campaigns in the western Arctic (McFarquhar et al., 2011; Jackson et al., 2012). These studies were based on 53 cloud profiles during the M-PACE campaign (McFar-quhar et al., 2011) and 41 cloud profiles during the ISDAC campaign (Jackson et al., 2012). The ice crystal properties of single-layer MPCs observed over the Beaufort Sea region did not show any significant vertical variability.
Typical IWC and particle concentration (for crystals with size larger than 125 µm) values lied between 0.006 and 0.025 g m−3 and between 1.6 and 5.6 L−1for the M-PACE situations. These values are similar to those of the COLD and WARM_NO cases of the present study. Averaged values of IWC and particle concentration during ISDAC are in the range of the WARM_SO situations of the present work with values around 0.02 g m−3and 0.27 L−1, respectively, for the ISDAC situations. The average ice crystal size observed dur-ing M-PACE is around 50 µm, which is smaller than the typi-cal size found in our study. It could be explained by less effi-cient WBF and riming processes and smaller droplet number also observed during M-PACE.
Deeper in the precipitation layer, closer to the sea level (Zn< −0.5), no general trend can be depicted as ice crystal
properties show a large variability. Yet, no ice crystals were found in this region for the WARM_SO situations, whereas the ice precipitation reached the surface (Zn= −1) for the
COLD and WARM_NO regimes.
The particle shape vertical distribution was also investi-gated based on the CPI images. It can provide insight on
the main microphysical growth processes occurring in such MPCs. Figure 6 displays the particle shape distributions rel-ative to number and mass concentration with Zn(Fig. 6a and
b) and temperature (Fig. 6c and d). For this purpose, particle shapes have been automatically classified by the algorithm developed at LaMP (see details in Lefèvre, 2007). In addi-tion, the resulting classification was supported by an accurate human-eye visualization in order to control the results and avoid the main shortcomings linked to the automatic classi-fication. As indicated above, only particles with size greater than 100 µm were taken into account in order to avoid mis-classification of smaller particles and shattering artifacts.
Our results clearly show that rimed and irregular ice crys-tals are dominant within MPCs (up to 80 % of the total). In particular, irregular ice particles are encountered at all al-titudes and temperatures. They account for 30 to 50 % of the total number concentration (and between 20 and 30 % of mass concentration) depending on the altitude or temper-ature of the MPC layer. Rimed particles are predominant in-side the liquid-containing cloud layer (0 < Zn<1) with a
contribution up to 40 % in number (60 % in mass) where low temperatures (below −18◦C) are observed.
An interesting feature is the significant occurrence (around 40 %) of ice crystals with a predominant a axis growth at all cloud levels. Indeed, plates, side planes and stellars are the dominant habits among the regular shapes regardless of the cloud layer altitude.
Below the cloud (Zn<0), precipitating ice crystals are
characterized by a mass concentration dominated by rimed particles and a large number concentration fraction of irreg-ular ice crystals.
Overall, these results agree with the ones presented in Mc-Farquhar et al. (2007) based on in situ observations of MPCs during the M-PACE experiment. McFarquhar et al. (2007) also stated that small supercooled water droplets dominated the upper layer of the cloud while larger ice particles were present in the lower part and below the cloud (including ir-regular, aggregate or rimed-branched crystals). But our re-sults differ since they observed a fraction of needles and columns particles a lot larger than in our study (respectively, up to 50 % below the cloud versus less than 10 %). On the contrary, our results are not in agreement with the observa-tions described in Korolev et al. (1999); this is because they observed even less regular ice crystals: irregular-shaped ice crystals accounted for up to 98 % of the total number of ice particles. This disagreement could be explained by two rea-sons. First, Korolev et al. (1999) considered a wide variety of clouds sampled in the Canadian and US Arctic (stratocumu-lus and cirrus at temperatures ranging from 0 to −45◦C and up to 7.5 km altitude), whereas the present study focuses only on MPCs in the Svalbard region at low altitudes. The dis-agreement may also stem from the different image process-ing used in these studies. For instance, Korolev et al. (1999) took into account particles larger than 40 µm (while a 100 µm threshold was used in our study) and two ice crystal shapes:
Figure 5. Vertical profiles (expressed in normalized altitudes) of ice crystal properties from CPI measurements (15 µm–2.3 mm size range): (a) extinction coefficient, (b) ice crystal concentration, (c) IWC, (d) effective diameter for the three regimes and averaged over all the campaigns and (e) averaged particle size distribution for all the campaigns.
pristine (defined as faceted single ice particles) and irregulars were considered (while 10 particle shapes were accounted for in our results).
3.3 Discussion on statistical vertical profiles
The quantitative estimates of the separate properties of droplets and ice crystals may provide insight on the micro-physical processes occurring in MPCs. These processes are involved in the MPC life cycle, in particular to maintain the coexistence of liquid droplets and ice crystals, leading to its persistence (Morrison et al., 2012). More specifically, the in-crease with height of droplet size and LWC observed in the vertical profiles is consistent with a condensational growth process. The slight decrease of LWC and number concen-tration observed at the very top of the cloud may be due to turbulent mixing (Korolev et al., 2015) and entrainment of dry air. Additionally, the data collected in this part of the cloud may also lead to a slight underestimation of the LWC since a mixing of cloudy and cloud-free patches could be av-eraged together given the sampling resolution (i.e., 100 m). The analysis of the vertical profiles of ice properties and ice crystal shapes (see Fig. 6) shows that the presence of pris-tine particles, mainly plates and stellars, could be linked to a very fast ice crystal growth by vapor deposition due to
the WBF process in which ice crystals grow at the expense of liquid droplets. The large contribution of rimed particles confirmed that riming process shall be significant in a mixed-phase cloud. The prevalence of irregular particles is in agree-ment with the previous studies from Korolev et al. (1999) and McFarquhar et al. (2007) and suggests that aggregation growth processes or a combination of several growth mech-anisms are involved. This also indicates that turbulence or mixing into the cloud may have an important influence by redistributing the precipitating ice crystals in the upper cloud levels. Measurements of the vertical wind speed (which are not available for these campaigns) would be helpful to con-firm this hypothesis.
Theoretical adiabatic LWC has also been determined as-suming a non-entraining parcel of moist air rising and reach-ing saturation. It is calculated from the pressure and tempera-ture measurements from cloud base to cloud top. These theo-retical values are then compared to the observed LWC values to evaluate the influence of turbulence or mixing effects on LWC as well as the efficiency of ice growth by WBF pro-cess or riming propro-cesses. The profiles of the adiabatic ratio (the ratio of the adiabatic LWC to the observed LWC) are displayed in Fig. 7. Subadiabatic values are found for all me-teorological regimes. This means that processes responsible for a decrease of LWC compared to the adiabatic prediction
Figure 6. Vertical profiles of particle shapes (from CPI measurements and for particles larger than 100 µm) according to normalized altitude (a, b) and temperature (c, d). Distributions are displayed according to particle number (a, c) and mass (b, d).
are prevalent. In particular, this strengthens the assumption that a turbulent entrainment of dry air, resulting in the evap-oration of liquid droplets, may occur at cloud top. Moreover, this confirms that the WBF and riming processes are effi-cient and responsible for the decrease of LWC compared to adiabatic values. These statements are in agreement with the study from Jackson et al. (2012), who showed for several boundary layer MPCs over Barrow, Alaska, during the IS-DAC campaign that the subadiabatic profile of LWC and the decreasing droplet concentration at cloud top may be associ-ated with the ice crystal growth processes involving the liq-uid phase (riming and WBF) and/or the entrainment of dry air from above.
However, Figs. 4 and 5 also showed significant differ-ences in cloud vertical profiles from one regime to another. The COLD situations exhibit the largest values for ice prop-erties (IWC up to 0.075 g m−3, Ni up to 8 L−1) together
with the lowest LWC values (< 0.1 g m−3). On the contrary, the WARM_SO profiles are characterized by the largest liq-uid droplet concentrations, extinction coefficient and LWC values (∼ 200 cm−3, 40 km−1 and 0.3 g m−3, respectively)
and low values of IWC, extinction and size of ice crys-tals (IWC < 0.01 g m−3, σi<0.2 km−1 and Deff<50 µm,
respectively). Thus, in the WARM_SO regime, it seems that the number of ice crystals is too low and their size too small to efficiently consume liquid droplets by WBF or riming pro-cesses (Pruppacher and Klett, 1978), explaining on one hand the prevalence of the liquid phase and on the other hand that the precipitating ice crystals below the cloud do not reach the surface. Moreover, the habit classification as a function of the temperature shows differences between the COLD regime and the WARM regimes (not shown here). This concerns, in particular, the presence of some large droplets in the WARM regimes which are not present in the COLD regime and the presence of plate and stellar particles below −10◦C or around −4◦C, which is consistent with the classical ice crys-tal morphology diagram (Libbrecht, 2005; Nakaya, 1954).
The adiabatic ratio, shown in Fig. 7, confirms this assump-tion where larger values are encountered for the WARM_SO situations. Indeed, a large adiabatic ratio denotes that pro-cesses responsible for the depletion of liquid droplets (mainly riming or WBF) are relatively less efficient.
Figure 7. Vertical profiles of the ratio of measured LWC over theo-retical adiabatic LWC for the three regimes.
The ice crystal properties relative to the WARM_NO sit-uations are similar to the WARM_SO cases, except for the effective diameter where values are similar to the COLD regime (Deff,i>100 µm). The liquid droplets for this regime
exhibit the lowest concentrations (< 100 cm−3)and an inter-mediate LWC value (around 0.2 g m−3).
The meteorological classification used in our study is also based on the air mass origin since it shall impact the cloud microphysical properties, as shown in Gultepe and Isaac (2002). In particular, COLD and WARM_NO situ-ations characterized by a northern air mass origin should be associated with more pristine conditions and drier air compared to the WARM_SO situations. Airborne in situ aerosol measurements were only available during the PO-LARCAT 2008 campaign (with particle counters). However, nearly continuous aerosol measurements (with particle coun-ters and sizers) but ground based were performed at the Mount Zeppelin station (Ny-Ålesund, Svalbard, 475 m above sea level, 79◦N, 12◦E) during a period encompassing the ASTAR and SORPIC campaigns. Even though these mea-surements do not provide an accurate estimate of the aerosol concentration at the exact location and time when the clouds were sampled, they still give an indication of the background aerosol loading. Based on these measurements, the mean aerosol number concentrations were 230, 120 and 330 cm−3 for the COLD, WARM_NO and WARM_SO, respectively; we can conclude that pristine conditions are encountered for air masses originating from the north and that cloud mea-surements performed under WARM_SO conditions are more
likely to be affected by long-range transport of pollution for the south/east.
The prevalence of the ice phase for the COLD regime is thus consistent both with the cold temperature and the pristine conditions associated with northern air masses. De-spite similar air mass origins, the WARM_NO cases exhibit a smaller concentration of ice crystals than the COLD situa-tions. This suggests that the influence of the cloud top tem-perature prevails to promote the growth or production of ice crystals. The WARM_SO cases which combine warm tem-peratures and continental air masses clearly show that the ice crystal growth or production is reduced, as well as the pre-cipitation efficiency, and that the liquid phase dominates the cloud structure.
Additionally, the comparison of the vertical profiles of MPC properties of the present work to the previous stud-ies concerning the western Arctic in Sect. 3.2 showed that the cloud properties for the COLD and WARM_NO situ-ations agree with that of M-PACE (REF), in particular in terms of ice concentration and IWC. The WARM_SO cases agree more with the ISDAC situations, in particular the low ice concentration. Jackson et al. (2012) explained the very low ice concentration observed during ISDAC as a conse-quence of more polluted situations encountered (compared to M-PACE) that might reduce the secondary ice crystal pro-duction efficiency (thermodynamic indirect effect). This con-clusion is thus in accordance with our assumption that the air mass coming from the south may be more impacted by pol-lution and may reduce the ice growth efficiency.
These analyses show that microphysical properties of Arc-tic MPCs over the Greenland and Norwegian seas are closely linked to the cloud top temperature regime and the environ-mental conditions such as the air mass origin. Similar conclu-sions have already been made for MPCs in the western Arctic regions by Gultepe and Isaac (2002) who demonstrated the impact of the air mass origin (Pacific Ocean or Arctic Ocean) on the MPC microphysical properties.
However, a more thorough analysis involving collocated in situ aerosol measurements is obviously needed to confirm these findings. For instance, our results are somehow consis-tent with Lance et al. (2011) or Rangno and Hobbs (2001) who showed that “polluted” MPCs exhibit higher droplet concentrations and smaller ice-precipitating particles com-pared to “clean” MPCs. A large number of droplets are ex-pected to reduce the riming process and thus contribute to the large observed values of LWC (as liquid droplets are not consumed by the ice crystals).
To go further into the analysis of our microphysical dataset, additional measurements of key parameters are nec-essary. In particular, quantifying the mechanisms responsi-ble for the formation and growth of droplets and ice crys-tals within MPCs by measuring the numbers of IN and cloud condensation nuclei (CCN) is needed. It would enable us to perform an accurate ice closure and to quantify, for example, the possible impact of secondary ice production processes).
A better characterization of the dynamical processes at cloud scale, with accurate high spatial resolution measurements of vertical wind velocities into and around the MPCs would also be necessary. For instance, upward air motion and tur-bulent entrainment of air from above the cloud are critical to maintain liquid water in MPCs. Accurate humidity measure-ments would also be needed to better identify condensational growth of ice crystals (WBF process or direct condensation of water vapor on ice, as described by Korolev, 2007) and re-solve the issue of turbulence and mixing at cloud edges and into clouds. All these parameters, along with radiative flux measurements, are of primary importance to constrain our assumptions on the microphysical processes.
At last, coupling our results (and further observations with new parameters and improved instrumentation) with model-ing is of course the best way to quantify the relative impact of each process on the MPC lifetime. However, such work remains beyond the scope of the present study.
4 Parameterizations of key microphysical parameters In Sect. 3, we have shown that in situ data provide a detailed characterization of the microphysical and optical properties of MPCs. These measurements can also be used to develop cloud parameterizations and to evaluate remote sensing re-trieval products or modeling outputs. This section focuses on the key properties and hence parameters which must be better quantified (Morrison and Pinto, 2006), namely (i) IWC (and LWC) – extinction coefficient relationships, (ii) the variabil-ity of the ice and liquid water paths, (iii) the temperature-dependent ice crystal concentration and (iv) the liquid water fraction (ratio of LWC over total water content) as a function of the cloud level or temperature.
4.1 Ice and liquid water contents and integrated paths Linking cloud microphysical and optical properties is an im-portant step in order to model the cloud radiative proper-ties or to constrain/develop remote sensing retrieval meth-ods. In particular, accurate IWC–extinction relationships and integrated properties such as ice and liquid water paths are needed to improve the remote sensing retrieval products and cloud modeling (Heymsfield et al., 2005; Waliser et al., 2009). In this section, we provide such relationships and pa-rameters based on in situ measurements.
Figure 8a and b display the IWC and the LWC measure-ments as a function of the ice and droplet extinction coef-ficients, respectively, with the temperature superimposed in color. The averaged values of IWC and LWC over intervals of 0.1 and 2 km−1 for the ice and liquid extinction coeffi-cients, respectively, are represented by the grey squares in order to determine the fitting curves (represented by the red lines with the mean absolute error in dashed lines; see Eqs. 3 and 4 below). Ice crystal and liquid droplet extinction
coef-ficients are well correlated with their water content counter-parts. The correlation coefficients are high (0.88 for ice and 0.89 for liquid) and the IWC–σ and LWC–σ relationships are nearly linear.
It should also be noted that including the temperature as an additional parameter for the linear fitting did not improve the accuracy of the parameterizations, contrary to previous studies of Heymsfield et al. (2005), Hogan et al. (2006), or Protat et al. (2007, 2016). However, these previous studies concerned tropical and midlatitude clouds and cover a much broader range of temperatures (from −65 to 0◦C, compared to narrower range from 24 to 0◦C in our study).
IWC = 0.076 σ1.06 (3)
LWC = 0.0016 σ1.31 (4)
with IWC and LWC in g m−3and σ in km−1.
Integrated properties such as liquid water path (LWP) and ice water path (IWP) are common modeling outputs which suffer from large discrepancies depending on the model spec-ifications (Waliser et al., 2009). Moreover, only a very lim-ited number of studies were devoted to retrieving these prop-erties from in situ measurements in this region of the Arctic. Since the flight legs selected in our study target ascending and descending sequences into single-layer MPCs, in situ measurements can be used to determine IWP and LWP ac-cording to the following equation:
IWP (or LWP) =
cloud top
Z
ground
IWC (or LWC) (z) dz. (5)
We recall that these integrated properties should be consid-ered quasi-instantaneous, as ascending and descending flight sequences are obviously not fully vertical and need about 5–10 min to be performed (compared to the snapshots per-formed by remote sensing measurements).
Figure 8c displays the ice (green) and liquid (blue) water paths as a function of the cloud top temperature (1◦C inter-vals). For cloud top temperatures below −20◦C, IWP and LWP reach values close to 30 and 50 g m−2, respectively. The IWP decreases dramatically when the cloud top tem-perature increases; very low values close to 0 are encoun-tered at temperatures above −8◦C. LWP reaches a maxi-mum of 100 g m−2at −13◦C and the smallest values (around 15 g m−2)are encountered when the cloud top temperature is typically around −18◦C. These findings are consistent with
the main previous studies devoted to Arctic MPCs (Hobbs et al., 2001; Pinto, 1998; Pinto and Curry, 2001; Shupe et al., 2006). They reported mean LWP values in the range of 20–70 g m−2, with some maxima up to around 130 g m−2, and IWP mean values less than 40 g m−2. However, one shall note that all these previous studies concerned once again the MPCs in the western Arctic regions (Barrow, Alaska, Beau-fort Sea).
Figure 8. (a) IWC and (b) LWC as a function of extinction coefficient. Color scale indicates the temperature; grey squares represent the values averaged over extinction coefficient intervals of 0.1 and 2 km−1for IWC and LWC, respectively. The red lines represent the curve fittings and the dashed lines the uncertainties on the fitted relationships (mean absolute errors). (c) Ice (green) and liquid (blue) water paths according to the cloud top temperature.
4.2 Ice crystal concentration
The accurate knowledge of the ice crystal concentration is of primary importance to correctly parameterize the initia-tion and evoluinitia-tion of the ice phase in models and reduce the significant uncertainties in the modeling of the ice/liquid par-titioning within MPCs.
Figure 9 shows the maximum number concentration of ice crystals with size greater than 100 µm as a function of the cloud top temperature for each MPC vertical profile. The data points are color-coded according the COLD, WARM_NO and WARM_SO environmental regimes. This figure high-lights that the maximum ice concentration varies almost ex-ponentially (figure is in log-lin scale) with the cloud top tem-perature, with nevertheless a large variability. Thus, a rela-tionship may be fitted in order to parameterize the ice crystal number concentration as a function of temperature in MPCs (Eq. 6, also included in Fig. 9), even though the correla-tion coefficient is quite low (0.43). The mean absolute error (MAE) is also displayed in Fig. 9 (dotted lines) to estimate the uncertainties on the parameterization.
Ni,max=e(−0.191Ttop−1.134)with Ni,maxin L−1
and Ttopin◦C (6)
For comparison purposes, the parameterizations of Meyers et al. (1992) and Cooper (1986) for heterogeneous ice nu-cleation and the parameterization of Young et al. (2017) for primary ice nucleation based on microphysical observations during the Aerosol-Cloud Coupling and Climate Interactions in the Arctic (ACCACIA) campaign are displayed (in purple, orange and brown dashed lines, respectively). The Meyers et al. (1992) parameterization is within the range of the uncer-tainties of our parameterization. However, it significantly de-viates from our relationship for cloud top temperature higher
than −15◦C, i.e., for clouds under warm regime. For these regimes, the ice number concentrations can differ by a factor of up to 2 at −10◦C.
The parameterizations of Cooper (1986) and Young et al. (2017) do not match with the present parameterization since the ice crystal concentrations predicted are around 1 or-der of magnitude lower than the ones in the present study. This difference can be explained by the different seasons, cloud types and locations of the observations used for the pa-rameterization of Cooper (1986) and the fact that the range of their measured concentrations lies within a factor of 10 as they noted.
In contrast, the sampling conditions for the determination of the Young et al. (2017) parameterization are more similar to the present work; they used measurements in Arctic MPCs over the Greenland Sea. The dataset was collected during spring and summer, above open sea, ice sheet and transitions. This variability in the seasons and surface conditions may ex-plain the differences observed compared to the present work. Above all, Young et al. (2017) displayed an averaged concen-tration, whereas the maximum ice number is presented here. However, even by taking the averaged ice concentrations in the present work, the parameterization does not match with that of Young et al. (2017) (not shown here). Finally, the de-tailed time series displayed in the Young et al. (2016) and Lloyd et al. (2015) works which present the cases used for the determination of the parameterization of Young et al. (2017) showed that the maximum ice number concentrations fre-quently displayed values between 1 and 5 L−1, which is in the range of the present parameterization.
Our results could not be compared to more sophisticated parameterizations accounting for supersaturation and aerosol properties (such as (DeMott et al., 2011) since additional data are needed (aerosol and CCN/IN measurements, humidity).
Figure 9. Maximum ice crystal concentration as a function of cloud top temperature. The colored circles represent the values for each profile (with fitting in the black solid line and mean absolute error in dotted lines). The Meyers et al. (1992), Cooper (1986) and Young et al. (2017) parameterizations are also displayed in purple, orange and brown dashed lines, respectively.
These additional data are also necessary to discuss the pro-cesses such as the secondary ice production propro-cesses which could explain the higher crystal numbers observed in the present study compared to the other works presented in this section.
4.3 Liquid water fraction
The MPC liquid fraction can be determined based on the sep-arate liquid and ice properties presented in Sect. 3. The liquid water fraction (hereafter LWF) is defined as the ratio of LWC over the TWC (IWC plus LWC) at each altitude level.
To our knowledge, very few previous studies have assessed the liquid water fraction in MPCs. Most of them were con-cerned with MPCs only in western Arctic regions (de Boer et al., 2009; McFarquhar et al., 2007; Shupe et al., 2006).
Figure 10a displays the liquid fraction according to the normalized altitude Zn. For purpose of comparison, the
parameterization from McFarquhar et al. (2007) (hereafter MF07) determined from in situ measurements during M-PACE is also represented in Fig. 10a by the black dotted curve. Our relationship (Eq. 7) significantly deviates from that of MF07.
LWF = 28.4Zn+54.9 with LWF in % (7)
They used in situ measurements from 53 profiles in single-layer MPCs sampled over Alaska with temperatures ranging from −3 to −17◦C. As mentioned in Sect. 3, they observed similar ice crystal number concentrations but ice crystals were smaller, with mean effective diameters around 50 µm compared to 100 µm in our study.
Figure 10b shows the liquid fraction according to cloud top temperature. Each point represents the mean value of the liquid fraction determined for each profile. The error bars
corresponding to the standard deviation display large values around 80 %, which is indicative of a large variability. Nev-ertheless, Fig. 10b shows that LWF is well correlated with the cloud top temperature (Eq. 8). The decrease in LWF as-sociated with a decrease of temperature is consistent with Fig. 9 which shows that ice number concentration increases for colder temperatures.
LWF = 2.97Ttop+121.20 with LWF in % and Ttopin◦C (8)
The liquid fraction is also determined at each cloud level as a function of the temperature in Fig. 10c (with 1◦C tempera-ture interval). The same trend as in Fig. 10a is observed. The liquid water fraction increases with decreasing temperature. The relationship between LWF and T is nearly linear with similar slopes for the three regimes (Eq. 9a, b and c for the COLD, WARM_NO and WARM_SO regimes, respectively): LWF = −3.02 T + 3.95 (9a) LWF = −3.48 T + 47.60 (9b) LWF = −1.70 T + 76.16, (9c) with LWF in % and T in◦C.
However, large shifts are observed from one regime to an-other, especially when comparing the COLD regime to the WARM_NO and the WARM_SO. This shift is clearly linked to the temperature profiles (see Fig. 3). However, one can note that the results for the WARM_NO regime are the ones in the closest agreement with the MF07 parameterization.
In order to compare our results to those of Shupe et al. (2006), we also determined the total liquid water fraction (LWFtotal)in terms of water paths (LWP/TWP). Figure 10d
shows a rather good agreement between the two water path ratios, showing that IWP dominates in the coldest clouds
Figure 10. Liquid water fraction according to Zn(a), cloud top temperature (b) and temperature (c). The dotted dashed line in panels (a) and
(c) is the parameterization from McFarquhar et al. (2007) and the solid lines in panels (a), (b) and (c) are the fittings for the present study. (d) Ratio of LWP over total water path (TWP) according to cloud top temperature. The solid line refers to the present study and the dotted line refers to Shupe et al. (2006).
(Ttoparound −20◦C on average). On the contrary, LWFtotal
is more important in the warmer MPCs (Ttopabove −15◦C).
However, such liquid fraction determination must be taken with care since it integrates the ice region below the clouds (de Boer et al., 2009).
5 Conclusions and outlook
In this study, a characterization of Arctic boundary-layer mixed-phase clouds microphysical properties has been per-formed. In situ data from four airborne campaigns over the Greenland Sea and the Svalbard region are compiled and an-alyzed. The dataset represents in total 18 flights and 71 ver-tical profiles in MPCs (more than 350 min of cloud in situ observations). Cloud phase discrimination is achieved and vertical profiles of the number, size, mass and shape of ice crystals and liquid droplets within MPCs are determined.
The main conclusions of the present work are summarized as follows:
i. Liquid phase is mainly present in the upper part of the MPCs with high concentration of small droplets (Nw∼120 cm−3, Deff,w ∼15 µm) and averaged LWC
around 0.2 g m−3. Ice crystals are present everywhere
in the MPCs with no significant vertical variability (Ni∼3 L−1, Deff,i∼100 µm, IWC ∼ 0.025 g m−3), but
mainly in the lower part, and precipitate down to the surface. The morphology study of ice crystal images showed that irregular and rimed particles prevail over stellar and plate habits.
ii. The vertical profiles of the microphysical properties and the shape distribution can also be used to pro-vide insight on the microphysical processes occurring in MPCs. It is likely that adiabatic lifting (condensa-tion) is the main process for liquid droplet initiation and growth, and that evaporation at cloud top due to entrainment of dry air seems to occur. In the cloud layer, where liquid droplets and ice crystals coexist, the Wegener–Bergeron–Findeisen and riming processes are the main mechanisms involved in the ice crystal growth. The large occurrence of irregular particles highlights the fact that the ice crystals undergo a variety of growth pro-cesses, and the turbulence in the MPC life cycle is effi-cient for mixing the cloud.