O
pen
A
rchive
T
OULOUSE
A
rchive
O
uverte (
OATAO
)
OATAO is an open access repository that collects the work of Toulouse researchers and
makes it freely available over the web where possible.
This is an author-deposited version published in :
http://oatao.univ-toulouse.fr/
Eprints ID : 10083
To link to this article : DOI:10.1016/j.jfluidstructs.2011.03.008
URL :
http://dx.doi.org/10.1016/j.jfluidstructs.2011.03.008
To cite this version : Bourguet, Rémi and Karniadakis, George E. and Triantafyllou, Michael
S. Lock-in of the vortex-induced vibrations of a long tensioned beam in shear flow. (2011) Journal of
Fluids and Structures, vol. 27 . pp. 838-847. ISSN 0889-9746
Any correspondance concerning this service should be sent to the repository
administrator:
[email protected]
Lock-in of the vortex-induced vibrations of a long tensioned bearn
in shear flow
Rémi Bourguet
a·*,George E. Karniadakis
b,Michael S. Triantafyllou a
• Department of Mechanical Engineering, Massachusetts Institute ofTechnology, Cambridge, MA 02139, USA b Division of Applied Mathematics, Brown University, Providence, RI 02912, USA
Keywords:
Vortex-induced vibrations Lock-in
Tensioned bearn Shear flow
Direct numerical simulation
1. Introduction
ABSTRACT
The occurrence of lock-in, defined as the local synchronization between the vortex shedding frequency and the cross-flow structural vibration frequency, is investigated in the case of a tensioned bearn of length to diameter ratio 200, free to move in both the in-line and cross-flow directions, and immersed in a linear shear current. Direct numerical simulation is employed at three Reynolds numbers, from 110 to 1100, so as to include the transition to turbulence in the wake. The Reynolds number influences the response amplitudes, but in ali cases we observed similar fluid-structure interac-tion mechanisms, resulting in high-wavenumber vortex-induced vibrainterac-tions consisting of a mixture of standing and traveling wave patterns.
Lock-in occurs in the high oncoming velocity region, over at !east 30% of the cylinder length. In the case of multi-frequency response, at any given spanwise location Jock-in is principally established at one of the excited vibration frequencies, usually the locally predominant one. The spanwise patterns of the force and added mass coefficients exhibit different behaviors within the lock-in versus the non-lock-in region. The spanwise zones where the flow provides energy to excite the structural vibrations are located mainly within the lock-in region, while the flow damps the structural vibrations in the non-lock-in region.
Long tensioned bearns subject to vortex-induced vibrations (VIV) within a shear flow are encountered in a number of important applications, while they serve as a paradigm of a distributed flow-structure interaction problem. In the context of ocean engineering, the relia ble estimation of the fatigue damage of risers and mooring lines placed within sheared ocean currents requires detailed understanding and efficient prediction of these self-excited oscillations.
The problems of a rigid circular cylinder free to move or forced to oscillate in the cross-flow direction, in uniform current, have contributed to elucidate sorne fondamental VIV mechanisms (Bearman, 1984; Sarpkaya, 2004; Williamson and Govardhan, 2004). Large amplitude oscillations occur when the vortex shedding and the structural vibration frequencies coïncide, a condition referred to as 'lock-in'. The lock-in condition can occur over a range of oncoming flow velocities and the vortex shedding frequency can be driven relatively far from the Strouhal frequency, which results from the von Karman instability behind a stationary cylinder; this phenomenon of frequency entrainment is described as 'wake capture'.
The case of long flexible cylinders has attracted less attention, especially for beams in sheared currents. Peltzer and Rooney (1985) studied the wake of a cable forced to oscillate in the cross-flow direction within a linearly sheared flow.
* Corresponding author.
As in the case of an oscillating rigid cylinder (Stansby, 1976), the wake exhibits a large spanwise cell of constant vortex shedding frequency, equal to the structural vibration frequency; the celllength in creas es with the amplitude of vibration. Thus, the vibration disrupts the cellular pattern observed in the wake of stationary cylinders in shear flow (or tapered cylinders in uniform flow), which is composed of smaller, regularly spaced cells {Peltzer and Rooney, 1985). Field and laboratory experiments on long flexible cylinders free to oscillate in sheared currents highlighted the mixed standing-traveling wave nature of the vibrations, involving high structural wavenumbers and, often, multiple frequendes of response (e.g. Trim et al., 2005; Lie and Kaasen, 2006; Vandiver et al., 2009). These studies have focused on an analysis of the structural response, but did not provide information concerning the occurrence of the Jock-in condition. Huera-Huarte and Bearman (2009) perfonned laboratory experiments on a flexible cylinder in a stepped current and reported much larger drag coefficients than in the case of a stationary cylinder.
Few numerical studies have been carried out in this context. Meneghini et al. (2004) and Yamamoto et al. (2004)
quantified the response envelopes of long flexible cylinders in shear flows by using an hydrodynamic madel based on a series of two-dimensional strips. On the basis of direct numerical simulations, Newman and Karniadakis ( 1997) reported mixed standing-traveling wave response in the case of a flexible cylinder of aspect ratio 100, allowed to osdllate in the cross-flow direction, under the effect of a shear oncoming flow with a maximum Reynolds number of 100. Lucor et al. (2001, 2006) considered flexible cylinders of aspect ratio larger than 500, also allowed to osdllate only in the cross-flow direction, within a shear flow at Reynolds number 1000, using law-resolution direct numerical simulations. ln linear shear flow, Lucor et al. (2001) reported a region oflock-in located in the high velocity zone but did not correlate this observation to the energy exchanges between the flow and the structure.
As a consequence, the phenomenon of lock-in needs further investigation, especially for a flexible cylinder free to move in bath the in-line and cross-flow directions. In the present work, direct numerical simulation is employed to predict the VIV of a long tensioned bearn of aspect ratio 200, immersed in a linear shear flow, in the range of Reynolds numbers 110-1100. The objective is to provide a detailed characterization of the Jock-in phenomenon and to analyze its impact on the fluid forces and on the main features of the fluid-structure energy transfer.
The physical madel and the numerical method are presented in Section 2. The vibrations of the tensioned bearn are quantified in Section 3. The phenomenon oflock-in is studied in Section 4 and its influence on the fluid forces in Section 5.
:Z. Model and numerical method
The flow past a flexible cylinder of circular cross-section is predicted using direct numerical simulation of the three-dimensional incompressible Navier-Stokes equations. The cylinder is submitted to an oncoming flow which is parallel to the global " axis and linearly sheared along the global
z
axis, as illustrated in Fig. 1(a). ln the following, ali physical variables are non-dimensionalized using the cylinder diameter D and the maximum inflow velocity U, which occurs at z=O. The ratio between maximum and minimum inflow velocity is equal to 3.67. The Reynolds number (Re) is based on D and the inflow velocity. Three Re ranges are considered: Re e [30,110], Re e [90,330] and Re e [300,1100]. The three corresponding simulations are denoted by the maximum Reynolds number Rem.The cylinder aspect ratio is L/D=200, where Lis the cylinder length in its equilibrium position in quiescent flow. It is pinned at bath ends, while it is free to move in both the in-line (x) and cross-flow (y) directions. The cylinder mass ratio is
(a)
-
D (b) (c} (d) 180 180...
180 Ç,-
160 160 160 Shesr 0.1-..,._
140 140 140 lnflow--...
120 120 120 0.05 100 100 ~ L ~ 1-1 ~ 80 80 80 0~
60 60 60 --0.05~
40 40 40 20 20 20 --0.1~
0 0 6 8 10 12 1 1.5 2 10 20 30 40 50 (,cd
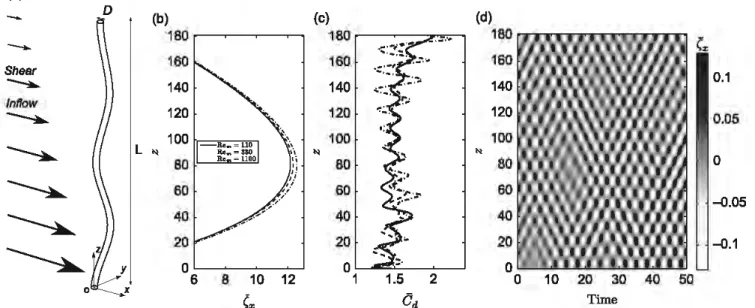
TimeFig. t. (a) Sketch of the physical configuration. (b) timESlveraged in-line displaœment. (c) time-averaged drag coefficient and (d) selected time series of
defined as m =Pel p1D2, where Pc is the cylinder mass per unit length, and Pt the fluid density. The mass ratio is set equal
to 6 in reference to jauvtis and Williamson (2004)'s work and lower values are currently under investigation. The constant tension, bending stiffness and damping of the structure are designated by T, El and K, respectively. The in-line and cross-flow dis placements of the cylinder are denoted by (x and (y. The drag and lift coefficients are denoted by Cx and Cy. The structural dynamics are governed by a tensioned bearn madel, expressed as follows in non-dimensional formulation (Evangelinos and Karniadakis, 1999):
a
2ç
2
&ç
2a-tç
Kaç
1c
(jt2 -wc (jz2 +Wb (jz4
+
m (jt= 2
m' (1)where Ç = [(x,(yf and C = [Cx,Cyf. t denotes the non-dimensional time variable. Wc and wb are the cable and bearn phase
velocities, defined as w~ = T jm and w~ = Eljm, respectively. The structural damping is set equal to zero (K=O) to allow maximum amplitude oscillations. A tensioned bearn is considered in this study, with Wc= 4.55 and wb = 9.09. As shawn in
Section 3, these structural parameters lead to vibrations involving high structural wavenumbers, which are representative of configurations encountered in the context of ocean engineering.
The parallelized code Nektar, based on the spectral/hp element method (Karniadakis and Sherwin, 1999), is used to solve the coupled fluid-structure system. Details regarding validation studies of the numerical method and parameters have been reported in Newman and Karniadakis (1997) and Evangelinos and Karniadakis (1999). The computational domain extends 50D downstream and 20D in front, above, and below the cylinder. A two-dimensional grid of 2175 elements with polynomial arder p=6 or 7, depending on the Reynolds number, is used in the (x,y) planes. In the z direction, 512 planes (256 complex Fourier modes) are used for the Rem= 110 case, and 1024 planes (512 complex Fourier modes) in the Rem=330 and 1100 cases. The spatial resolution is similar to Evangelinos and Karniadakis (1999)'s study for a cylinder of aspect ratio L/D=4n constrained to oscillate in the cross-flow direction, at Re=1000. The spanwise periodicity of the imposed shear velocity profile, due to Fourier expansion, is enforced in a buffer region. The buffer region inflow velocity profile is represented by a third-order polynomial that ensures continuity of the velocity profile and its slope. The size of the buffer region is chosen equal to 8% of the cylinder length (i\z= 16), in agreement with the recommendations of Lucor et al. (2006). Iwo additional simulations performed at Rem= 110 with L\z = 11 and 21 have emphasized the negligible influence of the buffer region size on the rest of the domain, as long as it remains small compared to the cylinder length. The relative difference on the maximum RMS values of the structure displacements along the span is smaller than 3% between L\z = 11 and 21 cases. The relative difference on the vibration frequencies is smaller than 0.5%. The buffer region is not shawn in the following. The results reported in this study are based on time series of more than 300 convective time units, collected after the initial transient dies out, for each Rem.
3. Structural responses
The structure exhibits an asymmetric time-averaged in-line deformation due to the oncoming shear flow, with a maximum displacement located near Z=80 (Fig. 1(b)). The Reynolds number considered in the simulation has only a small influence on this deformation. The time-averaged drag coefficient normalized by the local inflow velocity, Cd, is plotted in Fig. 1(c). The spanwise evolution of
Cd
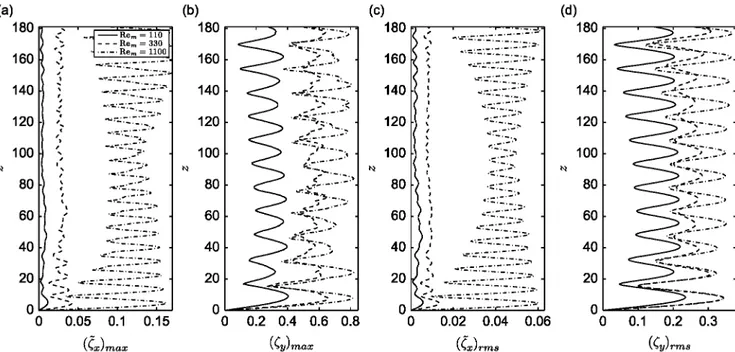
is substantially influenced by the structural motion, in particular by the cross-flow vibration pattern. A slight increase of the Cd local maxima can be noticed with increasing Rem in the region of maximum in-line displacement. Fluid forces are investigated in Section 5.In bath the in-line and cross-flow directions, the structural response is a combination of standing and traveling wave patterns, as illustrated in Fig. 1(d) by the spatio-temporal evolution of the in-line displacement fluctuation, over a selected time interval, for Rem= 1100. Maximum and RMS values of the vibration amplitudes reflect the mixed nature of the responses (Fig. 2). In these plots and in the following, only the deviations of the in-line motion from its mean value,
êx.
are considered. The standing character of the responses leads to the formation of cells along the span corresponding to alternating 'nades' (minima of the response envelope) and 'anti-nodes' (maxima of the response envelope). Despite the shear flow, the displacements associated with anti-nodes remain relatively constant along the cylinder span. The standing character of the response is more pronounced near the ends. The RMS values of the displacements associated with nades are different from zero, which emphasizes the modulation of the standing wave patterns by superimposed traveling wave components. The Rem influence on response amplitudes is more pronounced in the in-line direction. The amplitudes of vibration reached at Rem= 1100 are similar to experimental measurements carried out with flexible cylinders at higher Reynolds numbers (Trim et al., 2005; Lie and Kaasen, 2006; Huera-Huarte and Bearman, 2009). The variability of the spanwise distance between the successive maxima (anti-nodes) of the cross-flow displacement RMS values illustrates the deviation of the actual standing wave components from sine Fourier modes, defined by sin(nnzD/L), for the nth mode.Spanwise distributions of the temporal power spectra of the in-line
Cêx)
and cross-flow ((y) vibrations are plotted in Fig. 3. The power spectral densities (PSD) are normalized at each spanwise location by the corresponding displacement variance.Responses at a single frequency as weil as responses at several frequencies can be observed along the span. These two types of response are referred to as 'mono-frequency' and 'multi-frequency', respectively. In the case of multi-frequency response, as, for instance, in the in-line direction at Rem=330, it can be noticed that the peaks are clearly defined and
(a) 180 '
.
';. ' 160.
' ' ' 1 140 ' ', ' 120 '.
.
' 1 100 ' ' ' 1 ~ ' ' 80.
' ' ' ' 60 1 ' .!-·~ ---Rem= 330 Rem llOJ
' ·-·-·Rem= 1100 ... -...: .-..: .-_:-.-'-... ..:.~.:.-·-~:_-::_-::..-:· ·-··.:.·: ~ ~-. ._-. :.."': :_-. .... ~·::.·.~· ·~.·:.·:. _:::-..::--~:-...
-
... .... -::.·.:.·---'-... ~ --~.:.~~;~ ·~.:..":"'.:.,_ -·-·-:.-·-...
-_·.-=~=:· :~;~~~-> .... :.· ... -.·~ ...:-: :.:.:.::-... -:.:.:.::• ·~,'=·-~-::...-::..-::...-. -·.·:.: .-... · .-_ ::::::.::-. 160 140 120 100 80 60 40 20 0.2 0.4 0.6 0.8 ((y)max (c) 180 160 140 120 100 ~ 80 60 ' ) ~' ' ' ' 1 ' ):
1 ·( ,' (d) 180 ...-
-
-160----.
140 _ ... 120 100 ~ 80 60 40 20 0.1 0.2 0.3 ((y)rmsFig. 2. (a,b) Maximum and (c,d) RMS values of the (a,c) in-line displacement fluctuation and (b,d) cross-flow displacement, along the cylinder span. distinct from each other, despite a narrow-band vibration, in the range of [0.26,0.35]. The ratio between the in-line and cross-flow excited frequencies is generally close to 2, including the multi-frequency cases.
The excited frequencies exhibit spectral peaks along the entire span. In both the in-line and cross-flow directions, these peaks form spanwise cellular patterns that can be related to the excitation of specifie structural wavenumbers. A spatio-temporal spectral analysis based on a two-dimensional fast Fourier transform of the structural responses (not presented here) shows that wavenumbers in the ranges [0.055,0.063] and [0.033,0.038] are excited in the in-line and cross-flow directions, respectively. For illustration purposes, these excited wavenumbers can be loosely associated with the corresponding sine Fourier modes; nE {22,23,24,25} in the in-line direction and nE {13, 14, 15} in the cross-flow direction. The natural frequency associated with the wavenumber k can be evaluated as follows:
I"Ilat(k)=
~k
fw2+4n2w2k2J
v
m+~Cm V c b ' (2)where Cm is the added mass coefficient induced by the fluid. The natural frequencies corresponding to the above mentioned modes, with Cm= 1, are indicated in Fig. 3 by vertical dashed lines. The actual responses exhibit substantial deviations from
rat,
especially in the in-line direction.4. Lock-in phenomenon
In the case of flexibly mounted rigid cylinders in uniform flow, the phenomenon of lock-in consists of self-excited, vortex-induced vibrations accompanied by the synchronization of the frequency of vortex formation with the frequency of cylinder vibration. The lock-in phenomenon has been extensively investigated in this context (Bearman, 1984; Sarpkaya, 2004; Williamson and Govardhan, 2004).
In the context of long flexible cylinders in shear flow, the lock-in condition can be defined locally; at each spanwise location, the lock-in condition is established when the local vortex shedding frequency coincides with the local cross-flow vibration frequency. In the absence of such synchronization, the condition is referred to as non-lock-in. The spanwise region which includes ail the locally locked-in locations is referred to as the lock-in region and the rest of the span as the non-lock-in region.
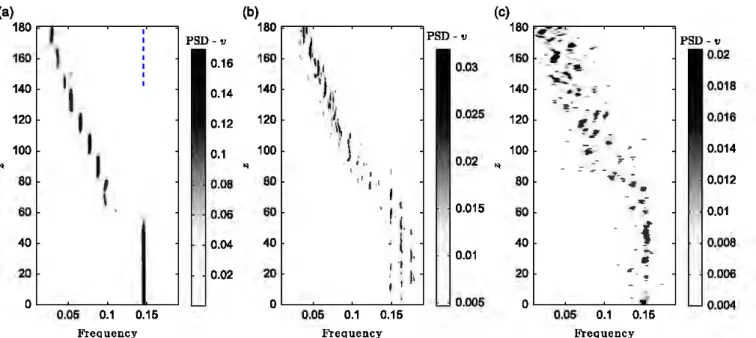
The vortex shedding frequency is quantified from the cross-flow component of the flow velocity, v, along a spanwise line located downstream of the cylinder at (x,y)=(20,0). The PSD of the v velocity component is plotted along the span for the three Rem in Fig. 4. The predominant cross-flow vibration frequencies determined in Fig. 3 are indicated by vertical dashed lines.
In ail cases, a region oflock-in can be identified in the high oncoming flow velocity zone, near Z=O. The rest of the span corresponds to a non-lock-in region, where the vortex shedding and the structural vibrations are not synchronized. The lock-in region covers 59D, 75D and 77D at Rem= 110, 330 and 1100, respectively. The case of Rem=330 exhibits lock-in at ail three distinct frequencies identified in the multi-frequency structural response. Despite sorne secondary contributions, it can be observed that, at each spanwise location, the vortex shedding is mainly synchronized with a single frequency, which can be different for each location. In addition, a comparison of the cross-flow vibration and flow velocity spectra
(a) 180~~~~~--~~ 160 140 120 100
:
.
:
.
:
•
•
•
'
80 , 60 40 201
0 0.26 0.28 0.3 0.32 0.34 Frequency (d) 180 160I
l
140 1 120 100""
80 60 40 20 0 0.12 0.14 0.16 0.18 Frequency PSD-(z 0.12 0.1 0.08 0.06 0.04 0.02 0 PSD- (11 0.16 0.14 0.12 0.1 0.08 0.06 0.04 0.02 (b) 180,
,
'
•
• 1 •• 160 1•
.
..
,
,
'
.
.
140 fi 1' 1 • ' 1• '1 • • 1 120 1• 1 1 • 1 ••'
100 1 ' • :~
; • 1""
80•
•
" 1• ••
•
60 1; ' ,,'
•• f
40.
.
•
• 1 ,ltl
'
•
.
t
1 20 1 •• ' 1 ,, •1
.
1 0 0.26 0.28 0.3 0.32 0.34 Frequency (e) 180 160 140 120 100""
80 60 40 20 '1
'11
'
'
•
'
'
•
1
'
t
•
1
t
1'
•
1'
1'
•
1•
1
t•
'
1
t•
1
1
'
1
.
1
1 0 0.12 0.14 0.16 0.18 Frequency (c) PSD-(z 180•
•
PSD-(z 0.016 160•
0.12 140•
0.014•
0.1 120•
•
0.012·
•
0.08 100•
~•
0.01 80•
0.06•
0.008 60 0.04 0.006 40•
20 0.02 0.004"
•i
0 0.26 0.28 0.3 0.32 0.34 Frequency (f) PSD-Cy 180 PSD- (11 0.1 1601
0.1 0.09 1401
0.09 0.081
0.08 120l
'
0.07 0.07 0.06..
100l
'
0.06 11 ~ 0.05 80 0.05 0.04 60.
,
,
0.04 1 . . 0.03 0.03 40i
f
0.021
0.02 0.01 20 0.01 0 0 0 0.12 0.14 0.16 0.18 FrequencyFJg. 3. PSD of structwal responses along the cylinder span: (a-<) in-line displaœment fluctuation and (d-f) cross-flow displaœment at (a,d) Rem= 110, (b.e) Rem=330, (c.f) Rem=1100. Selected nanna! frequencies of the sttucture are indicated by vertical dashed !ines.
(Figs. 3(e) and 4(b)) shows that the locally predominant vibration frequency is preferred by the coupled fluid-structure system when establishing the Lock-in condition. At Rem= 1100, the spanwise evolution of the predominant frequency of v
is more irregular than in other cases, due to the absence of stable wake patterns in several spanwise regions. These zones form 'hales' in the Jock-in spanwise pattern.
The spectral amplitude of the cross-flow response at the local lock-in frequency is plotted in Fig. 5 as a function of the local vibration frequency, normalized by the local Strouhal frequency. The local vibration frequency is defined as
f,=JUJU,, wherefis the local frequency non-dimensionalized by U, the maximum oncoming flow velocity (Z=O), and U, is the local oncoming flow velocity. The local Strouhal frequency ifst) is estimated as a function of the local Reynolds number on the basis of the vortex shedding frequency past a stationary cylinder in uniform flow (Williamson, 1996; Norberg, 2003).1n the case ofmulti-frequency response (Fig. 5(b)), different symbols are used to specify which vibration frequency is the Local lock-in frequency among the three dominant frequendes identified in Fig. 3(e). On these plots are superimposed the lower and upper limits of the wake synchronization zones reported by Koopmann (1967) and Cheng and Moretti (1991) for forced cross-flow osdllations of a rigid cylinder in uniform flow at Re e {100,200,300} and Re= 1500, respectively.
linder the lock-in condition, the vortex shedding frequency exhibits large deviations from the Strouhal frequency. In the present case of a freely vibrating flexible cylinder in shear flow, the combinations of amplitudes and frequencies observed under the lock-in condition remain within the wake capture region established from forced vibrations, for the
(a) (b) (c) 180
'
,
PSD- v 180·
~
l't
PSD-v 180 ~=·~~ ::--- PSD-v --
-160 0.16 160 160 -) '"-
0.02~
'
0.03-
--
-
..
~l'
'')
~ 0.018 1401
0.14 140.
~)'
140 ~~ ·:~: -l t -120',
120 ··~ 0.025 120 -~,, 0.018 0.12 .~
~
~
·
' -,
-- !'.Jt L-
-
0.014 100 0.1 100 100 +.: -~1
~ ,,, 0.02 ~-
-
F'"=" 1 1 - .--Y-;_ -80(
0.08 80 ,, 1 1 80 ~- 0.012.
·
'
(-
t 0.015 .. - 0.01 60 0.06 60-"1
60 ~ -·
t
40 0.04 40'
t'
1 40 0.008 1 '1 1• 0.01 -.
.
~ 20 0.02 20. '
I
l
20 ~ 0.006 1 r J 0 0 0.005 0 0.004 0.05 0.1 0.15 0.05 0.1 0.15 0.05 0.1 0.15Frequency Frequency Frequency
Fig. 4. PSD of the temporal evolution of the cross-flow component offlowvelocity along a spanwise line at {X.Y)=(20,0) at (a) Rem=110, (b) Rem=330, (c) Rem=1100. Vertical dashed !ines indicate frequencies identified in Fig. 3.
(a) (b) (c) 0.4 1 0.4 1 0.4 1 ' , o
a~
..
1 \..
f \..
1 v 0.35 f \ .._,. 0.35 f \ v 0.35 oo(/> r 1 <il 0 \ \ \ 0 0 0 \1 \
{ \ •~oo: \ ~ 0.3 ~ 0.3: t
~
\ft\
~ 0.3 "tl "tl "tl oCbo<f 0 ~ :;! \ aDA
ft
•ft
:;! 1 0 \ :;! 1 \ :::: 0.25 \ ·, 0~ 0 D :::: 0.25\
l~~. ogg\i :::: 0.25 1 \ e og0o \"a 1 0o 0 Cl f "a "a
' )8~1f o o 1 {
'
\ o0o0 o o~i \'~!
1~"
"
1 l i 8 0.2 \ o0g0 o oo1; 8 0.2 8 0.2 1 1to o
li.,
\ 0 00 gg gg ~.,
'
,,
~
'>li
~
.,
\ Di._ oO D O ~ Gl 0.15 Gl 0.15'~l
'
Gl 0.15 \ 1 o"':?0 ~ o ,, \ \ 0 oO oO,_.r
1 \' o._ ac /...
\. · 0 cfJ 00 11...
...
' , 0oo,o ~ § ji..
", \o rPÏ
.~1..
'.
\ ·(..
,
,
(,) 0.1 <.J 0.1 \. K \ .If <.l 0.1 . . 0~ ·1 ~ ' Qi
j ~ ' • \ A 0 _f ~ ~\10o f"'
' , o\ 'r"'
... ~ ·~ 0 _~;"'
·''l'Il 0.05 '\,. .'t l'Il 0.05
.
l'Il 0.05,
,
'· .'1.
0 0 0
0.4 0.6 0.8 1 1.2 1.4 0.4 0.6 0.8 1.2 1.4 0.4 0.6 0.8 1.2 1.4
/!!I.e Ml8t /!/lat
Ftg. 5. Spectral amplitude of the cross-flow displaœment under the Jock-in condition as a function of the local vibration frequency normalized by the Strouhal frequency, at{a) Rem=110. {b) Rem=330, {c) Rem= 1100. In (b~ different symbols are used to identifythe gl.oballock-in frequency at the corresponding location point, among the three possible cnes: (0)/=0.149, (x )!=0.162. (.ô.)f=0.174.lhe lower and upper limits ofwalœ capture region reported by Koopmann (1967)
and Cheng and Moretti (1991~ obtiôned for forœd osdllations, are indicated by dotted and dashed !ines, respectively.
corresponding Reynolds number. At Rem= 1100 and to a lesser extent Rem =330, the frequencies of Jock-in slant towards lower frequencies (f,<fsr. ), as previously noted by Cheng and Moretti (1991) for forced oscillations. At Rem=330, the multi-frequency nature of the response does not lead to a partitioning of the synchronization domain in three distinct zones. lnstead, the three global frequencies of vibration overlap over most of the domain.
5. Fluld forces
The fluid forces exerted on the cylinder are representative of non-linear equilibrium states reached by the coupled fluid-structure system and can be used to identify the properties of the fluid-structure energy transfer. The maximum and RMS values of the drag and lift coefficients along the cylinder span are shown in Fig. 6. The fluid forces include both the pressure and viscous components and are normalized by the local oncoming flow velocity. They are denoted by Cd and C1, to avoid confusion with Cx and Cy. which are normalized by the maximum velocity. The force coefficients reach very high magnitudes in the non-lock-in region, compared to the case of a stationary cylinder, reported for example in Persillon and Braza (1998) and Norberg (2003). Despite the influence of Rem on the force coefficient amplitudes, the three Reynolds number cases present comparable spanwise trends.
Spanwise distribution of the temporal power spectra of the drag and lift coefficients are presented in Fig. 7. These plots show that the frequencies at which the fluid forces are exerted on the structure mainly coïncide with the predominant vibration frequencies, indicated by vertical dashed lines. Sorne peaks also appear at secondacy vibration frequencies, as for
(a) (b) (c) (d) 180 ~ ,' ~~·-·-·-·-:::::.· 180
...
..,~.:· ... 180 160?
,~:·~·~·::·
160·::;:~.~:~
160 ' ;. ,...
.
..
140 c.
' ·~·-·.,
140 ... ·-~"' 140 ., ···~-~ *-"7,.
...
,-
-120.
,,
,. '· 120 ""~ ... ~...
120 ,....
180 160 140 120 'Ill· •• -~· 100·
...
·y· ~ 100 ~~ 100 1 Rem 110 JI ... t ~ .......
Rem= 330 N••
~ Rem= 1100 ...
80 ~. 80 ~· •;. 80 •;'...
~
60"
.~...
...
60 ! 60 ~ ~-tf r 40r·
..
...
40 , ~ 40 {:"·
,. ,.
20<<
i·-
20 c'-~ ') 20 '}. ...~, 0 ~-'-0,,.
0 100 ~ 80 60 40 20 0 0 5 10 15 0 5 10 15 1 0 2 4 6 8 (Cd) max (Cl) max (Cz)rmsFig. 6. (a,b) Maximum and (c,d) RMS values of the (a,c) drag and (b,d) lift coefficients along the cylinder span.
instance in the in-line direction at Rem=330 (Fig. 7(b)). The spanwise modulation of the power spectra by the standing component of the vibrations is clearly visible. At Rem=330 and 1100, the regular spanwise distribution of the frequency peaks is considerably altered in the lock-in region.
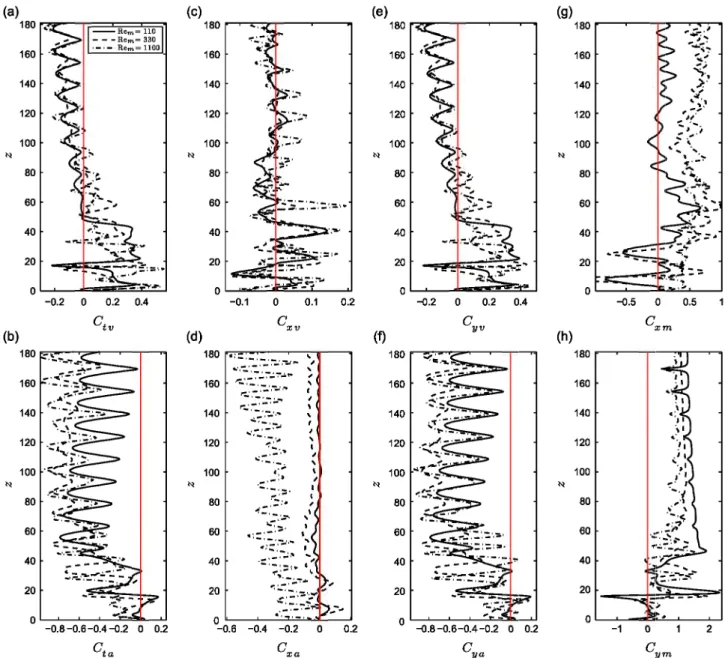
The time-averaged total (Ctv). drag (Cxv) and lift (Cyv) force coefficients in phase with the cylinder velocity, and total (Cta). drag (Cxa) and lift (Cya) force coefficients in phase with the cylinder acceleration, are defined as follows:
Ctv
= .J2<èxCx+CyCy),
V
<C~+t~>
(3a)C _ .J2<èxCx+Cyëy)
ta-
V<C~+ë~>
•(3b)
where
< · )
denotes the time-averaging operator andfJ
the fluctuating component of p. The spanwise evolution of these coefficients are plotted in Fig. 8, for the three Rem studied. The force coefficients in phase with the cylinder velocity are used to identify the fluid-structure energy transfer in a similar way as used in Newman and Karniadakis (1997) and Dahl et al. (2010). These coefficients quantify the power developed by the fluid acting on the vibrating cylinder, including bath the in-line and cross-flow directions (Ctv) or each direction separately (Cxv and Cyv). The drag and lift coefficients are normalized by the maximum oncoming flow velocity U (z=O) so that the force coefficients in phase with velocity are representative of the relative contribution of each spanwise location to the overall energy transfer. Positive values of these coefficients imply that the fluid supplies, on average, energy to the structure and hence excites the cylinder vibration, while negative values indicate that the fluid is damping the cylinder motion.For the three Rem studied, positive values of Ctv are principally located in the lock-in region, within the high velocity zone. In the non-lock-in region, Ctv remains generally negative. Cyv exhibits a very similar spanwise pattern. As in the cross-flow direction, the principal excitation zone in the in-line direction corresponds to the lock-in region. However, a secondary zone of positive energy transfer of smaller magnitude can be identified in the non-lock-in region. A comparison with the spanwise evolution of the vortex shedding frequency (Fig. 4) shows that this secondary excitation zone occurs in the region where the cross-flow vibration frequency is approximately equal to twice the frequency of vortex shedding. However, it should be mentioned that the secondary lock-in phenomenon, i.e. at half the vibration frequency, reported by Stansby (1976) for a rigid cylinder, does not appear in the present case; well-defined secondary lock-in cells are not observed. The secondary zone of positive Cxv appears to be caused by the proximity of the vortex shedding frequency with a submultiple of the vibration frequency. An analysis of the vortex shedding pattern (not presented here) shows that 25-like modes, with two counter-rotating vortices shed per wake period (Williamson and Roshko, 1988), dominate in the non-lock-in region at the present Rem. As a consequence, the vibration excited in the cross-flow direction by the shedding of a single vortex over a cylinder oscillation cycle, will be damped during the next cycle by the shedding of a counter-rotating vortex. This mechanism can explain why Cyv remains negative when the cross-flow vibration frequency is twice
(a) (d) 180~~~~~--~
~
~~
~
PSD-Cd 160 1 0.25 140 0.2 120 100 80 60 40 201
0 L...,____.___;r;_...____._ _ _ ....___j 0.26 0.28 0.3 0.32 0.34 Frequency 180~--~r-~--~ 160 140 120 100 80 60 40 20 0'--'--_._ _ _._ _ __.___, 0.12 0.14 0.16 0.18 Frequency 0.15 0.1 0.05 0 PSD-C1 0.3 0.25 0.2 0.15 0.1 0.05 (b) (a) 180 ....----,---ro•,---,r"•-.!..--n.,r-,...--
.
...
Ps
D -cd
• ' 1 • t 160 • • •• ,, •• 0.04 140 120 100 80 60 40 20~
'
:
i
l,
1
'
1 ,; •1 ', :
;
.
;
·~
t
~
·
t 1 ' • 1 '..
'
•
'
,Y ' e f ~ ~ •~
~
.
~
J •'
'
.
,
.
•
:
l
!-
i
~
~
t • .. . f·.
,
,
,
1
,
.
l~
'~
{ ' ou____._...:...:...:...._..!...:..J 0.26 0.28 0.3 0.32 0.34 Frequency 180 I""T"""---.-..----..---.-... 0.035 0.03 0.025 0.02 0.015 0.01 0.005 ,PSD-C1 160 0.04 140 0.035 120 0.03 100 0.025 80 0.02 60 0.015 40 0.01 20 0.005 Frequency (c) (f) 180 ...-r----.---_,_--.----,---., 160 140 120 100 80 60 40 20-
....
.
... 1
...
.
.
.
-·
...
.
-·
-
...
·
.
....
•
...-.
.
...
.
•
•
•
•
..
0 ~....o..,___,_ _ _ ~__._ _ _ ....___j 0.26 0.28 0.3 0.32 0.34 Frequency 180 I""T"""---.--~--... 160 140 120 100 80 60 40 20•
-•
....
0'-'----'----'----'---' 0.12 0.14 0.16 0.18 Frequency 0.12 0.1 0.08 0.06 0.04 0.02 PSD-C1 0.16 0.14 0.12 0.1 0.08 0.06 0.04 0.02Fig. 7. PSD offluid rorce coefficients along the cylinder span: (a-c) drag and (d-f) lift coefficients at (a,d) Rem=110, (b,e) Rem=330, (c,f) Rem=1100. The predominant vibration frequendes are indicated by vertical dashed llnes.
the vortex shedding frequency. The similarity of Cyv and Ctv emphasizes the very small contribution of the in-Iine component to the overall distribution of energy transfer. The vibration excitation is not uniform across the lock-in region: negative peaks and thus damping zones can occur near the minima of vibration amplitude envelope.
The time-averaged force coefficients in phase with acceleration also present a substantial spanwise variability. As previously, the cross-flow force component exhibits a spanwise distribution close to the total force coefficient. These coefficients remain negative over most of the span, except in short zones within the lock-in region, leading to negative added mass coeffidents, as shown in the following. Contrary to Cy., and Cta. the in-line component Cm exhibits significant sensitivity to Rem.
The time-averaged added mass coeffident can be quantified as follows, in the in-line and cross-flow directions: (4)
Within the non-lock-in region, the cross-flow component Cym is relatively dose to the value ofl, which is associated with an absence of dynamical effects; Cym tends further towards 1 as Rem increases. In contrast, within the Jock-in region, smaller and even negative values are reached. Despite a more pronounced influence of Rem. the in-line added mass coefficients present similar trends, except that they remain smaller than 1.
(a) (c) (e) (g) 180 180 180 180 .-~: 160 160 160 160 ..-~~ ,, "'·
'?.
140 140 140 140 ):·' '" --~·_, 120 120 120 120 , , I l ·~ ... _.,.. 100 100 100 100 , ~~,.1 •. N N N N ·~ ' ... ~....
-·
80 80 80 80 c.f.. --~'!:. 60 60 60 60..
\.-: ... ·~-40 40 ... 40 40 20 20 20 20 0 0 0 0 -0.2 0 0.2 0.4 -0.1 0 0.1 0.2 -0.2 0 0.2 0.4 -0.5 0 0.5 ct v cxv cyv cxm (b) (d) (f) (h) 180 180·:~~~~-
'
~ 180 180 ' " 160 160'
160 160 f'
140 140'
140 ' 140..
";~~~:
( 1 120 120 ' 120 120~~~~~~
1'
'
100 100 __ .::a ·' \ 100 100'
N N N-·-·=·
1 N 80 80·=:·
" 80 80.,:~~f
,•
( 60 60•
60 60·~~
40 40 " 40 40 20 20-·:~~-:·~.,~-
~..
20 20 0 0·.~~=~~i:
P---
0 0 -0.8 -0.6 -0.4 -0.2 0 0.2 -0.6 -0.4 -0.2 0 0.2 -0.8 -0.6-0.4 -0.2 0 0.2 -1 0 2 ct aex
a cya GymFig. 8. Time-averaged (a-f) total, drag and lift force coefficients in phase with the structure velocity and acceleration, (g) in-tine and (h) cross-flow added mass coefficients, along the cylinder span.
6. Conclusions
The in-line and cross-flow vortex-induced vibrations of a long tensioned bearn immersed in a linearly sheared current have been predicted by means of direct numerical simulation, in the range of Reynolds numbers 110-1100. Des pite the influence of Rem on the displacement amplitudes, and the possibly different nature of frequency response (mono- versus multi-frequency vibrations), the main features of the structural responses and of the fluid-structure interaction mechanisms remain the same for ali three Rem cases studied. In ali cases, the structural vibrations are mixtures of standing and traveling wave patterns, and a frequency ratio of approximately 2 can be established between the excited frequencies in the in-line and cross-flow directions.
Local synchronization of the vortex shedding with the cross-flow vibration, the lock-in condition, occurs in the high velocity region over at least 30% of the cylinder length. In the case of multi-frequency response, vortex shedding exhibits synchronization with ali the vibration frequencies. However, at any given point along the cylinder length, lock-in is generally established at a single vibration frequency. Under lock-in, the vibration amplitudes are related with the local frequency in accordance with the capture region obtained from forced oscillation experiments on rigid cylinders for similar Reynolds number.
There are regular spanwise patterns of drag and lift coefficients, controlied by the standing wave patterns of the structural responses, within the non-lock-in region. In contrast, these patterns are strongly altered within the lock-in region. The flow excites the structure principally within the lock-in region, while it generaliy damps the structural vibrations in the non-lock-in region. In the in-line direction, a secondary zone of excitation of smalier magnitude has been
identified in a spanwise zone where the vortex shedding frequency is approximately half of the cross-flow vibration frequency.
The time-averaged added mass coefficients present contrasting behaviors along the cylinder span: while values relatively close to 1 are observed in the non-Jock-in region, especially in the cross-flow direction, small and even negative values are reached within the Jock-in region.
Aclmowledgments
The authors wish to acknowledge support from the BP-MIT Major Projects Programme, monitored by M. Tognarelli and P. Beynet; and the Office of Naval Research under Grants N00014-07-1-0135 and N00014-07-1-0446, monitored by T. Swean, ]r.
References
Bearman, P.W., 1984. Vortex shedding from oscillating bluff bodies. Annual Review ofFiuid Mechanics 16,195-222.
Cheng, M., Moretti, P.M., 1991. Lock-in phenomena on a single cylinder with forced transverse vibration. Flow-lnduced Vibration and Wear, ASME PVP-206, 129-133.
Dahl, J.M., Hover, P.S., Triantafyllou, M.S., Oakley, O.H., 2010. Dual resonance in vortex-induced vibrations at subcritical and supercritical Reynolds numbers. journal of Fluid Mechanics 643, 395-424.
Evangelinos, C., Karniadakis, G.E., 1999. Dynamics and flow structures in the turbulent wake of rigid and flexible cylinders subject to vortex-induced vibrations. journal of Fluid Mechanics 400, 91-124.
Huera-Huarte, P.J., Bearman, P.W., 2009. Wake structures and vortex-induced vibrations of a long flexible cylinder part 2: drag coefficients and vortex modes. journal of Fluids and Structures 25, 991-1006.
jauvtis, N., Williamson, C.H.K., 2004. The effect of two degrees of freedom on vortex-induced vibration at low mass and damping. journal of Fluid Mechanics 509, 23-62.
Karniadakis, G.E., Sherwin, S., 1999. Spectral/hp Element Methods for CFD, first ed. Oxford University Press, Oxford.
Koopmann, G.H., 1967. The vortex wakes ofvibrating cylinders at low Reynolds numbers. journal of Fluid Mechanics 28, 501-512.
Lie, H., Kaasen, K.E., 2006. Modal analysis of measurements from a large-scale VIV model test of a riser in linearly sheared flow. journal of Fluids and Structures 22, 557-575.
Lucor, D., lmas, L, Karniadakis, G.E., 2001. Vortex dislocations and force distribution of long flexible cylinders subjected to sheared flows. journal of Fluids and Structures 15, 641-650.
Lucor, D., Mukundan, H., Triantafyllou, M.S., 2006. Riser modal identification in CFD and full-scale experiments. journal of Fluids and Structures 22, 905-917.
Meneghini, J.R., Saltara, F., Fregonesi, R.A, Yamamoto, C.T., Casaprima, E., Ferrari jr., J.A, 2004. Numerical simulations of VIV on long flexible cylinders immersed in complex flow fields. European journal of Mechanics B/Fiuids 23, 51-63.
Newman, D.J., Karniadakis, G.E., 1997. A direct numerical simulation study of flow past a freely vibrating cable. journal of Fluid Mechanics 344, 95-136. Norberg, C., 2003. Fluctuating lift on a circular cylinder: review and newmeasurements. journal of Fluids and Structures 17, 57-96.
Peltzer, R.D., Rooney, D.M., 1985. Vortex shedding in a linear shear flow from a vibrating marine cable with attached bluff bodies. journal of Fluids Engineering 107, 61-66.
Persillon, H., Braza, M., 1998. Physical analysis of the transition to turbulence in the wake of a circular cylinder by three-dimensional Navier-Stokes simulation. journal of Fluid Mechanics 365, 23-88.
Sarpkaya, T., 2004. A critical review of the intrinsic nature of vortex-induced vibrations. journal of Fluids and Structures 19, 389-447.
Stansby, P.K., 1976. The locking-on of vortex shedding due to the cross-stream vibration of circular cylinders in uniform and shear flows. journal of Fluid Mechanics 74, 641-665.
Trim, A.D., Braaten, H., Lie, H., Tognarelli, M.A., 2005. Experimental investigation of vortex-induced vibration of long marine risers. journal of Fluids and Structures 21, 335-361.
Vandiver, J.K., jaiswal, V., Jhingran, V., 2009. Insights on vortex-induced, traveling waves on long risers. journal of Fluids and Structures 25, 641-653. Williamson, C.H.K., 1996. Vortex dynamics in the cylinder wake. Annual Review of Fluid Mechanics 28, 477-539.
Williamson, C.H.K., Govardhan, R., 2004. Vortex-induced vibrations. Annual Review of Fluid Mechanics 36, 413-455.
Williamson, C.H.K., Roshko, A, 1988. Vortex formation in the wake of an oscillating cylinder. journal of Fluids and Structures 2, 355-381.
Yamamoto, C.T., Meneghini,J.R., Saltara, F., Fregonesi, R.A., Ferrarijr.,J.A, 2004. Numerical simulations ofvortex-induced vibration on flexible cylinders. journal of Fluids and Structures 19, 467-489.