O
pen
A
rchive
T
OULOUSE
A
rchive
O
uverte (
OATAO
)
OATAO is an open access repository that collects the work of Toulouse researchers and
makes it freely available over the web where possible.
This is an author-deposited version published in :
http://oatao.univ-toulouse.fr/
Eprints ID : 9692
To link to this article : DOI:10.1017/jfm.2011.90
URL :
http://dx.doi.org/10.1017/jfm.2011.90
To cite this version : Bourguet, Remi and Karniadakis, George E. and
Triantafyllou, Michael S. Vortex-induced vibrations of a long flexible
cylinder in shear flow. (2011) Journal of Fluid Mechanics, vol. 677. pp.
342-382. ISSN 0022-1120.
Any correspondance concerning this service should be sent to the repository
administrator:
[email protected]
doi:10.1017/jfm.2011.90
Vortex-induced vibrations of a long flexible
cylinder in shear flow
R E M I B O U R G U E T1†, G E O R G E E. K A R N I A D A K I S2
A N D M I C H A E L S. T R I A N T A F Y L L O U1
1Department of Mechanical Engineering, Massachusetts Institute of Technology, Cambridge,
MA 02139, USA
2Division of Applied Mathematics, Brown University, Providence, RI 02912, USA
We investigate the in-line and cross-flow vortex-induced vibrations of a long cylindrical tensioned beam, with length to diameter ratio L/D = 200, placed within a linearly sheared oncoming flow, using three-dimensional direct numerical simulation. The study is conducted at three Reynolds numbers, from 110 to 1100 based on maximum velocity, so as to include the transition to turbulence in the wake. The selected tension and bending stiffness lead to high-wavenumber vibrations, similar to those encountered in long ocean structures. The resulting vortex-induced vibrations consist of a mixture of standing and travelling wave patterns in both the in-line and cross-flow directions; the travelling wave component is preferentially oriented from high to low velocity regions. The in-line and cross-flow vibrations have a frequency ratio approximately equal to 2. Lock-in, the phenomenon of self-excited vibrations accompanied by synchronization between the vortex shedding and cross-flow vibration frequencies, occurs in the high-velocity region, extending across 30 % or more of the beam length. The occurrence of lock-in disrupts the spanwise regularity of the cellular patterns observed in the wake of stationary cylinders in shear flow. The wake exhibits an oblique vortex shedding pattern, inclined in the direction of the travelling wave component of the cylinder vibrations. Vortex splittings occur between spanwise cells of constant vortex shedding frequency. The flow excites the cylinder under the lock-in condition with a preferential in-line versus cross-flow motion phase difference corresponding to counter-clockwise, figure-eight orbits; but it damps cylinder vibrations in the non-lock-in region. Both mono-frequency and multi-frequency responses may be excited. In the case of multi-frequency response and within the lock-in region, the wake can lock in to different frequencies at various spanwise locations; however, lock-in is a locally mono-frequency event, and hence the flow supplies energy to the structure mainly at the local lock-in frequency.
Key words: flow–structure interactions, vortex shedding, vortex streets
1. Introduction
Vortex-induced vibrations (VIV) of long flexible structures with bluff cross-sections are encountered in a great variety of physical problems, from the aeolian vibrations of hanging strings in air, to the vibrations of cables and risers placed within ocean
currents. The possible fatigue damage resulting from VIV on these structures and the significantly increased drag forces require a careful calculation and prediction of the responses, and often the use of vortex-suppressing devices.
The simpler problem of a finite-span circular rigid cylinder, placed within a uniform flow, allowed to vibrate in the cross-flow direction only, has become the canonical problem of flow–structure interactions. The dual problems of a flexibly mounted cylinder free to vibrate in a cross-flow, and a cylinder forced to move harmonically at a prescribed frequency and amplitude, have shed light on the principal VIV mechanisms (Bearman 1984; Sarpkaya 2004; Williamson & Govardhan 2004). Large-amplitude, self-excited oscillations of flexibly mounted cylinders are observed when the vortex shedding frequency is synchronized with the structural cross-flow vibration, a condition referred to as ‘lock-in’. Lock-in can occur over a range of oncoming flow velocities, and the vortex shedding frequency can be driven relatively far from the Strouhal frequency. The analysis of the vortex shedding pattern in the wake of oscillating rigid cylinders revealed the existence of different shedding modes associated with distinct regions of the synchronized regime (Williamson & Roshko 1988; Jauvtis & Williamson 2004; Dahl et al. 2007). These different vortex shedding modes have been related to significant changes of the fluid forces exerted on the body.
For a cylinder allowed to move in the in-line and cross-flow directions, significant differences were noted, because the shedding patterns are altered, and hence the forces and the overall response of the structure differ substantially relative to a cylinder vibrating in the cross-flow direction only (Sarpkaya 1995; Jeon & Gharib 2001; Jauvtis & Williamson 2004). In particular, the phase difference between in-line and cross-flow vibrations can have a strong influence on the regularity of the cylinder trajectory as well as on the possible occurrence of large high harmonics in the lift force (Jauvtis & Williamson 2004; Dahl et al. 2007, 2010).
For stationary long rigid cylinders, which either have a constant diameter and are placed in a sheared flow, or have a varying diameter and are placed in a uniform flow, the wake forms a cellular pattern composed of spanwise regions each with a different vortex shedding frequency (e.g. Gaster 1969, 1971; Griffin 1985; Peltzer & Rooney 1985; Noack, Ohle & Eckelmann 1991; Piccirillo & Van Atta 1993; Kappler et al. 2005). This cellular pattern is accompanied by an oblique orientation of the vortex rows, and vortex splittings between cells, similar to the vortex dislocations observed by Williamson (1992).
The investigation of the wake of rigid cylinders oscillating in the cross-flow direction in shear flow revealed the occurrence of lock-in on large spanwise cells; the cell length increased with the amplitude of vibration (Stansby 1976). For long tapered and pivoted cylinders in uniform flows, Techet, Hover & Triantafyllou (1998) and Flemming & Williamson (2005) reported the formation of a hybrid shedding mode composed of two distinct vortex shedding modes connected with a vortex split.
There are considerably fewer publications for the case of long flexible cylinders. Brika & Laneville (1993) studied a flexible cylinder in uniform flow, vibrating in its first mode in the cross-flow direction. They showed the existence of different vortex shedding modes at lock-in, similar to those observed behind rigid cylinders. Peltzer & Rooney (1985) studied the wake of a cable forced to oscillate in the cross-flow direction within a linearly sheared flow. As in the case of an oscillating rigid cylinder (Stansby 1976), increasing the amplitude of vibration induces a larger spanwise lock-in region.
Field and laboratory experiments on long flexible cylinders in sheared currents highlighted the mixed nature of the vibrations, involving high structural wavenumbers
and, often, multiple frequencies of response (e.g. Trim et al. 2005; Lie & Kaasen 2006; Jaiswal & Vandiver 2007; Vandiver, Jaiswal & Jhingran 2009). These studies have mainly focused on the quantification of the structure response but did not provide information concerning the localization and extent of the lock-in region or regarding the vortical patterns in the wake. Chaplin et al. (2005) and Huera-Huarte & Bearman (2009a) performed laboratory experiments on flexible cylinders in stepped currents. Chaplin et al. (2005) reported a range of excited wavenumbers in the in-line and cross-flow directions. For a flexible cylinder responding in its first structural mode in both the in-line and cross-flow directions, Huera-Huarte & Bearman (2009a,b) observed a well-defined synchronization between in-line and cross-flow motions at lock-in and reported much larger drag coefficients than those in the case of a stationary cylinder. Flow visualizations showed the occurrence of two distinct vortex shedding regimes depending on the vibration amplitude, as observed previously by Techet et al. (1998) and Flemming & Williamson (2005) for rigid cylinders under varying spanwise conditions.
Few numerical studies have been carried out on the VIV of flexible cylinders. Facchinetti, de Langre & Biolley (2004), Mathelin & de Langre (2005) and Violette, de Langre & Szydlowski (2007) modelled the fluid excitation by means of an empirical representation of the flow through a distribution of wake oscillators. They reported good agreement of this model with direct numerical simulation predictions. By means of direct numerical simulations, Newman & Karniadakis (1997) and Evangelinos &
Karniadakis (1999) examined the VIV of a cylinder of aspect ratio 4πin uniform flow,
at Reynolds numbers 100, 200 and 1000. These works provided a detailed analysis of the wake pattern and revealed the influence of the nature of the vibration (standing or travelling wave) on the vortical structure development. In these studies, lock-in was observed along the entire span. The influence of the Reynolds number on vibration amplitudes has been emphasized by Evangelinos & Karniadakis (1999) who showed that cross-flow motions of approximately one cylinder diameter occur at a Reynolds number of 1000, compared to 0.5–0.6 diameters at a Reynolds number of 100. Newman & Karniadakis (1997) also considered a flexible cylinder of aspect ratio 100, allowed to oscillate in the cross-flow direction, under the effect of a shear oncoming flow with a maximum Reynolds number of 100. They reported a mixed standing– travelling wave response. The case of long flexible cylinders of aspect ratio larger than 500, allowed to oscillate in the cross-flow direction only, and submitted to shear flows, has been investigated by Lucor, Imas & Karniadakis (2001) and Lucor, Mukundan & Triantafyllou (2006) at a Reynolds number of 1000 by means of low-resolution direct numerical simulations. In a linear shear flow, Lucor et al. (2001) reported a region of lock-in located in the high-velocity zone. Lucor et al. (2006) compared the cross-flow vibrations induced by linear and exponential shear flows and identified, in particular, a larger vibration bandwidth in the latter case. No analysis concerning the wake pattern and fluid–structure energy exchange was provided in this work.
Hence, when we consider long structures in shear flows, it is unclear whether the hydrodynamic data and even the insight from short-span rigid cylinders are applicable, and what new phenomena may appear. For this reason, in the present work we study the VIV of a flexible tensioned beam of aspect ratio 200, pinned at both ends and free to move in both the in-line and cross-flow directions under the effect of a linear shear flow. We employ direct numerical simulation in the range of Reynolds numbers of 110–1100. The structural parameters are chosen such that high-wavenumber vibrations similar to those observed in the laboratory and field experiments of Trim et al. (2005) and Vandiver et al. (2009), for example, are excited.
A joint analysis of the cylinder response and the vortical wake patterns is presented on the basis of high-resolution simulations.
The paper is organized as follows. The physical fluid–structure model and the
numerical method are presented in § 2. The cylinder vibrations are examined in § 3.
The mechanisms of the coupled fluid–structure system are investigated in § 4. The
main findings of the present work are summarized in§ 5.
2. Direct numerical simulation of the flow past a flexible cylinder
The three-dimensional flow past a flexible cylinder placed in sheared oncoming cross-flow is predicted using the direct numerical simulation of the incompressible Navier–Stokes equations. The cylinder has circular cross-section and is submitted to an oncoming flow which is everywhere parallel to the global x-axis and is linearly sheared along the global z-axis.
In the following, all physical variables are non-dimensionalized using the cylinder diameter D and the maximum inflow velocity U , which occurs at z = 0. The non-dimensional time variable is denoted by t. The Reynolds number (Re) is based on
Dand the inflow velocity. The flow shear parameter is defined as β = (1/Ua)∂Ul/∂z,
where Ul and Ua are the local and span-averaged non-dimensional oncoming flow
velocities. The ratio between the maximum and the minimum inflow velocities is equal to 3.67 which leads to a value of the shear parameter (β = 0.006) comparable to the experimental work of Peltzer & Rooney (1985) concerning stationary and flexible cylinders in a linear shear flow. Three Reynolds number ranges are considered: Re∈ [30, 110], Re∈ [90, 330] and Re∈ [300, 1100]; the minimum and maximum Re values are based on the minimum and maximum inflow velocities, respectively, while the three corresponding simulations are denoted by the maximum Reynolds number
Rem (Rem∈ {110, 330, 1100}).
The cylinder structure is modelled as an extensible tensioned beam; it has an aspect ratio of L/D = 200, where L is the cylinder length in its equilibrium position in quiescent flow, it is pinned at both ends, while it is free to move in both the in-line
(x) and cross-flow (y) directions. The cylinder mass ratio is defined as m = ρc/ρfD2,
where ρcis the cylinder mass per unit length, and ρf is the fluid density (Newman &
Karniadakis 1997). The actual ratio between the mass of the cylinder and the mass
of the displaced fluid is equal to 4m/π. For the simulations herein, m is set equal to 6.
The tension, bending stiffness and damping of the structure, designated by T , EI and K, respectively, are kept constant for the three simulations. The in-line and cross-flow
displacements of the cylinder are denoted by ζx and ζy, respectively. The total drag
and lift coefficients, including both pressure and viscous contributions, are denoted by
Cx and Cy, respectively. The influence of gravity is neglected. The structural dynamics
are governed by a tensioned beam model, expressed as follows in non-dimensional formulation: ∂2ζ δt2 − ω 2 c ∂2ζ δz2 + ω 2 b ∂4ζ δz4 + K m ∂ζ δt = 1 2 C m, (2.1)
where ζ = [ζx, ζy]T and C = [Cx, Cy]T. ωc and ωb are the cable and beam phase
velocities, defined by ω2
c= T /m and ω2b= EI /m, respectively. The structural damping
is set equal to zero (K = 0) to allow maximum amplitude oscillations to develop.
A tensioned beam is considered in this study with ωc= 4.55 and ωb= 9.09. As
shown in§ 3, these structural parameters lead to vibrations involving high structural
wavenumbers, which are representative of configurations encountered in the context of ocean engineering.
The coupled fluid–structure system is solved by the parallelized code Nektar, based on the spectral/hp element method (Karniadakis & Sherwin 1999). The version of the code employs a hybrid scheme with Fourier expansion in the spanwise (z) direction and Jacobi–Galerkin formulation in the (x, y) planes. A boundary-fitted coordinate formulation is used to take into account the cylinder unsteady deformation. Details regarding time integration schemes and validation studies of the numerical method and parameters have been reported in Newman & Karniadakis (1997) and Evangelinos & Karniadakis (1999), which addressed similar physical configurations. The computational domain extends 50D downstream and 20D in front, above and below the cylinder. A two-dimensional grid of 2175 elements with polynomial order p = 6 or p = 7, depending on the Reynolds number, is used in the (x, y) planes. In the z-direction, 512 planes (256 complex Fourier modes) are used for
the Rem= 110 case, and 1024 planes (512 complex Fourier modes) in the Rem= 330
and Rem= 1100 cases. This leads to a spatial resolution similar to that in the study of
Evangelinos & Karniadakis (1999) for a cylinder of aspect ratio L/D = 4πconstrained
to oscillate in the cross-flow direction, at Re = 1000. The boundary conditions have been implemented as described in Newman & Karniadakis (1997). A no-slip condition is applied on the cylinder surface. Fourier expansion implies spanwise periodicity of the flow and structural properties, and of the imposed shear velocity profile. The technique first used by Lucor (2004) is adopted here, wherein the inflow velocity profile is adjusted to enforce periodicity in a buffer region. The details and numerical tests concerning the buffer region are reported in Appendix A. The buffer region is not presented in the following. Information concerning the computational resources used is given in Appendix B.
3. In-line and cross-flow vibrations in shear flow
The cylinder VIV are quantified and analysed in this section. The investigation of the nature of structural response in shear flow is a first step leading to the identification of the principal mechanisms of the coupled fluid–structure system. An overview of
the main features of the structural response is presented in§ 3.1. A spectral analysis
is carried out in § 3.2, with an emphasis on responses involving multiple frequencies.
Finally, the synchronization between in-line and cross-flow motions is investigated
in§ 3.3.
3.1. Space–time evolutions and statistics
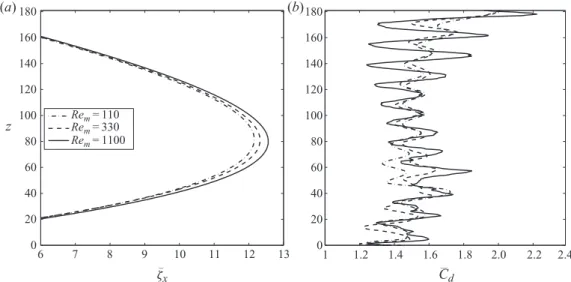
The time-averaged in-line displacement of the cylinder is presented in figure 1(a) for the three different Reynolds numbers. The shear of the oncoming flow induces an asymmetric bending of the structure with respect to the midspan point. This is also noted in experimental studies concerning a cylinder submitted to a stepped current (Chaplin et al. 2005). The maximum in-line displacement occurs at 40 % of the span and corresponds approximately to 6 % of the cylinder length. The Reynolds number considered in the simulation has only a small influence on the in-line steady displacement (3 % of relative difference on the maximum displacement between the
Rem= 110 and Rem= 1100 cases). The effect of structural in-line bending on the flow
patterns is discussed in §§ 4.1 and 4.2. The spanwise evolution of the time-averaged
drag coefficient ¯Cd is plotted in figure 1(b). In these plots, the drag coefficient
is normalized by the local inflow velocity. The time-averaged drag coefficient is influenced by structural motion, in particular by the cross-flow vibration pattern.
6 7 8 9 10 11 12 13 0 20 40 60 80 100 120 140 160 180 ζx z ReRem m ==110330 Rem =1100 (a) 1 1.2 1.4 1.6 1.8 2.0 2.2 2.4 0 20 40 60 80 100 120 140 160 180 Cd (b)
Figure 1. Time-averaged (a) in-line displacement and (b) drag coefficient, along the cylinder span.
be noticed in the region of maximum in-line displacement. Forces and fluid–structure
energy transfer are investigated in§ 4.3.
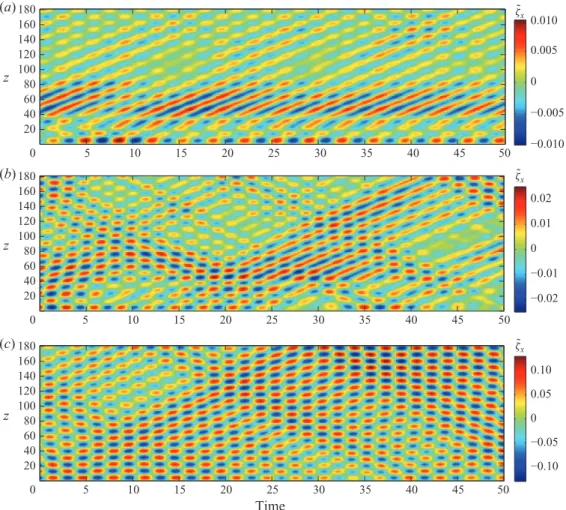
Selected time series of in-line and cross-flow motions, non-dimensionalized by D, are plotted along the cylinder span in figures 2 and 3. In these plots and in the
following, only the deviations of the in-line motion from its mean value, ˜ζx, are
shown.
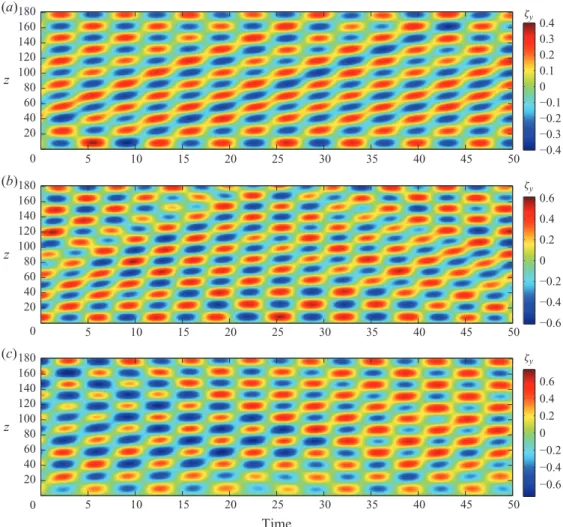
A first review of the results raises several points: in both directions, the structural response is a combination of standing and travelling wave patterns as previously reported by Lucor et al. (2006) in the case of a long flexible cylinder constrained to oscillate in the cross-flow direction. The travelling character of these waves is preferentially oriented from high- to low-velocity regions (increasing z) and is more pronounced in the in-line direction. The structural displacements are not strictly periodic and transients can occur that perturb the spatio-temporal pattern of the response. Concerning the in-line motion, standing wave patterns strongly modulate the travelling waves near the ends, especially in the high-velocity region, for 0 < z < 20
at Rem= 110, and for 0 < z < 40 at Rem= 330. Beyond these regions, distinct travelling
waves can be observed. cross-flow responses present more homogeneously mixed
standing and travelling wave patterns along the span. The case Rem= 1100 exhibits
less pronounced travelling wave patterns in both directions. These points are further investigated quantitatively in the following.
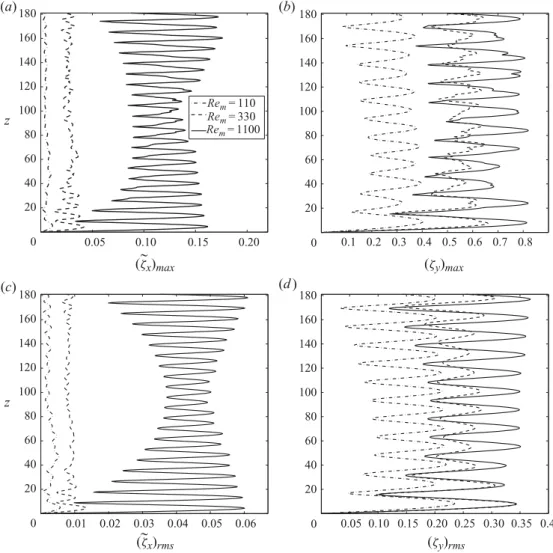
Maximum and root mean square (r.m.s.) values of the structural response amplitudes along the cylinder span are presented in figure 4. Both maximum and r.m.s. values reflect the above-mentioned standing–travelling wave patterns. The standing character of the responses leads to the formation of cells along the span corresponding to alternating ‘nodes’ (minima of the response envelope) and ‘anti-nodes’ (maxima of the response envelope). Despite the shear flow, the displacements associated with ‘anti-nodes’ remain relatively constant along the cylinder span. This partitioning of the responses in spanwise cells is modulated by the superimposed travelling wave patterns. In particular, it appears that the r.m.s. values of displacements associated with ‘nodes’ are different from zero which indicates that these ‘nodes’ are moving
z z z 5 10 15 20 25 30 35 40 45 50 0 20 40 60 80 100 120 140 160 180 ζ˜x ˜ ζx ˜ ζx −0.010 −0.005 0 0.005 0.010 (a) 5 10 15 20 25 30 35 40 45 50 0 20 40 60 80 100 120 140 160 180 −0.02 −0.01 0 0.01 0.02 (b) Time 5 10 15 20 25 30 35 40 45 50 0 20 40 60 80 100 120 140 160 180 −0.10 −0.05 0 0.05 0.10 (c)
Figure 2. Temporal evolution of in-line displacement fluctuation along the cylinder span at (a) Rem= 110, (b) Rem= 330 and (c) Rem= 1100.
due to the presence of travelling wave components. The dominant character of the travelling wave pattern on in-line displacements almost suppresses these standing
wave cells on most of the cylinder span at Rem= 110 and Rem= 330.
The effect of the Reynolds number on response amplitudes had previously been reported by Evangelinos & Karniadakis (1999), concerning cross-flow vibrations in
uniform flow. It can be observed that the Rem influence appears more pronounced
in the in-line direction and that the ratio between the cross-flow and the in-line
maximum oscillation amplitudes decreases as Rem increases. The Reynolds number
effect on the structural response can partly be related to modifications occurring in the
wake pattern as shown in§ 4.2. The amplitudes of vibration observed at Rem= 1100
are similar to those observed in the experimental measurements carried out with flexible cylinders at higher Reynolds numbers (Chaplin et al. 2005; Trim et al. 2005; Lie & Kaasen 2006; Huera-Huarte & Bearman 2009a). In a linear shear flow and for
Rem∈ [4800, 34 200], Lie & Kaasen (2006) reported span-averaged r.m.s. values of the
displacement in the range 0.05D–0.08D in the in-line direction and about 0.25D in the cross-flow direction. In the case of flexible cylinders constrained to oscillate in the
cross-flow direction in a linear shear flow at Rem= 1000, Lucor et al. (2001) and Lucor
z z z 5 10 15 20 25 30 35 40 45 50 0 20 40 60 80 100 120 140 160 180 ζy ζy ζy −0.4 −0.3 −0.2 −0.1 0 0.1 0.2 0.3 0.4 (a) 5 10 15 20 25 30 35 40 45 50 0 20 40 60 80 100 120 140 160 180 −0.6 −0.4 −0.2 0 0.2 0.4 0.6 (b) Time 5 10 15 20 25 30 35 40 45 50 0 20 40 60 80 100 120 140 160 180 −0.6 −0.4 −0.2 0 0.2 0.4 0.6 (c)
Figure 3.Temporal evolution of cross-flow displacement along the cylinder span at
(a) Rem= 110, (b) Rem= 330 and (c) Rem= 1100.
equal to 0.24D and 0.23D for low- and high-wavenumber vibrations, respectively. In the present case, 0.045D and 0.26D are reached in the in-line and cross-flow
directions, at Rem= 1100. Despite the influence of the Rem on the amplitude of the
vibrations, the basic mechanisms of the structural vibrations remain the same as the Reynolds number increases, as also discussed in the following.
3.2. Spectral analysis of the structural response
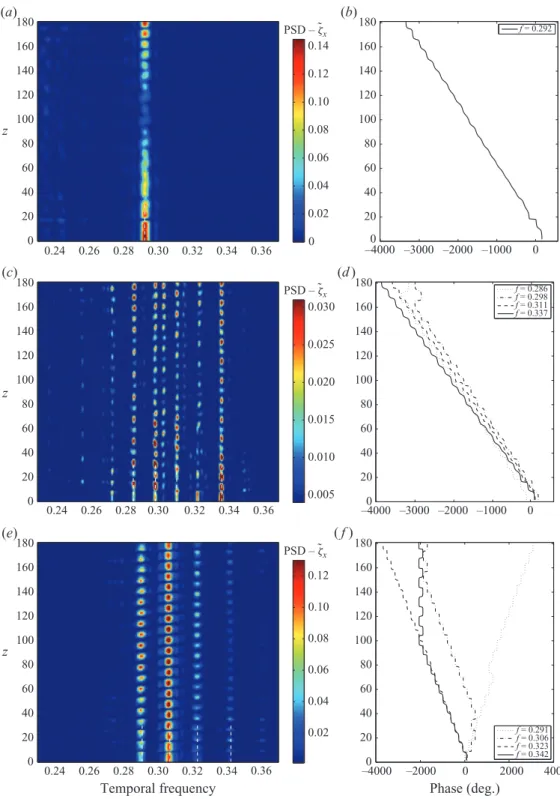
Spectral analysis is performed on the entire time series of the cylinder motions, after the initial transient dies out. The objective is to characterize the standing–travelling wave pattern of the structural response from both the temporal and spatial points of view. Spanwise distributions of the temporal power spectra of the in-line and cross-flow vibrations are presented in figures 5 (a, c, e) and 6 (a, c, e). In these plots,
the power spectral densities (PSD) of ˜ζx and ζy are normalized at each spanwise
location by the corresponding displacement variance.
Concerning the in-line motion, a response at a single frequency is observed at
0.05 0.10 0.15 0.20 0 20 40 60 80 100 120 140 160 180 (ζ~x)max (ζy)max z Rem =110 Rem =330 Rem =1100 (a) 0.1 0.2 0.3 0.4 0.5 0.6 0.7 0.8 0 20 40 60 80 100 120 140 160 180 (b) 0.01 0.02 0.03 0.04 0.05 0.06 0 20 40 60 80 100 120 140 160 180 (ζy)rms z (c) 0.05 0.10 0.15 0.20 0.25 0.30 0.35 0.40 0 20 40 60 80 100 120 140 160 180 (d ) (ζ~x)rms
Figure 4.(a, b) Maximum and (c, d ) r.m.s. values of (a, c) in-line displacement fluctuation and (b, d ) cross-flow displacement along the cylinder span.
responses at several frequencies. These two types of responses are referred to herein as ‘mono-frequency’ and ‘multi-frequency’, respectively. The possible causes of a switch
between mono- and multi-frequency responses, as Remis changed, are currently under
investigation.
At Rem= 330, four response frequencies of relatively similar amplitude are
competing, while secondary peaks are also present. It can be observed that the peaks are clearly defined and distinct from each other, despite a narrow-band vibration, in the range of [0.24, 0.36]. The corresponding frequencies present spectral peaks
along the entire span. This is also the case at Rem= 1100 where a single spectral
peak dominates among several response peaks. In all cases, the spanwise pattern of PSD exhibits well-defined cells that are related to the excitation of specific structural wavelengths, as shown in the following. The standing or travelling character of each excited temporal response is studied by means of a technique suggested by Lucor et al. (2006). Fourier series can be used to approximate the structure response as follows, using N + 1 temporal Fourier modes:
z z z 0.24 0.26 0.28 0.30 0.32 0.34 0.36 0 20 40 60 80 100 120 140 160 180 PSD – ˜ζx 0 0.02 0.04 0.06 0.08 0.10 0.12 0.14 (a) –4000 –3000 –2000 –1000 0 20 0 40 60 80 100 120 140 160 180 f = 0.292 (b) Temporal frequency 0.24 0.26 0.28 0.30 0.32 0.34 0.36 0 20 40 60 80 100 120 140 160 180 PSD – ˜ζx 0.005 0.010 0.015 0.020 0.025 0.030 (c) (d ) –4000 –3000 –2000 –10000 0 20 40 60 80 100 120 140 160 180 Phase (deg.) f = 0.286 f = 0.298 f = 0.311 f = 0.337 0.24 0.26 0.28 0.30 0.32 0.34 0.36 0 20 40 60 80 100 120 140 160 180 PSD – ˜ζx 0.02 0.04 0.06 0.08 0.10 0.12 (e) –40000 –2000 0 2000 4000 20 40 60 80 100 120 140 160 180 f = 0.291 f = 0.306 f = 0.323 f = 0.342 ( f )
Figure 5.Temporal spectral analysis of in-line displacement fluctuation: (a, c, e) PSD of ˜ζx
along the cylinder span and (b, d, f ) spanwise evolution of selected temporal mode phase angles at (a, b) Rem= 110, (c, d ) Rem= 330 and (e, f ) Rem= 1100.
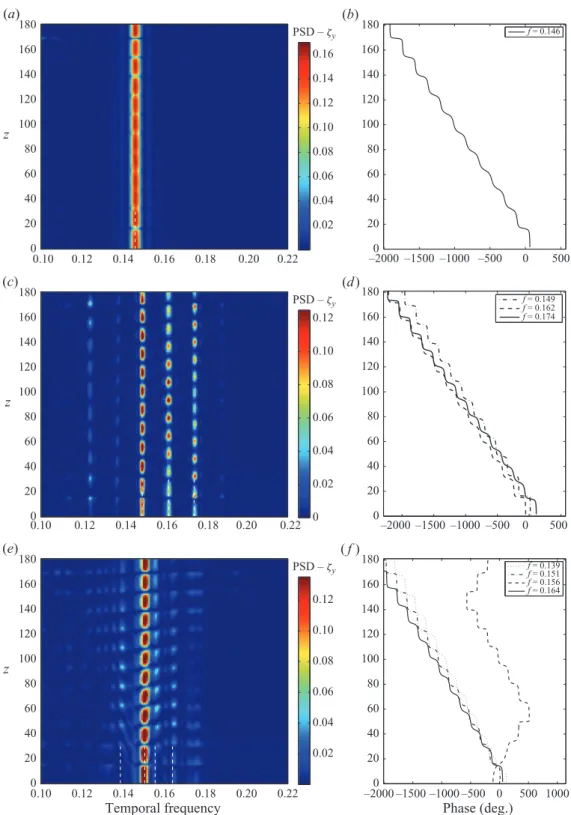
z 0.10 0.12 0.14 0.16 0.18 0.20 0.22 0 20 40 60 80 100 120 140 160 180 PSD – ζy 0.02 0.04 0.06 0.08 0.10 0.12 0.14 0.16 (a) –2000 –1500 –1000 –5000 0 500 20 40 60 80 100 120 140 160 180 f = 0.146 (b) z 0.10 0.12 0.14 0.16 0.18 0.20 0.22 0 20 40 60 80 100 120 140 160 180 PSD – ζy 0 0.02 0.04 0.06 0.08 0.10 0.12 (c) –2000 –1500 –1000 –500 0 500 0 20 40 60 80 100 120 140 160 180 f = 0.149 f = 0.162 f = 0.174 (d) Temporal frequency z 0.10 0.12 0.14 0.16 0.18 0.20 0.22 0 20 40 60 80 100 120 140 160 180 PSD – ζy 0.02 0.04 0.06 0.08 0.10 0.12 (e) –2000 –1500 –1000 –5000 0 500 1000 20 40 60 80 100 120 140 160 180 Phase (deg.) f = 0.139 f = 0.151 f = 0.156 f = 0.164 ( f )
Figure 6. Temporal spectral analysis of cross-flow displacement: (a, c, e) PSD of ζy along the
cylinder span and (b, d, f ) spanwise evolution of selected temporal mode phase angles at (a, b) Rem= 110, (c, d ) Rem= 330 and (e, f ) Rem= 1100.
˜ ζx(z, t)≈ N/2 X q=−N/2 ax q(z) exp[2πifqt] = N/2 X q=−N/2 |ax q|(z) exp£i ¡2πfqt + ψqx(z) ¢¤ (3.1) ζy(z, t)≈ N/2 X q=−N/2 aqy(z) exp[2πifqt] = N/2 X q=−N/2 |ay q|(z) exp£i ¡2πfqt + ψqy(z)¢¤, (3.2)
where fq= q/Ts is the frequency associated with the qth mode and Ts the sampling
period. The complex modal coefficients ax
q and a
y
q are also written in terms of their
moduli (|ax
q| and |a
y
q|) and their spatial phase angles (ψ
x
q and ψ
y
q). The spanwise
evolution of the phase angles are presented in figures 5 (b, d, f ) and 6 (b, d, f ), for the selected frequencies shown in figures 5 (a, c, e) and 6 (a, c, e), respectively, through
dashed lines (lower part of the PSD plots); only positive frequencies (q∈ [0, N/2]) are
plotted. As a consequence, spatial phase angles which are decreasing along the span (increasing z) denote travelling waves oriented from high-velocity regions (near z = 0) towards the low-velocity regions; and vice versa for phase angle increasing along the
span. At Rem= 110 and Rem= 330, the predominant frequencies of in-line vibration
are associated with travelling waves moving towards the low-velocity regions. Modulations can be noticed in the nearly linear evolution of the spatial phase angles. This saw-tooth or zigzagging evolution is due to the underlying standing wave pattern. In the idealized case of a strictly linear spatial phase variation (pure
travelling wave), the total phase of the qth mode becomes 2πfqt+ 2πkx
qz+ η
x
q. The
slope of ψx
q can be used to determine the excited structural wavenumber k
x
q; η
x q
denotes a phase lag which is independent of z. Sine Fourier modes (sin(πnzD/L)
for the nth mode) are often used to describe the structural response (e.g. Chaplin et al. 2005; Lie & Kaasen 2006). For illustration purposes, and comparison with the
existing literature, the excited wavenumber kx
q can be related to the sine Fourier mode
2kx
q(L/D). In the case Rem= 110, a linear approximation of ψqx indicates that the
excited wavenumber corresponds to the 22nd structural mode, which is also verified in the following by a joint space/time spectral analysis. The in-line response is more
complex at Rem= 1100.
A similar analysis is carried out for cross-flow vibrations (figure 6). At Rem= 110,
a single frequency is excited along the span and corresponds to a wave travelling
towards low-velocity regions. The case Rem= 330 exhibits a multi-frequency response
with three frequencies emerging; they are all related to waves travelling towards the low-velocity region. For free vibrations in the cross-flow direction only, Lucor et al. (2006) also reported three excited frequencies associated with waves travelling in the same direction, in a linear shear flow. The wave associated with a wider predominant
peak at Rem= 1100 is also travelling towards the low-velocity region. The wave
corresponding to one of the secondary peaks is travelling towards z = 0 near the ends. The ratio between in-line and cross-flow predominant frequencies is very close to
2 at Rem= 110. In the case Rem= 330, the predominant frequency in the cross-flow
direction (0.149) can be linked to the peak occurring at 0.298 in the in-line direction, leading to a ratio of 2. The second cross-flow frequency (0.162) is associated through a ratio of 2 with secondary in-line peaks. The third cross-flow frequency (0.174) can be linked to a very small in-line contribution around 0.35, that can be identified for
z <40. The frequency ratio of in-line and cross-flow predominant frequencies is equal
to 2.03 at Rem= 1100. This apparent slight deviation from 2 is due to irregularities
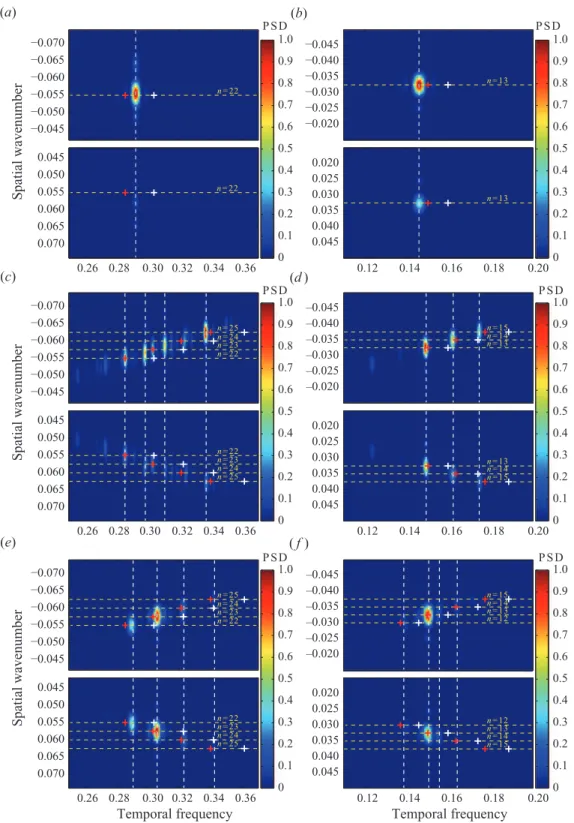
In order to relate the excited frequencies to structural wavenumbers, a spatio-temporal spectral analysis based on a two-dimensional fast Fourier transform of the evolution of structural responses is performed. In figure 7, two-dimensional PSD of in-line and cross-flow motions are plotted as functions of frequency and spatial wavenumber. Positive frequencies are presented and thus negative wavenumbers (upper part of each plot) are associated with travelling waves moving towards low-velocity regions, while positive wavenumbers (lower part of each plot) represent travelling waves moving towards high-velocity regions. The PSD is normalized by the maximum value observed in both domains (positive and negative wavenumbers). The frequencies identified in figures 5 and 6 are indicated by white vertical dashed lines in the corresponding plots. For comparison purposes, selected sine Fourier mode wavenumbers are indicated by yellow horizontal dashed lines.
The predominant excited wavenumbers correspond to modes n ∈ {22, 23, 24, 25}
in the in-line direction and n∈ {13, 14, 15} in the cross-flow direction. These mode
numbers are close to those measured experimentally by Trim et al. (2005) and Lie & Kaasen (2006), where cases of multi-frequency response have been reported in shear flow. It is recalled that in the present case of mixed standing–travelling wave responses, the concept of structural modes and the association of the excited wavenumbers with the corresponding sine Fourier modes are used loosely, for illustration purposes only.
The proximity of the contributions of wavenumbers±0.0325 and ±0.035 in the case
Rem= 330 (cross-flow) is in agreement with the fact that 12 or 13 nodes can be
observed alternatively in the response pattern.
In all cases, the ratio between the in-line and cross-flow excited wavenumbers is different from 2 as expected, since for a mixed cable/beam structure, the relation between a spatial wavenumber and the corresponding natural frequency is not linear (see expression (3.3) in the following). As a consequence, the nodes of standing wave pattern in the cross-flow direction do not necessarily coincide with in-line motion nodes. This creates a perturbation of the in-line/cross-flow motion synchronization
pattern as explained in§ 3.3.
In general, at a given vibration frequency it appears that only a single peak emerges in the spatial spectrum, at the same wavenumber on both the negative and positive sides; i.e. a single structural wavelength is excited at a given frequency. Conversely, a given spatial wavelength responds mainly to a single frequency that depends on
Rem. Exceptions exist, as for instance in the case Rem= 330, where the wavenumber
0.0575 is excited at two distinct frequencies in the in-line direction. As expected, the excited structural wavenumber increases with increasing excitation frequency. The
natural frequency fnat of the tensioned beam associated with the wavenumber k can
be evaluated as follows, in vacuum:
fnat(k) = k
q
ω2
c+ 4π2ω2bk2. (3.3)
The frequencies corresponding to the selected wavenumbers are indicated by white crosses in figure 7. The effective vibration frequencies present a strong drift from the natural frequency spectrum. This spectrum can be modified as follows to take into account the immersion of the cylinder into the fluid:
fmod = fnat v u u t m m+π 4Cm , (3.4)
Spatial wavenumber −0.070 −0.065 −0.060 −0.055 −0.050 −0.045 P S D 0 0.1 0.2 0.3 0.4 0.5 0.6 0.7 0.8 0.9 1.0 0.26 0.28 0.30 0.32 0.34 0.36 0.045 0.050 0.055 0.060 0.065 0.070 n = 22 (a) n = 22 −0.045 −0.040 −0.035 −0.030 −0.025 −0.020 P S D 0 0.1 0.2 0.3 0.4 0.5 0.6 0.7 0.8 0.9 1.0 0.12 0.14 0.16 0.18 0.20 0.020 0.025 0.030 0.035 0.040 0.045 n = 13 (b) n = 13 −0.070 −0.065 −0.060 −0.055 −0.050 −0.045 P S D 0 0.1 0.2 0.3 0.4 0.5 0.6 0.7 0.8 0.9 1.0 Spatial wavenumber 0.26 0.28 0.30 0.32 0.34 0.36 0.045 0.050 0.055 0.060 0.065 0.070 n = 22 n = 23 n = 24 n = 25 (c) n = 22 n = 25 n = 24 n = 23 –0.045 –0.040 –0.035 –0.030 –0.025 –0.020 P S D 0 0.1 0.2 0.3 0.4 0.5 0.6 0.7 0.8 0.9 1.0 0.12 0.14 0.16 0.18 0.20 0.020 0.025 0.030 0.035 0.040 0.045 n = 13 n = 14 n = 15 (d ) n = 13 n = 14 n = 15 −0.070 −0.065 −0.060 −0.055 −0.050 −0.045 P S D 0 0.1 0.2 0.3 0.4 0.5 0.6 0.7 0.8 0.9 1.0 Temporal frequency Spatial wavenumber 0.26 0.28 0.30 0.32 0.34 0.36 0.045 0.050 0.055 0.060 0.065 0.070 (e) –0.045 –0.040 –0.035 –0.030 –0.025 –0.020 P S D 0 0.1 0.2 0.3 0.4 0.5 0.6 0.7 0.8 0.9 1.0 Temporal frequency 0.12 0.14 0.16 0.18 0.20 0.020 0.025 0.030 0.035 0.040 0.045 n = 13 n = 14 n = 15 n = 12 ( f ) n = 13 n = 14 n = 15 n = 12 n = 22 n = 23 n = 24 n = 25 n = 22 n = 25 n = 24 n = 23
Figure 7.Spatio-temporal spectral analysis of (a, c, e) in-line displacement fluctuation and (b, d, f ) cross-flow displacement at (a, b) Rem= 110, (c, d ) Rem= 330 and (e, f ) Rem= 1100. The
white vertical dashed lines denote the frequencies identified in figures 5 and 6. The wavenumbers of selected sine Fourier modes are indicated by yellow horizontal dashed lines. The white (red) crosses denote the natural (modified) frequencies associated with these wavenumbers.
where Cm is the added mass coefficient induced by the fluid. The corresponding
modified frequencies fmod, for a choice of C
m= 1, are indicated by red crosses
in figure 7. While this modified spectrum seems to provide a reasonable approximation to the effective excited frequencies in some cases, significant discrepancies appear in
other cases, as for example in both directions at Rem= 110 and in the in-line direction
at Rem= 1100. This emphasizes the variability of the added mass coefficient and hence
the difficulty of estimating a priori the structural response.
The relative weights of negative and positive wavenumber peaks for the same frequency confirm the observations made previously concerning the mixed standing– travelling character of structural vibrations and, especially, the reinforced standing
character of the response at Rem= 1100.
The spectral analysis demonstrates the existence of multi-frequency responses, where different structural wavenumbers are excited. At a given spanwise location, several structural wavenumbers can contribute significantly to the total vibration. This is the
case at Rem= 330 in the cross-flow direction, for instance (figure 6c). Since the three
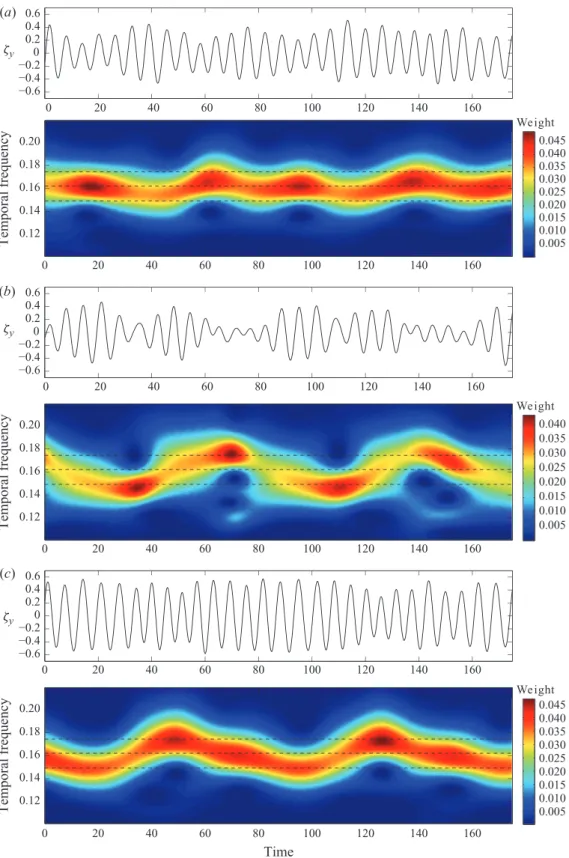
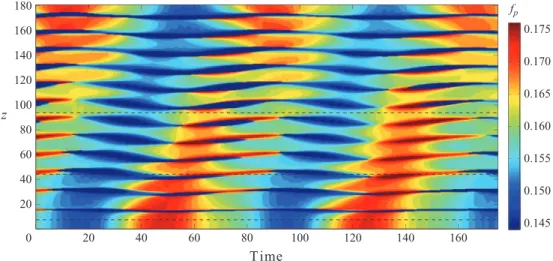
excited frequencies are associated with a distinct wavenumber, the distribution of nodes and anti-nodes along the span leads to three possible vibrating configurations, with one, two or three frequencies present at each spanwise location. It should be noted, again, that we are using the term ‘node’ loosely, to denote a minimum in the envelope of the response; it is not strictly speaking a node where the response is zero. The question that arises is whether the response is instantaneously mono-frequency, with a shifting frequency in time, or it is multi-frequency at all times. This question is addressed by means of time/frequency analysis. At each spanwise location, the instantaneous frequency content of the response can be monitored as a function of time by computing a scalogram, which shows the squared magnitude of a continuous wavelet transform as a function of the frequency and time (Boashash 2003). Three different locations, that exhibit one-, two- and three-frequency responses, are selected along the span (z = 94, z = 44 and z = 7.5, respectively), and the corresponding time series and scalograms are plotted in figure 8 over a selected time interval. In these plots, the three predominant frequencies identified in the previous spectral analysis are indicated by dashed lines. The mono-frequency case (figure 8a) exhibits only small deviations about the predominant frequency. In both multi-frequency cases (figure 8b,c), the structural response does not exhibit an instantaneous broad spectrum; instead the vibration is instantaneously dominated by a single frequency, that drifts relatively regularly from one predominant frequency to another. As a consequence, the response previously identified as multi-frequency, because of its overall spectral content, can be regarded as ‘instantaneously mono-frequency’. This observation is verified along the whole span and is also verified in the case of a multi-frequency response in the in-line direction, even though the scalograms are noisier in this case.
Figure 8 shows that the temporal variation of the dominant frequency does not occur simultaneously along the entire span. As a result, different structural wavenumbers can be excited instantaneously along the cylinder span. To illustrate
this point, the instantaneous predominant frequency fp is plotted as a function
of time and space in figure 9. The three dashed lines indicate the location of the signals analysed in figure 8. This spatio-temporal map of the response frequency confirms that different frequencies, and thus structural wavenumbers, are excited simultaneously, but at different locations along the cylinder span. The distribution of excited frequencies resembles a low-frequency travelling wave with non-constant amplitude, as it is modulated by the standing-wave component of the structural
0 20 40 60 80 100 120 140 160 −0.6 −0.4 −0.2 0 0.2 0.4 0.6 ζy (a) Temporal frequency 0 20 40 60 80 100 120 140 160 0.12 0.14 0.16 0.18 0.20 We ight 0.005 0.010 0.015 0.020 0.025 0.030 0.035 0.040 0.045 0 20 40 60 80 100 120 140 160 −0.6 −0.4 −0.2 0 0.2 0.4 0.6 ζy ζy (b) Temporal frequency 0 20 40 60 80 100 120 140 160 0.12 0.14 0.16 0.18 0.20 We ight 0.005 0.010 0.015 0.020 0.025 0.030 0.035 0.040 0 20 40 60 80 100 120 140 160 −0.6 −0.4 −0.2 0 0.2 0.4 0.6 (c) Time Temporal frequency 0 20 40 60 80 100 120 140 160 0.12 0.14 0.16 0.18 0.20 We ight 0.005 0.010 0.015 0.020 0.025 0.030 0.035 0.040 0.045
Figure 8.Selected cross-flow displacement time series (upper part) and corresponding
frequency content as a function of time (scalogram, lower part) in the case Rem= 330 at
(a) z = 94, (b) z = 44 and (c) z = 7.5. The dashed lines denote the predominant frequencies identified in figure 6(c).
T ime z 20 40 60 80 100 120 140 160 0 20 40 60 80 100 120 140 160 180 f p 0.145 0.150 0.155 0.160 0.165 0.170 0.175
Figure 9. Predominant frequency of cross-flow displacement as a function of time along the
cylinder span in the case Rem= 330. The dashed lines indicate the time series presented in
figure 8.
motion. In high (low) dominant frequency regions, the distance between two adjacent nodes tends to decrease (increase) leading to an undulated stripped pattern.
So far, in-line and cross-flow vibrations have been reported separately. They are, in fact, coupled nonlinearly via the flow forces, and hence an investigation of the synchronization between the in-line and cross-flow displacements is performed next to properly characterize the structural response.
3.3. Synchronization of in-line and cross-flow vibrations
The synchronization between the in-line and cross-flow displacements of an elastically mounted rigid cylinder has been investigated experimentally in Dahl et al. (2007) and Dahl et al. (2010). It was shown that there is a strong influence of the in-line versus cross-flow motion phase difference on the wake patterns and hence on the forces acting on the structure. Concerning long flexible cylinders in shear flows, Vandiver et al. (2009) and Modarres-Sadeghi et al. (2010) have emphasized, on the basis of experimental measurements, a possible link between this synchronization and the distribution of excitation and damping regions along the span.
The same phenomena are also addressed here in§ 4.3. Synchronization is quantified
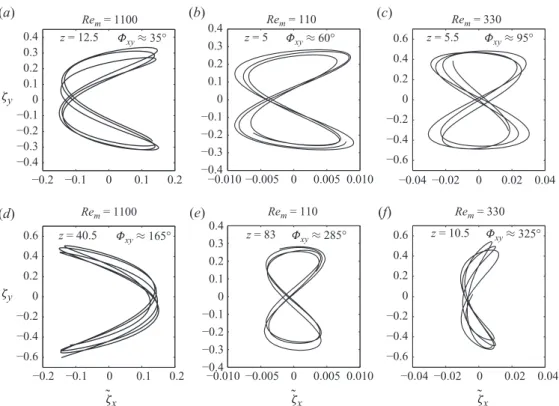
in terms of the phase difference between in-line and cross-flow vibrations along the cylinder span and is shown to be related to the nature of the fluid–structure energy transfer. Selected cylinder trajectories at different spanwise locations are shown in figure 10. These Lissajous curves depict ‘figure-eight’ orbits, which often characterize in-line responses at approximately twice the cross-flow frequency. The phase difference between synchronized in-line and cross-flow motions controls the specific shape and direction of travel in these orbits.
The instantaneous phases of in-line and cross-flow vibrations (φx and φy
respectively) are determined by means of the Hilbert transform. Adopting an approach
similar to that in Huera-Huarte & Bearman (2009a), the phase difference Φxy is
evaluated as follows:
−0.2 −0.1 0 0.1 0.2 −0.4 −0.3 −0.2 −0.1 0 0.1 0.2 0.3 0.4 Rem = 1100 Rem = 110 Rem = 330 Rem = 1100 Rem = 110 Rem = 330 ζy (a) z = 12.5 z = 40.5 z = 83 z = 10.5 Φxy ≈ 35° Φxy ≈ 285° Φxy ≈ 325° Φxy ≈ 165° Φxy ≈ 95° Φxy ≈ 60° −0.4 −0.3 −0.2 −0.1 0 0.1 0.2 0.3 0.4 (b) z = 5 z = 5.5 −0.04 −0.02 0 0.02 0.04 −0.6 −0.4 −0.2 0 0.2 0.4 0.6 (c) −0.2 −0.1 0 0.1 0.2 −0.6 −0.4 −0.2 0 0.2 0.4 0.6 ˜ ζx ˜ ζx ˜ζx ζy (d) −0.010 −0.005 0 0.005 0.010 −0.010 −0.005 0 0.005 0.010 −0.4 −0.3 −0.2 −0.1 0 0.1 0.2 0.3 0.4 (e) −0.04 −0.02 0 0.02 0.04 −0.6 −0.4 −0.2 0 0.2 0.4 0.6 (f)
Figure 10. Selected trajectories of the cylinder at different spanwise locations in the three cases Rem= 110, Rem= 330 and Rem= 1100.
where p and q are two integer numbers defining the level of synchronization.
Considering the spectral analysis presented in§ 3.2, the couple (p, q) = (1, 2) is chosen
here. Values of Φxy in the range 0◦–180◦ (180◦–360◦, respectively) correspond to
orbits where the cylinder moves upstream (downstream, respectively) when reaching the cross-flow oscillation maxima. These two types of trajectories are referred to as
‘counter-clockwise’ and ‘clockwise’, respectively (Dahl et al. 2007). Values of Φxy are
specified for each trajectory in figure 10.
Spatio-temporal evolutions of the phase difference associated with the time series presented in figures 2 and 3 are plotted in figure 11. As previously mentioned in Huera-Huarte & Bearman (2009a), an analysis of the phase angle assumes that the in-line and cross-flow motions are synchronized over an extended time interval, i.e.
the temporal evolution of Φxy exhibits plateaux. Such plateaux are observed for the
three cases studied herein, as illustrated in figure 10. Figure 11 depicts for each case a horizontally stripped pattern with relatively regular jumps along the span. At a given
spanwise location, the unsteadiness of phase difference increases with Rem.
To quantify the predominant phase difference along the span, histograms of Φxy
are evaluated from the entire time series. Figure 12 shows, for each Rem and
at each spanwise location, the relative weights of phase difference angles. The contributions are normalized by the maximum weight. Increasing unsteadiness of
the phase difference leads to noisier histograms as Rem increases. Despite this, a
predominant phase difference can be identified in most cases.
At Rem= 110, a first region can be distinguished for z < 20, approximately, where
5 10 15 20 25 30 35 40 45 50 0 20 40 60 80 100 120 140 160 180 (a) Φ xy 0 50 100 150 200 250 300 350 5 10 15 20 25 30 35 40 45 50 0 20 40 60 80 100 120 140 160 180 Φxy 0 50 100 150 200 250 300 350 Time 5 10 15 20 25 30 35 40 45 50 0 20 40 60 80 100 120 140 160 180 Φxy 0 50 100 150 200 250 300 350 z z z (b) (c)
Figure 11. Temporal evolution of the phase difference between in-line and cross-flow
displacements (3.5) along the cylinder span at (a) Rem= 110, (b) Rem= 330 and
(c) Rem= 1100.
in-line and cross-flow directions with the excited in-line structural mode corresponding to twice the cross-flow modal number. Indeed, in that case the anti-node of cross-flow displacement corresponds to a node of in-line displacement, where a change in orbit
orientation also occurs. Here, Φxy≈ 60◦ at z = 5 and Φxy≈ 300◦ at z = 14.
A similar pattern can be identified in the case Rem= 330, with a switch between
clockwise and counter-clockwise trajectories. This is related to the predominant standing wave pattern in this region.
Note that the excited structural wavelength in the in-line direction is not exactly half of the cross-flow one, and the standing waves are perturbed by the development of travelling waves; this explains why the alternating clockwise/counter-clockwise pattern does not persist beyond this region.
In the idealized case of pure travelling waves in both directions, with double frequency in the in-line direction, a constant phase difference could be observed
along the span. At Rem= 110, the mixed standing–travelling wave patterns lead to
Φxy z 100 200 300 0 20 40 60 80 100 120 140 160 180 We ight 0 0.1 0.2 0.3 0.4 0.5 0.6 0.7 0.8 0.9 1.0 (a) Φxy Φxy 100 200 300 0 20 40 60 80 100 120 140 160 180 We ight 0 0.1 0.2 0.3 0.4 0.5 0.6 0.7 0.8 0.9 1.0 (b) 100 200 300 0 20 40 60 80 100 120 140 160 180 We ight 0 0.1 0.2 0.3 0.4 0.5 0.6 0.7 0.8 0.9 1.0 (c)
Figure 12. Histogram of the phase difference (3.5) along the cylinder span at (a) Rem= 110,
(b) Rem= 330 and (c) Rem= 1100.
cross-flow displacement nodes. In each cell the phase difference decreases by
approximately −80◦. As a result, a drift of the pattern towards higher phase angles
occurs along the span (increasing z). It is interesting to note that this pattern is
mainly located in the range Φxy∈ [0◦,180◦] in the high-velocity region, which means
that counter-clockwise orbits are preferred in this region; this coincides with the experimental observations of Modarres-Sadeghi et al. (2010). The zigzagging pattern is altered beyond z = 140, where travelling waves are less pronounced.
A very similar analysis can be carried out at Rem= 330. Even though noisier, the
same pattern can be identified as counter-clockwise trajectories seem also predominant
in the high-velocity region, except very close to z = 0. The case Rem= 1100 exhibits
some differences, as two peaks emerge near z = 0, which correspond to two possible
synchronized states. The fact that a peak appears at Φxy≈ 30◦around z = 14, whereas
a peak exists at Φxy≈ 20◦ near z = 5, could appear to contradict the above-described
clockwise/counter-clockwise alternating pattern in regions dominated by standing
waves. In fact, a careful monitoring of the Φxy temporal evolution shows that this
last peak is related to secondary peaks at Φxy≈ 215◦ (z = 14) and Φxy≈ 345◦ (z = 14),
while Φxy≈ 30◦ (z = 14) and Φxy≈ 210◦ (z = 5) occur simultaneously. Therefore, the
clockwise/counter-clockwise alternating pattern is preserved in this region as well. The
standing character of the structural displacements is more pronounced at Rem= 1100,
which causes a distortion of the zigzagging pattern. In particular, larger jumps are observed between spanwise cells. In the high-velocity region (10 < z < 60), most
Φxy≈ 160◦. The drift towards higher angles along the span is less pronounced than
in previous cases and occurs mainly beyond z = 60.
In all studied cases, synchronization states between in-line and cross-flow motions can be found along the cylinder span. A region of alternating clockwise/counter-clockwise motions can be identified near z = 0, where the standing character of the structure response dominates. Beyond this region, the distribution of phase difference between in-line and cross-flow vibrations follows a zigzagging pattern which occurs
within the range Φxy ∈ [0◦,180◦] in the high-velocity region, and is thus related to
counter-clockwise orbits.
Next we proceed to correlate the observations made on the nature of the structural response and the synchronization between in-line and cross-flow motions with flow patterns and fluid–structure interaction mechanisms.
4. Coupled fluid–structure system
This section focuses on the fluid–structure interaction mechanisms causing the
vibrations analysed in § 3. The occurrence of the lock-in phenomenon is studied in
§ 4.1, and an analysis of the wake patterns is presented in § 4.2. Finally, fluid forces
and fluid–structure energy transfer are studied in§ 4.3.
4.1. Lock-in within shear flow
The phenomenon of lock-in in flexibly mounted rigid cylinders within uniform flow consists of self-excited, VIV accompanied by the ‘locking’ of the frequency of vortex formation with the frequency of cylinder vibrations, rather than the Strouhal frequency, which is associated with the von K ´arm ´an instability behind a stationary cylinder. It has been investigated extensively in the literature, as reviewed by Bearman (1984) and Williamson & Govardhan (2004). This is an important feature of VIV; it has been shown, in particular, that maximum oscillation amplitudes occur under the lock-in condition. This synchronization can exist over a wide range of oncoming flow velocities, especially for low mass ratios.
Studies of rigid cylinders forced to vibrate harmonically at a prescribed amplitude and frequency have underscored the importance of the phenomenon of ‘wake capture’, i.e. the entrainment of the vortex shedding frequency relatively far from the Strouhal frequency (Sarpkaya 2004).
A long flexible cylinder in shear flow is also known to undergo self-induced vibrations, but the wake capture is exhibited only over part of the cylinder span; in the remaining part, the wake does not lock in to the structural vibration frequency. As a result, when a flexible structure undergoes VIV, we refer to a ‘region of lock-in’ versus a ‘region of non-lock-in’ across the span. Even within a lock-in region, the phenomenon of frequency entrainment is much more complex in shear flow because several frequencies may potentially be excited. Indeed, a uniform oncoming flow past a constant diameter cylinder induces a narrow excitation bandwidth, resulting in a single frequency of vortex shedding. In contrast, it is unclear for a non-uniform current how the flow–structure interaction mechanisms apply when several natural frequencies are within the bandwidth of excitation by the flow, and which frequency may dominate.
In the case of forced cross-flow oscillations of rigid and flexible cylinders in sheared currents, Stansby (1976) and Peltzer & Rooney (1985) have emphasized the formation of long (>40D) spanwise cells of constant shedding frequency equal to the forcing frequency. This partial lock-in of the wake perturbs the pattern observed in the case of
a stationary cylinder in shear flow (or stationary tapered cylinder in a uniform flow) that is composed of smaller cells separated by regular discontinuities of shedding frequency (Noack et al. 1991). For a long flexible cylinder constrained to oscillate in the cross-flow direction and using a low-resolution simulation, Lucor et al. (2001) have reported a partial lock-in spanwise distribution with a synchronization region located in the high-velocity zone, and an unsynchronized state region elsewhere.
A detailed analysis of the lock-in phenomenon is presented here for the flexible cylinder under study. The lock-in condition at any location along the cylinder span is established when the frequency of the wake velocity oscillations coincides with the frequency of the local cross-flow structural response; otherwise, we characterize the condition as non-lock-in. We define a ‘lock-in region’ of the structure to be a continuous part of the span which contains all locally locked-in locations. We pay particular attention to both the lock-in and non-lock-in regions, especially for the cases of multi-frequency response. The influence of lock-in/non-lock-in conditions on
the fluid–structure energy transfer is addressed in§ 4.3.
The vortex shedding frequency is established from the cross-flow component of the flow velocity, v, which was recorded over the same time interval as the structural displacements, along a spanwise line located downstream of the cylinder at (x, y) = (20, 0). The PSD of the v velocity component is plotted along the span for the
three Rem in figure 13. Selected frequencies, previously identified by spectral analysis
of the structure response (§ 3.2), are indicated by dashed lines. Two main spanwise regions can be distinguished in all cases: a region of lock-in, where the vortex shedding frequency coincides with the structural cross-flow vibration frequency (or frequencies, in the case of multi-frequency response), can be identified in the high-velocity region, near z = 0. The rest of the span corresponds to a non-lock-in region, where vortex shedding and structural vibrations are not synchronized.
The detailed plots of the lock-in regions are presented in figures 13(b), 13(d ), 13 (f ).
At Rem= 110, lock-in occurs over 59D, starting from z = 0. The case Rem= 330
exhibits lock-in at the three distinct frequencies identified in the multi-frequency structural response. The region where vortex shedding is synchronized with at least one of these frequencies covers 75D.
At Rem= 1100, the spanwise evolution of the predominant frequency of v presents
more irregular events than in previous cases due to the absence of stable wake patterns in several spanwise regions, as discussed in the following. These zones, where no predominant frequency peak can be identified, create ‘holes’ in the lock-in spanwise pattern. The synchronization zone can be referred to as a ‘discontinuous lock-in region’ and covers 77D.
Two possible causes can be suggested to explain the tendency observed concerning
the length increase of the lock-in region as Remincreases, especially between Rem= 110
and the two other cases. Previous studies on forced oscillations in shear flow (Stansby 1976; Peltzer & Rooney 1985) have reported that the lock-in region grows in size as the oscillation amplitude increases. Such an increase in the oscillation amplitude
is observed in the present case as a function of Rem (figure 4). Another possible
explanation is related to a larger variation of the Strouhal number in the region
z ∈ [50, 80] in the case Rem= 110 (Re∈ [75, 90]) than at higher Rem (Williamson
1992; Braza, Faghani & Persillon 2001).
It can be noted that for z∈ [0, 80] approximately, the quasi-static bending of the
cylinder, due to the time mean component of drag force, can tend to oppose the shear flow effect by increasing the magnitude of the velocity component normal to the cylinder for increasing z. For z > 80, approximately, the structural static bending can
z z z 0.05 0.10 0.15 0.20 0 20 40 60 80 100 120 140 160 180 PSD – υ 0.02 0.04 0.06 0.08 0.10 0.12 0.14 0.16 (a) 0.10 0.12 0.14 0.16 0.18 0.20 0 10 20 30 40 50 60 70 80 90 PSD – υ 0.02 0.04 0.06 0.08 0.10 0.12 0.14 0.16 (b) 0.05 0.10 0.15 0.20 0 20 40 60 80 100 120 140 160 180 PSD – υ 0.005 0.010 0.015 0.020 0.025 0.030 0.035 0.040 (c) 0.10 0.12 0.14 0.16 0.18 0.20 0 10 20 30 40 50 60 70 80 90 PSD – υ 0.005 0.010 0.015 0.020 0.025 0.030 0.035 0.040 (d) Temporal frequency 0.05 0.10 0.15 0.20 0 20 40 60 80 100 120 140 160 180 PSD – υ 0.004 0.006 0.008 0.010 0.012 0.014 0.016 0.018 0.020 (e) Temporal frequency 0.10 0.12 0.14 0.16 0.18 0.20 0 10 20 30 40 50 60 70 80 90 PSD – υ 0.004 0.006 0.008 0.010 0.012 0.014 0.016 0.018 0.020 ( f )
Figure 13. PSD of the temporal evolution of the cross-flow component of the flow velocity
along a spanwise line at (x, y) = (20, 0), at (a, b) Rem= 110, (c, d ) Rem= 330 and (e, f )
Rem= 1100. The detailed views of lock-in regions are plotted in (b, d, f ). The white dashed
lines indicate the frequencies identified in figure 6. In (d ), the yellow dashes indicate the local predominant structure vibration frequency identified from figure 6(c).
increase the effect of the shear flow by reducing the flow normal velocity component, as z increases.
Under the lock-in condition, large deviations from the Strouhal shedding frequency
are observed. The non-dimensional local shedding frequency is defined as fl= f/Ul,
where f is the local predominant frequency non-dimensionalized by U , the maximum
oncoming flow velocity (z = 0), and Ul is the local oncoming flow velocity
non-dimensionalized by U . The local shedding frequencies identified at lock-in are in the
ranges fl ∈ [0.146, 0.191], fl ∈ [0.149, 0.221] and fl ∈ [0.151, 0.216] for Rem= 110,
Rem= 330 and Rem= 1100 respectively.
In the case of multi-frequency response (Rem= 330), the spectral analysis carried
out in§ 3.2 revealed that three frequencies can contribute to the structural cross-flow
vibration at a given spanwise location. In this context, the question arises whether the vortex shedding is synchronized with preferentially a single frequency. Despite some secondary peak contributions, figure 13(d ) shows that, at each spanwise location, the vortex shedding is mainly synchronized with a single frequency, which can be a different one for each location. It has been emphasized previously that frequency responses are instantaneously mono-frequency and that the globally multi-frequency character is due to a temporal evolution of the excited multi-frequency. Hence, at a given spanwise location vortex shedding occurs mainly at a single frequency, while the structural vibration frequency may vary among the predominant vibration frequencies. As a consequence, the lock-in condition does not occur continuously as a function of time.
These observations raise a second question regarding which vibration frequency is selected by the wake to lock-in. In figure 13(d ), yellow dashes are used to indicate the local predominant structure vibration frequency issued from figure 6(c). The discontinuous line formed by these yellow dashes describes the lock-in pattern relatively accurately, showing that the wake lock-in frequency corresponds to the local predominant vibration frequency. It should be noted that some exceptions exist
as for z∈ [24, 28] where lock-in occurs at a vibration frequency equal to 0.162, while
this frequency has a secondary but significant contribution to the structural vibration in this region.
In non-lock-in regions, a global decrease of the vortex shedding frequency is observed along the span, in agreement with the spanwise decrease of the local shedding frequency based on the Strouhal number, the local Strouhal frequency, which follows
the linear reduction of the oncoming flow velocity. In the cases Rem= 110 and
Rem= 330, a cellular pattern can be clearly identified: spanwise regions of constant
shedding frequencies are separated by discontinuities. The frequency within a cell remains constant along its length; hence, the locations away from the centre of the cell violate the local Strouhal frequency; at the ends of the cell a threshold event is reached, and a new cell starts accompanied by a discontinuous jump in frequency to better agree with the local Strouhal frequency.
The question arises: what is the event that triggers the end of a cell? Similar cellular patterns have been reported for stationary cylinders in shear flow and tapered cylinders in uniform flow (e.g. Gaster 1971; Griffin 1985; Peltzer & Rooney 1985; Noack et al. 1991; Piccirillo & Van Atta 1993). These previous works have emphasized the influence of several parameters on the cell length, such as for instance the shear parameter, the cylinder aspect ratio and the Reynolds number. For a stationary cylinder of aspect ratio L/D = 107 and a comparable shear parameter, Peltzer & Rooney (1985) observed spanwise cells of 11 diameters on average, at a higher
which correspond approximately to half of the excited wavelength in the cross-flow
direction. At Rem= 110, it can be noticed that frequency discontinuities between
cells coincide roughly with the nodes of the structural response. Moreover, it can
be observed that the cellular pattern exists beyond z≈ 140 (Re <48), while vortex
shedding vanishes in this region as shown in the following. This is due to a persisting undulation of the wake, probably triggered by the adjacent vortex shedding. Similar observations can be made concerning the forcing of the cellular pattern by structural
vibration in the case Rem= 330. However, the existence of three competing excited
wavenumbers induces less sharp transitions between cells, since vibration nodes are
moving in the spanwise direction. At Rem= 1100, the non-lock-in region exhibits
a noisier frequency distribution, illustrating the increased complexity of the wake patterns; however, the general tendency towards decreasing shedding frequency along the span as well as the appearance of frequency discontinuities are clearly visible. In summary, the half-wavelength of the local cross-flow structural vibrations seems to be a significant parameter for the formation of cells.
A comparison of the lock-in/non-lock-in spanwise distribution and in-line/cross-flow motion synchronization patterns (figure 12) shows that counter-clockwise orbits are the most likely trajectories under the lock-in condition. This corroborates the experimental observations of Dahl et al. (2007) who reported that, for a rigid cylinder in uniform flow, regular ‘figure-eight’ motions as those described in the present study are generally associated with counter-clockwise orbits at lock-in. This point is
discussed from the fluid–structure energy transfer point of view in § 4.3.
To summarize, the lock-in region is located in the high-velocity zone and represents approximately 30 %, or more, of the total cylinder length. In this region, spatial intermittencies of lock-in can be observed. In the case of multi-frequency response, the wake is mainly synchronized with a single frequency in each particular location along the cylinder, that is mainly the locally predominant vibration frequency. The non-lock-in region is characterized by a cellular pattern as in the case of a stationary cylinder in shear flow.
4.2. Wake patterns
In this section, the wake patterns behind the cylinder are studied in light of the
lock-in/non-lock-in spanwise distribution identified in§ 4.1. The objective is to clarify
the interaction between wake structures and cylinder motions that leads in shear cross-flows to the formation of a mixed standing and travelling wave response.
For better visualization of the wake patterns, instantaneous iso-surfaces of spanwise
vorticity (ωz) are presented in figure 14. Only part of the computational domain is
plotted downstream of the cylinder: [0.6D, 32D], [0.6D, 25D] and [0.6D, 20D] for the
cases Rem= 110, Rem= 330 and Rem= 1100, respectively. The effect of the transition
to turbulence as Rem increases is visible in these plots.
For Rem= 110, the Reynolds number is in the range [30, 110]. The strongly
three-dimensional wake observed here, which is different than the wake behind a straight rigid cylinder in uniform flow, is due to the joint effects of shear flow, cylinder static bending due to the time mean component of the drag force and cylinder
vibrations. For Rem= 330, the Reynolds numbers are within the range where the
secondary instability, corresponding to a spanwise undulation of the von K ´arm ´an vortices, develops in the wake of a straight stationary cylinder in uniform flow. Different transition patterns have been reported in this context and are related to the characteristic wavelengths of the secondary instability. The A- and B-mode transition patterns have been studied both experimentally (e.g. Williamson & Roshko 1988;
10 20 30 40 50 60 70 80 90 100 110 120 130 140 150 160 170 180 z (c) (b) (a) x y z
Figure 14.Instantaneous iso-surfaces of spanwise vorticity (ωz) downstream of the cylinder
at (a) Rem= 110, ωz=± 0.13, (b) Rem= 330, ωz=± 0.3, and (c) Rem= 1100, ωz=± 0.8. The
arrows represent the linear shear oncoming flow. The dashed lines indicate the locations of the (x, y) planes presented in figure 18.
Williamson 1992) and numerically (e.g. Braza et al. 2001). Another transition pattern, the C-mode, has also been put forward in particular in the case of forced asymmetry (Zhang et al. 1995). In the present case, the secondary instability is affected by the previously mentioned sources of three-dimensionality, as illustrated in figure 14(b).