HAL Id: hal-00155517
https://hal.archives-ouvertes.fr/hal-00155517
Submitted on 18 Dec 2015
HAL is a multi-disciplinary open access
archive for the deposit and dissemination of
sci-entific research documents, whether they are
pub-lished or not. The documents may come from
teaching and research institutions in France or
abroad, or from public or private research centers.
L’archive ouverte pluridisciplinaire HAL, est
destinée au dépôt et à la diffusion de documents
scientifiques de niveau recherche, publiés ou non,
émanant des établissements d’enseignement et de
recherche français ou étrangers, des laboratoires
publics ou privés.
Demeter high resolution observations of the ionospheric
thermal plasma response to magnetospheric energy
input during the magnetic storm of November 2004
Elena Seran, H.U. Frey, M. Fillingim, Jean-Jacques Berthelier, R. Pottelette,
G. Parks
To cite this version:
Elena Seran, H.U. Frey, M. Fillingim, Jean-Jacques Berthelier, R. Pottelette, et al.. Demeter high
resolution observations of the ionospheric thermal plasma response to magnetospheric energy input
during the magnetic storm of November 2004. Annales Geophysicae, European Geosciences Union,
2007, 25 (12), pp.2503-2511. �10.5194/angeo-25-2503-2007�. �hal-00155517�
Ann. Geophys., 25, 2503–2511, 2007 www.ann-geophys.net/25/2503/2007/ © European Geosciences Union 2007
Annales
Geophysicae
Demeter high resolution observations of the ionospheric thermal
plasma response to magnetospheric energy input during the
magnetic storm of November 2004
E. S´eran1, H. U. Frey2, M. Fillingim2, J.-J. Berthelier1, R. Pottelette1, and G. Parks2
1CETP, 4 Avenue de Neptune, 94100 Saint-Maur, France
2SSL, University of California, Berkeley, USA
Received: 24 January 2007 – Revised: 25 October 2007 – Accepted: 14 November 2007 – Published: 2 January 2008
Abstract. High resolution Demeter plasma and wave ob-servations were available during one of the geomagnetic storms of November 2004 when the ionospheric footprint of the plasmasphere was pushed below 64 degrees in the midnight sector. We report here onboard observations of thermal/suprathermal plasma and HF electric field variations with a temporal resolution of 0.4 s, which corresponds to a spatial resolution of 3 km. Local perturbations of the plasma parameters at the altitude of 730 km are analysed with re-spect to the variation of the field-aligned currents, electron and proton precipitation and large-scale electric fields, mea-sured in-situ by Demeter and by remote optical methods from the IMAGE/Polar satellites.
Flow monitoring in the 21:00 and 24:00 MLT sectors
dur-ing storm conditions reveals two distinct regions of O+
out-flow, i.e. the region of the field-aligned currents, which often comprises few layers of opposite currents, and the region of velocity reversal toward dusk at sub-auroral latitudes.
Aver-age upward O+velocities are identical in both local time
sec-tors and vary between 200 and 450 m s−1, with an exception
of a few cases of higher speed (∼1000 m s−1)outflow,
ob-served in the midnight sector. Each individual outflow event
does not indicate any heating process of the thermal O+
pop-ulation. On the contrary, the temperature of the O+,
outflow-ing from auroral latitudes, is found to be even colder than that of the ambient ion plasma. The only ion population which is
observed to be involved in the heating is the O+ with
en-ergies a few times higher than the thermal energy. Such a population was detected at sub-auroral latitudes in the region of duskward flow reversal. Its temperature raises up to a few eV inside the layer of sheared velocity.
A deep decrease in the H+density at heights and latitudes,
where, according to the IRI model, these ions are expected to comprise ∼ 50% of the positive charge, indicates that the
Correspondence to: E. S´eran
thermospheric balance between atomic oxygen and hydrogen was re-established in favour of oxygen. As a consequence, the charge exchange between oxygen and hydrogen does not
effectively limit the O+production in the regions of the
elec-tron precipitation. According to Demeter observations, the
O+concentration is doubled inside the layers with upward
currents (downward electrons). Such a density excess cre-ates the pressure gradient which drives the plasma away from the overdense regions, i.e. first, from the layers of precipitat-ing electrons and then upward along the layers of downward current.
In addition, the downward currents are identified to be the source regions of hiss emissions, i.e. electron acoustic mode excited via the Landau resonance in the multi-component electron plasma. Such instabilities, which are often observed in the auroral region at 2–5 Earth radii, but rarely at iono-spheric altitudes, are believed to be generated by an electron beam which moves through the background plasma with a velocity higher than its thermal velocity.
Keywords. Ionosphere (Auroral ionosphere, Ionosphere-magnetosphere interactions, Particle precipitation)
1 Introduction
The main interest of this paper is the plasma modification in the auroral and sub-auroral regions of the Earth nightside ionosphere during a strong magnetic storm. Tail stretching and associated processes, like magnetic reconnection, cur-rent sheet instabilities, etc., which develop in the tail due to magnetic storms, have a direct impact on the nightside iono-sphere (Hultqvist et al., 1999). The energy, which is carried by intense, large-scale electric fields and also by energetic particles, is transformed at ionospheric altitudes into plasma acceleration, heating, ionisation of the neutral population, photoemissions, waves, etc. This transformation, which is
2504 E. S´eran et al.: Demeter high resolution observations height and time dependent, modifies the global balance of
the ionosphere. Part of the energy is carried back to the magnetosphere by the charged particles that escape from the Earth’s gravity due to their energization along the magnetic field lines. The ionospheric plasma is estimated to be a dom-inant source of the near-Earth magnetospheric plasma. The ion outflow from the ionosphere is strongly correlated (Yau et al., 1988) with the solar and magnetic activity. Total
out-flow from both hemispheres reaches ∼1026ions s−1 during
magnetic storms. A comprehensive review of a large variety of physical processes which are responsible for the plasma exchange between the ionosphere and magnetosphere is pre-sented in the book by Hultqvist et al. (1999) and the paper by Andr´e and Yau, (1997). However, some ambiguities remain in the mechanisms of the energization of thermal ionospheric plasma and its transport into the magnetosphere.
A few attempts were made to correlate the ion outflow with the precipitation of the auroral electrons and of the
ring current heavy ions. Yamamoto et al. (1993),
Hira-hara et al. (1998) concluded that the ion beams observed above 5000 km are often associated with bright, discrete au-roral signatures, contrary to the ion conics which were of-ten seen outside the regions of inof-tense electron precipitation or not even allied to any UV emission (Wilson et al., 2001). Wahlund and Opgenoorth (1989) emphasized that intense ion outflows are not correlated with an ion temperature enhance-ment, but rather with an increased ion production and
elec-tron heating. At sub-auroral latitudes, the enhanced O+
pro-duction and related upward ion acceleration at the heights be-tween 600 and 800 km are suggested (Yeh and Foster, 1990; Torr et al., 1974) to be associated with the ring current en-ergization. According to Torr et al. (1974), the intense ring
current O+ions, which precipitate into the ionosphere, can
produce large upward fluxes of energetic atomic oxygen in the top ionosphere. While moving upward these atoms are
ionised through collisions and transfer their energy to O+
ions.
In the present paper, we analyse the plasma disturbances observed in the regions of auroral precipitation and sub-auroral polarisation stream (SAPS). In the literature a west-ward reversal of plasma flow at sub-auroral latitudes is ref-erenced as “polarisation jets” (Galperin, 1973; Yeh and Fos-ter, 1990) or Subauroral Ion Drift (SAID) (Southwood and Wolf, 1978; Anderson et al., 2001) or Subauroral Polarisa-tion Stream (SAPS) (Oksavik et al., 2006). Such streams are formed during magnetically disturbed conditions, have the
latitudinal width of a few degrees, a speed of about 500 m s−1
and are suggested to be driven by the polarization electric field created at the outer boundary of the ring current due to a different depth of injection of the plasma sheet ions and electrons. The polarisation field mapped along the geomag-netic field lines to the subauroral ionosphere has a poleward direction and therefore drives duskward plasma convection.
We discuss the current structuring associated with the
large-scale electric field modulations, the variation of the O+
density correlated with the intensity of the precipitating elec-trons, upward electron acceleration and generated hiss,
es-cape of the H+from the top ionosphere and outflowing of
the cold O+population, plasma acceleration and heating of
the suprathermal ions in the sub-auroral regions.
We start in Sect. 2 with a brief description of the on-board instruments. An overview of the magnetospheric and then ionospheric modifications during the exceptionally long period of the magnetic storm is made in Sect. 3.1. Thor-ough analysis of the ionospheric plasma response on the en-ergy input during the substorm development is performed in Sect. 3.2. The main results are summarised in the Conclu-sions.
2 Instrumentation
In this paper we use the observations made by the UV cam-eras on board the IMAGE and Polar satellites and by the
plasma instruments on board the Demeter satellite. The
advantage of such a data set is that it provides quasi-simultaneous information about the energy input into the ionosphere and resulted plasma perturbations at the differ-ent ionospheric layers, i.e. at the heights of ∼150 km (UV imagers) and 730 km (Demeter).
Onboard imagers are the optical cameras (Torr et al., 1995; Mende et al., 2000) that detect the photoemissions in the ultra-violet frequency range. The IMAGE WIC and Polar LBHS are centred at 150 nm and the Polar LBHL at 170 nm. The Polar imagers both have about a 20 nm bandpass. The bandpass for the IMAGE FUV WIC is much larger, 40 to
50 nm. All these cameras detect the emissions of N2 due
to the impact of keV electrons. The Spectrographic Imager (SI/Image) is sensitive to the Doppler shifted Lyman H-alpha line emissions centred at 121.82 nm that is generated by en-ergetic protons.
The Demeter onboard instruments, the measurements of which are used in the present paper, are retarding (APR) and directional (ADV) ion analysers, electric field antenna (ICE) and fluxgate magnetometer.
The APR retarding analyser is designed to measure atomic and molecular ions with densities down to a few particles per
cm−3 and relative masses up to ∼56. The entrance of the
charged species into the analyser is controlled by the polari-sation grids. One of them is polarised at −12 V and does not allow the electrons with energies lower than 12 eV to reach the collector. The potential applied to another grid is posi-tive and gradually varies between 0 and ∼20 V during each sequence of measurements. The variation of the current col-lected by the analyser versus the grid potential is used to de-duce the ion plasma composition, the concentration of each species, the temperature and velocity parallel to the analyser axis.
The ADV, like APR, measures the current due to
pos-itive ions. But the grid potentials are fixed and the
E. S´eran et al.: Demeter high resolution observations 2505 Fig. 1 Fig. 2 Fig. 3 50 N : 21 MLT S : 24 MLT 6 : 25 UT 6 : 31 UT 6 6 60 50 60 50 24 24 18 18 S S
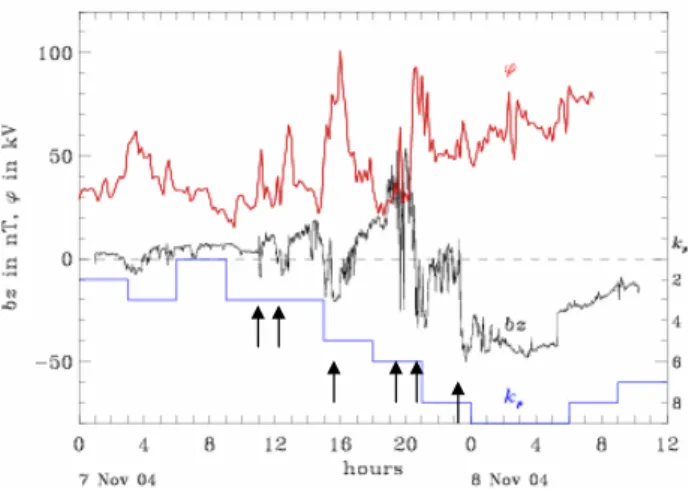
Fig. 1. Variation of (i) transpolar potential deduced from the
Super-DARN flow observations in the ionosphere, (ii) Kpindex calculated from the ground-based magnetic records and (iii) south-north com-ponent, Bz, of the interplanetary magnetic field measured on board the ACE satellite on 7 and 8 November 2004. Arrows indicate the southward rotation of the interplanetary magnetic field. Magnetic records in the solar wind are shifted by 1 h.
collector comprises four identical parts. Thus, the combina-tion of currents measured by each sub-collector allows one to estimate the component of flow velocity in the plane per-pendicular to the analyser axis (it points along the direction of the satellite motion). A detailed description of both instru-ments and models that are used to deduce the plasma param-eters can be found in the papers by S´eran (2003) and Berthe-lier et al. (2006a).
The electric field antenna (ICE) comprises four spherical monopoles. A combination of dc/ac potentials measured by each sphere allows one to deduce the electric field variations up to the frequency of 3.3 MHz (Berthelier et al., 2006b).
For overview purposes we use magnetic observations in the solar wind by the ACE satellite at the Lagrangian point L1, the ionospheric flow survey by the polar ground-based network of the SuperDARN HF radars and the magnetic records by sub-auroral ground-based magnetometers.
3 Observations and discussion
3.1 Magnetospheric/ionospheric response to the magnetic
storm
Observations which are presented in this paper were made on 7 and 8 November 2004 during a huge magnetic storm which commenced at ∼10:00 UT on 7 November and de-veloped over ∼28 h. The magnetic induction in solar wind measured on board the ACE spacecraft reached 50 nT and stayed at this level during almost 10 h. Under such con-ditions one can expect an intense mass-loading of the so-lar wind plasma and consequent plasma transport between
Fig. 1 Fig. 2 Fig. 3 50 N : 21 MLT S : 24 MLT 6 : 25 UT 6 : 31 UT 6 6 60 50 60 50 24 24 18 18 S S
Fig. 2. Two consecutive WIC images made in the night sector of the
Southern Hemisphere on 8 November. Distribution of the emission intensity is represented in MLT/magnetic latitude coordinates.
ionosphere and magnetosphere. In order to give an overview of the magnetospheric response during the storm develop-ment, we present in Fig. 1 the variations of (i) the transpolar potential, ϕ, deduced from the ExB flows measured by the SuperDARN coherent radars in the polar and auroral
iono-sphere of the Northern Hemiiono-sphere, and of (ii) the Kpindex,
calculated as the mean value of the horizontal magnetic field disturbances, recorded by ground-based magnetometers, to-gether with (iii) the variation of the south-north component,
Bz, of the interplanetary magnetic field, monitored by the
ACE spacecraft at the L1 point. For the purposes of compar-ison, the last parameter is shifted by 1 hour, which is approx-imately the propagation time of the solar wind plasma from ACE to Earth. Good correlation between the solar wind dy-namics and the magnetospheric response is clearly seen from the presented plots. Each rotation of the interplanetary
mag-netic field toward south (Bz<0) results in an enhancement
of the transpolar potential, the amplitude of which is mainly determined by the duration of the magnetic field southward orientation. The level of magnetospheric activity represented
by Kp follows the variation of the magnetic pressure in the
solar wind whenever Bz<0. The Kpindex reaches extremely
high levels, i.e. 8–9, at the end of 7 November, and stays high for ∼12 h. This results in the polar cap expansion and associ-ated displacement of the auroral oval to lower latitudes. The UV images recorded by the WIC camera on board the IM-AGE satellite at ∼06:30 UT perfectly illustrate this extension (Fig. 2). The emissions that indicate the auroral oval
posi-tion are localised below 60◦ magnetic latitude in the
night-side sector. During the whole period of storm development, the ADV analyser on board Demeter detects the flow rever-sal towards the dusk which occurs at sub-auroral latitudes in both 21:00 and 24:00 MLT sectors of Northern and Southern Hemispheres. SAPS boundaries are observed to displace
to-ward the equator by almost 15◦(see Fig. 3). This motion is
directly related to the storm intensification (i.e. Kpsurpasses
7).
Another component deduced from the ADV
measure-ments is the vertical velocity. Bursts of the upgoing O+(here
we call “burst” a vertical ion motion with the mean velocity
higher than 200 m s−1)were observed over the large
2506 E. S´eran et al.: Demeter high resolution observations Fig. 1 Fig. 2 Fig. 3 50 N : 21 MLT S : 24 MLT 6 : 25 UT 6 : 31 UT 6 6 60 50 60 50 24 24 18 18 S S
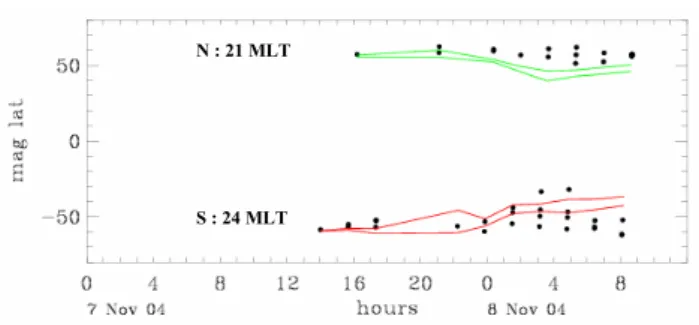
Fig. 3. Temporal variation of the latitudes which correspond to the
boundaries of duskward flows, as deduced from the ADV measure-ments at 21:00 and 24:00 MLT sectors of the Northern (green line) and Southern (red line) Hemispheres, respectively. Dots indicate the latitudes of the observed O+outflow with the mean velocity higher than 200 m s−1. The observations were made at the latitudes below magnetic 62◦.
of such events versus time is represented in Fig. 3 by dots. The difference between their locations with respect to the SAPS boundaries in two local time sectors is remarkable. In contrast to the broad extension of outflow events over auroral/sub-auroral latitudes at the midnight sector, the mid-evening outflow is limited to higher latitudes. We see at least two likely reasons for the outflow observations at the sub-auroral regions, i.e. (i) duskward electric field, which drives
the upgoing O+equatorward from the auroral source regions,
or/and (ii) sub-auroral source of the O+outflowing. The
av-erage vertical speed of the detected O+bursts is estimated to
vary between 200 and 450 m s−1in both magnetic local time
sectors, i.e. 21:00 MLT and 24:00 MLT, with the exception
of a few events with higher speed, i.e. ∼1000 m s−1. Each
of the high-speed events is mapped to the region of the field-aligned currents and corresponds to currents with densities
of 5–9 µA m−2, i.e. about 2 times higher than in the majority
of observed events.
3.2 Midnight observations during the conditions with
Kp=8
In order to place the observations in a global context, let us come back to Fig. 2, which shows two consecutive WIC ages made at 06:25 and 06:31 UT on 8 November. The im-ages, which cover almost entirely the high latitudes of the night part of the Southern Hemisphere, illustrate a growth phase of sub-storm development. A narrow spot of precip-itating electrons, which appears in the first image between 21:00 and 22:00 MLT, expands then towards the pole and dusk. This expansion is accompanied by an intensification of the emission in the post-midnight sector. The relative in-tensity of the emissions with two wavelenght, i.e. 150 and 170 nm, made by the UVI camera on board the Polar satel-lite, which covered the same region as the Image cameras and made its observations at the same time, allows to estimate
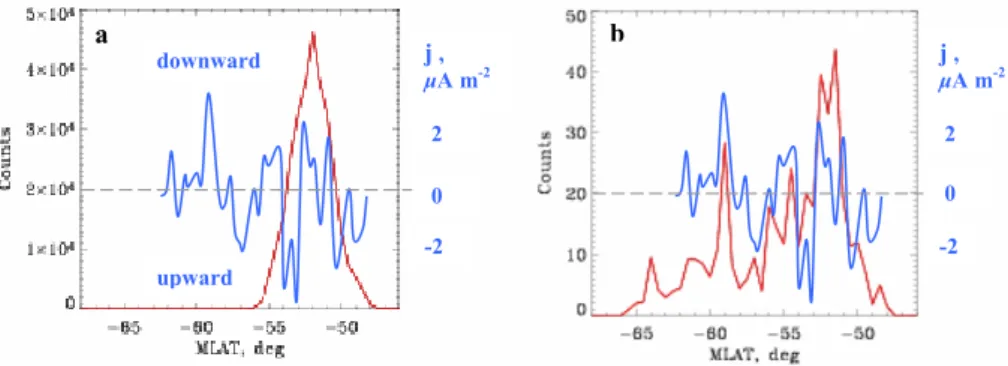
(using the method developed by Germany et al., 1998) the associated energies of the precipitating electrons. We found 9 and 5 keV in the 21:00 and 24:00 MLT sectors, respec-tively. During this time Demeter moves from higher latitudes toward the equator and makes the observations in the mag-netic sector between 00:02 and 00:22 MLT, i.e. it crosses the part of the auroral oval which is typically associated with the downward currents that connect the tail and the ionosphere. In order to compare the two data sets, the latitudinal distri-bution of the emissions detected by the WIC and SI12 cam-eras inside the magnetic local sector of the Demeter path are drawn in Figs. 4a and 4b, respectively, together with the den-sity distribution of the field-aligned currents deduced from the magnetic perturbations measured on board Demeter (blue line). The currents of both polarities (upward and downward, represented, respectively, by the negative and positive den-sity) co-exist and have approximately the same magnitude,
i.e. 2–3 µA m−2. The H-line emission (red line in Fig. 4b)
closely follows the latitudinal distribution of the field-aligned current, i.e. the emission intensity is increased inside the lay-ers of downward current and decreased in the regions of up-ward current. These observations give evidence that the pre-cipitating protons, which produce the emissions, follow the currents that circulate between the tail and the ionosphere
and probably contribute to them. The N2-emissions (red line
in Fig. 4a) encompass the magnetic latitudes between −56◦
and −48◦. With respect to these emissions the field-aligned
currents are observed in the broader region extending toward the pole. We note that the emission intensification does not exactly correlate with the upward current distribution. Such a discrepancy can have different reasons. We just mention a few of them, i.e.
– field-perpendicular diffusion of the energetic electrons due to collisions in the lower ionosphere;
– integration of emissions over the large interaction layer along the line of sight which significantly deviates from the local magnetic field direction;
– spatial and/or temporal variations in the distribution of thermospheric/ionospheric populations.
Under similar conditions Peterson et al. (1994) have shown that there is a significant increase in molecular ions, such
as NO+, O+2 and N+2. Unfortunately, the APR analyser on
board Demeter can not distinguish these species in the auro-ral regions which are populated with suprathermal electrons. Designed to measure the ion (positive) currents the analyser is protected by a negatively polarised grid from the electron collection. However, the grid potential, which is fixed at
−12 V, is not sufficient to stop the electrons with energies
higher than 12 eV. This results in the annulation of the pos-itive current produced by minor pospos-itively charged species whenever the flow of suprathermal electrons exceeds the flow of the minor ions. For example, in the considered case the
E. S´eran et al.: Demeter high resolution observations 2507 Fig. 4 Fig. 3 Fig. 5 a b 2 0 -2 j , µA m-2 2 0 -2 j , µA m-2 downward upward O+ O+ dusk-dawn velocity vertical velocity Mag lat - 60 -55 - 50 -45 -40 j
Fig. 4. Latitudinal distribution of the emission detected by the (a) WIC and (b) SI12 cameras (both are shown in red), together with the
field-aligned current deduced from the magnetic perturbations measured on board the Demeter (in blue). Upward and downward are represented, respectively, by the negative and positive current density. Both observations are made along the magnetic local sector comprised between 00:02 and 00:22 MLT, which is covered by Demeter when it moves from −55◦to −48◦magnetic latitude.
suprathermal electrons are estimated to comprise up to 20% of the total density. Therefore, the ions with density below
4000 cm−3are not resolved.
Contrary to a basic model of the current system, which predicts a couple of anti-parallel field-aligned currents flow-ing between the tail and ionosphere in the midnight sector, with the downward current poleward with respect to the up-ward current, several current layers are observed in the region
between the −62◦ and −48◦magnetic latitude. Each layer
with the width of ∼400 km comprises a pair of anti-parallel currents, i.e. downward poleward and upward equatorward. Such multi-structuring observed at the ionospheric heights most likely reflects the spatial configuration of the source re-gion or/and its temporal evolution.
How does the ionosphere respond to the energy/mass in-put? With the intention to find a response, let us analyse the variation of the thermal ion parameters inside the auroral and sub-auroral regions, taking advantage of Demeter observa-tions.
3.2.1 Ion plasma convection
Two components of the ion velocity, i.e. horizontal (in red) and vertical (in blue), measured by the ADV analyser in the plane perpendicular to the satellite orbital motion, are pre-sented in Fig. 5. The velocities are positive/negative when the ions move dawn/dusk and down/up, respectively. At the
latitudes poleward of −45◦, the ionospheric plasma flows
dawnward. This motion is associated with the plasma con-vection across the polar cap driven by the solar wind and subsequent plasma return along the magnetospheric bound-aries. The observed component of the convection speed (red
line) stays high, i.e. about 1000 m s−1, over the whole
re-gion that encompasses the field-aligned currents. This con-vection is associated with the equatorward electric field of
∼40 mV m−1. The large-scale changes in the azimuthal
ve-locity with amplitude of ∼200 m s−1correlate with the
cur-rent variation (green line in the same figure). Note that the
Fig. 4 Fig. 3 Fig. 5 a b 2 0 -2 j , µA m-2 2 0 -2 j , µA m-2 downward upward O+ O+ dusk-dawn velocity vertical velocity Mag lat - 60 -55 - 50 -45 -40 j
Fig. 5. Two components of the ion plasma velocity observed at
730 km by ADV when Demeter crosses the auroral oval. Red and blue stand for the horizontal and vertical velocities, respectively, measured in the plane perpendicular to the satellite orbital mo-tion. Velocities are positive/negative when plasma moves toward dawn/dusk and downward/upward.
maximum current intensity, in general, corresponds to the maximum velocity gradient, but the magnetic induction, |B|, does not. Thus, these waves are non-compressional and are presumably driven by the field-aligned currents.
The flow reversal toward dusk is observed at latitudes
equatorward of −45◦and has the latitudinal width of about
800 km with a high speed channel which extends over 250 km. Observed duskward flows are suggested to be driven by the polarisation electric field established at the outer edge of the ring current and caused by a deeper injection of the plasma sheet ions into the ring current with respect to the electrons. Thus, the typical scale of such charge separation
is of the order of O+gyrodiameter, i.e. about 500–1000 km.
Mapped to the ionospheric altitudes this field has a poleward direction, which is opposite to that which drives the post mid-night convection.
2508 E. S´eran et al.: Demeter high resolution observations Fig. 6 b O+ j IRI O+ O+ Te Ti Tn a c Mag lat - 60 -55 - 50 -45 -40 downward upward O+ hot Maxwell 2% n(cold) T=10Tc=2.5 eV O+ cold Maxwell nc= 2 ·1010 m-3 Tc=0.25 eV 6:29:34 UT O+ cold Maxwell nc= 2 ·1010 m-3 Tc=0.23 eV O+ hot Maxwell 1.5% n(cold) T=20Tc=4.6 eV 6:30:15 UT Fig.7
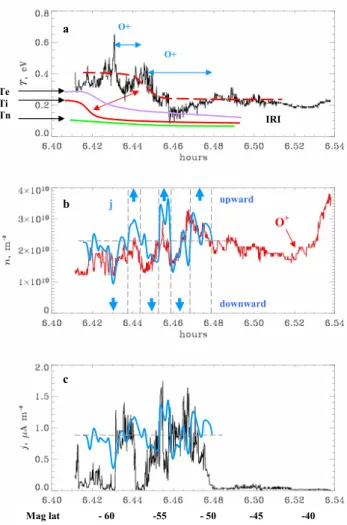
Fig. 6. Plasma parameters measured by the APR analyser during
the same period as in Fig. 5, i.e. (a) O+ temperature (in black), together with the electron (in violet), ion (in red) and neutral (in green) temperatures deduced from the IRI model; (b) O+density (in red), together with the current density (in blue), as deduced from the magnetic perturbations; (c) current density due to the electrons with energy higher than 12 eV. Regions of O+outflow are indicated by horizontal arrows. The layers of anti-parallel currents are high-lighted by vertical dashed lines and the current direction is indicated by arrows.
3.2.2 Thermal balance
Presented in Fig. 6a is the O+ temperature deduced from
the APR data, together with ion, electron and neutral tem-peratures given by the IRI model. The unusually high (with
respect to the model prediction) average O+temperature is
most likely caused by the unusually long and intense period of the magnetic storm. We can cite few mechanisms which might contribute to the heating of the nightside high-latitude ionosphere, i.e.
– electron precipitation with consecutive heating of ther-mal electrons in the lower ionosphere;
– frictional heating in the regions of strong convection; – heat convection from the day-to nightside ionosphere,
driven by the plasma convection across the polar cap; – solar wind entry along the open field lines.
But there are other sources which also contribute to the ther-mal state of the ionosphere. In the example shown, signifi-cant temperature variations are observed in the regions that envelope the layers of the field-aligned currents. A deep tem-perature decrease around ∼6.435 and 6.46 corresponds to
the moments of the O+outflowing. At the Demeter heights
the thermal exchange between the outflowing and ambient plasma will likely result in a cooling of local plasma. Two thermal regimes are clearly distinguished from both curves presented results of modelling and observations. The ion temperature is significantly higher in the regions of the polar cap and jumps down across the current layers.
A remarkable feature observed at the sub-auroral latitudes and associated with the SAPS boundaries is the heating of the suprathermal population. Typical observations of such heating are shown in Fig. 7a, b. Distribution of the cur-rent collected by the APR detector versus potential applied to the retarding grid illustrates the instrument response in
the plasma with two co-existent O+ species, i.e. cold with
a temperature of fractions of eV and warm with a
temper-ature of a few eV. The fact that the heated O+ consists of
∼2% (i.e. ∼400 cm−3)thermal ions and that the main part
of the distribution function stays at the same temperature demonstrates that only suprathermal particles with thermal
velocities higher than 2VT are involved in the heating
pro-cess. Two examples presented in Fig. 7 correspond to the moments indicated by the arrows in Fig. 5, i.e. outside a and inside b the SAPS convection. Suprathermal heating com-mences at about 6.49, i.e. at the edge of the layer with strong
sheared velocity. The temperature of suprathermal O+ is
gradually amplified and reaches ∼5 eV. Of course, the ob-served 5 eV is a lower limit of energy required to overcome the Earth’s gravity. Nevertheless, this example indicates a
potential source of the O+outflowing, i.e. heating associated
with the flow reversal at the sub-auroral latitudes.
3.2.3 Plasma composition and density
According to the IRI model, two major positive species,
i.e. O+and H+, are expected to populate the considered
lat-itudes and heights of the mid-night ionosphere. The density
of O+, which is the dominant ion below 700 km, drops down
with height and the charge neutrality at the higher altitudes
is mainly maintained by the H+species. At 700 km the H+
is expected to comprise ∼50% of the positive charge. How-ever, this ion is not distinguished in the APR measurements
and therefore its density does not exceed ∼1% of O+.
Pos-sible displacement of the H+at the higher altitudes will
re-sult in the re-establishment of the ionospheric height scales
E. S´eran et al.: Demeter high resolution observationsFig. 6 2509 b O+ j IRI O+ O+ Te Ti Tn a c Mag lat - 60 -55 - 50 -45 -40 downward upward O+ hot Maxwell 2% n(cold) T=10Tc=2.5 eV O+ cold Maxwell nc= 2 ·1010 m-3 Tc=0.25 eV 6:29:34 UT O+ cold Maxwell nc= 2 ·1010 m-3 Tc=0.23 eV O+ hot Maxwell 1.5% n(cold) T=20Tc=4.6 eV 6:30:15 UT Fig.7
Fig. 7. Current distribution versus potential applied to the retarding grid measured by APR shows two populations of the O+species, i.e. cold and warm. Moments of observations are indicated by arrows in Fig. 5. Temperature of the warm population is gradually increased inside the SAPS boundary layer.
and thermospheric balance between oxygen and hydrogen.
In such a situation the charge exchange between O+and
hy-drogen does not effectively limit the O+ production in the
regions of the electron precipitation. Thus, one can expect
an increase in the O+concentration in the layers of upward
current. Indeed, shown in Fig. 6b, the variation of the O+
density (in red) together with the field-aligned current den-sity (in blue) confirms this conclusion. In order to make a straightforward comparison of the two plots, the sign of the current was changed to the opposite with respect to that in Figs. 4 and 5. Thus, a positive value means an upward cur-rent.
As explained before, the APR analyser, which was de-signed to measure positively charged species, is not protected from the collection of suprathermal electrons with energies higher than 12 eV. In the auroral regions, where this pop-ulation is significant, the high energy electrons that reach the analyser create the negative current which compensates the current carried by the minor ion populations. The nega-tive current consists of up to 20% of the posinega-tive ion current. Plotting the electron current densities deduced from the APR data (black line in Fig. 6c) and those estimated from the mag-netometer measurements (blue line), we note a similarity in their variations. Each enhancement of the electron current deduced from the retarding analyser is associated with the upward current seen by the magnetometer. Observed dif-ferences in amplitude and variations could be caused by at least two reasons. First, the magnetic perturbations which are used to deduce the total current are not necessarily in-duced uniquely by the crossed current structure, but reflect an ensemble of the nearby currents. In contrast, the nega-tive current collected by the ion analyser is due to the local electron flow that reaches the collector. Second, the angle between the analyser axis and the magnetic field varies
be-tween 85 to 75◦ during the considered period. Having an
acceptance angle of 106◦the analyser will collect the
elec-trons with a velocity vector which consists of an angle larger
than 22◦with respect to the magnetic field direction.
There-fore, the collected negative current contains two components,
Fig. 8 Fig. 9 ∇ ∇ ∇ ∇ n e e O+ j -15 -10 -8 log(mV2 /m2 /Hz) (a) O+ fLH(H+) fpe , fce upward downward hiss
Fig. 8. HF electric field variations in (30 kHz, 3.3 MHz) frequency
range during the same period as in Figs. 5, 6. Funnel-shaped fre-quency time structures associated with hiss emissions are indicated by dashed lines. Solid line stands for the field-aligned current den-sity; positive for the upward and negative for downward current di-rection. Regions of O+outflow are indicated by horizontal arrows.
i.e. the first is due to the field-aligned electron flow and the second is due to the field–perpendicular motion. The second component does not contribute to the total current, since in the case of an isotropic field perpendicular particle distribu-tion it is compensated by the opposite electron modistribu-tion.
3.2.4 O+outgoing
The auroral region is characterised not only by the field-aligned motion of light charged particles, like electrons and
protons, but also by heavier ions, like O+. Indicated as a
hatched area in Fig. 5, the outflowing O+is observed inside
the region of the field-aligned currents, has the upward speed
of 300 m s−1 and is essentially colder than the surrounding
ion plasma (see Fig. 6a and previous discussion). What is the source of this motion? Detailed analysis of the plasma dynamics given before, is in favour of outflowing caused by the plasma pressure gradients inside the current region, with
2510 E. S´eran et al.: Demeter high resolution observations
Fig. 8
Fig. 9
∇
∇
∇
∇ n
e
e
O+
j
-15 -10 -8
log(mV
2/m
2/Hz)
a
O+f
LH(H+)
f
pe, f
ceupward
downward
hiss
Fig. 9. A schematic drawing which illustrates two pairs of
anti-parallel currents, enhanced O+production inside the regions of the electron precipitation and O+outflowing from the overdense layers.
few a layers of opposite currents. The O+, driven away from
the overdense layers of upward current, is then confined in the layer of downward current and pushed upward. The fact
that in spite of a strong convection, the upgoing O+observed
in the regions of the field-aligned currents indicates that the plasma mainly drifts along the current layers and/or the up-ward acceleration takes place not far from the heights of the Demeter observations (Yeh and Foster, 1990).
3.2.5 Waves
Supplementary information about the plasma processes de-veloped in the auroral region can be taken from the HF elec-tric field measurements. Remarkable wide-band emissions with the upper cutoff at 500 kHz are observed (Fig. 8) in the moments when the satellite crosses the current layers. The excited frequencies lie well below the local electron cyclotron and plasma frequencies and well above the ions frequencies. The spectral width of the emissions is about 100 kHz at the flanks of the current region and grows up to 400 kHz in the vicinity of layers with downward current. Such waves have the properties similar to those observed in
the auroral regions at 2–5 RE, referred to as hiss (see, for
ex-ample, Gurnett et al., 1983; Lin et al., 1984), and are believed to be generated locally by the upgoing electron beams. The distinctive funnel-shaped frequency time structure of hiss is explained (Lin et al., 1984) as a propagating effect, i.e. the group velocity of the low frequency waves points along the magnetic field lines and of the high frequency waves is di-rected at larger angles with respect to the field lines associ-ated with the beam motion. A large spectral width of the observed emissions is probably due to the large source ex-tension along the field lines. In the multi-component elec-tron plasma the elecelec-tron acoustic instability is excited via the Landau resonance and has the upper frequency cutoff which
approximately corresponds to the plasma frequency of the secondary electron population (Tokar and Gary, 1984). The observed upper frequency cutoff of 500 kHz gives the density
estimate of ∼3×103cm−3, which represents ∼15% of the
lo-cal plasma density at 700 km. The growth of the hiss mode requires that the resonance velocities lie in the region with a sufficiently positive derivative of the distribution function, i.e. above the thermal electron speed.
4 Conclusions
The principal purpose of this paper is to take advantage of si-multaneous IMAGE-Polar-Demeter observations and to per-form a detailed analysis of the ionospheric modifications due to intense energy/mass exchange during substorm develop-ment. Remote observations made by the UV cameras on board IMAGE and Polar give quasi-instantaneous images of photoemissions produced by the collisions and charge ex-changes between energetic particles of magnetospheric ori-gin and the species that populate the low thermosphere. Even if the emission intensities are highly representative, since they carry indirect information related to the energy and in-tensity of the precipitating electrons and protons (or, more precisely, their energetic tails), only a small part of the input energy goes into photonemission. The main part of the en-ergy is released into collisions, plasma acceleration and heat-ing, which subsequently result in a change of the entire con-ducting layer and in return energy/mass back to the magne-tosphere. In-situ observations on board the Demeter satellite in the upper ionosphere allow to study the plasma variations in the regions of the field-aligned currents and sub-auroral polarisation stream.
Simultaneous measurements by Demeter and IMAGE demonstrate that the observed current variations are caused by spatial structuring of the source region and are not tem-poral or propagation effects. Thus, the field-aligned current region is revealed to comprise few layers of anti-parallel
cur-rents. Enhanced O+ production inside the regions of the
electron precipitation creates the plasma pressure gradients that causes the ions to move away from the overdense lay-ers, i.e. first, perpendicular to the current sheet boundaries and then along and upward. This scenario is illustrated by a schematic drawing presented in Fig. 9. Temperature of
out-flowing O+ is found to be colder than that of the ambient
plasma.
Hiss emissions, which are regularly observed in the re-gions of the intense field-aligned currents with the source located inside the layers of the downward current, give the indications about the upward motion of the secondary elec-tron population, with velocities higher than the elecelec-tron
ther-mal speed, i.e. ∼300 km s−1. Generation of these emissions
in the ionosphere is a distinguished signature of intense elec-tron exchange between the magnetosphere and ionosphere.
E. S´eran et al.: Demeter high resolution observations 2511 Observed in the region of sub-auroral polarisation stream,
the suprathermal O+ is produced inside the SAPS
bound-ary layer, which is characterised by strong sheared veloc-ities. The suprathermal population is heated up to a few eV, i.e. temperatures which are typical for the plasmaspheric ions. Thus, we suggest that the reversal in plasma convection driven at sub-auroral latitudes by the ring current polarisation
field can be considered as a potential source region of the O+
outflow from the ionosphere.
Acknowledgements. We thank the Demeter team for the high
qual-ity work. We want to thank J. Jasperse and our referees for helpful comments, questions and suggestions.
Topical Editor M. Pinnock thanks W. K. Peterson and K. Kau-ristie for their help in evaluating this paper.
References
Anderson, P. C., Carpenter, D. L., Tsuruda, K., Mukai, T., and Rich, F. J.: Multisatellite observations of rapid subauroral ion drifts (SAID), J. Geophys. Res., 106, 29 585–29 599, 2001.
Andr´e, M. and Yau, A.: Theories and observations of ion energiza-tion and outflow in the high latitude magnetosphere, Space Sci. Rev., 80, 27–48, 1997.
Berthelier, J.-J., Godefroy, M., Leblanc, F., S´eran, E., et al.: IAP, the thermal plasma analyzer on Demeter, Planet. Space Sci., 487– 501, 2006a.
Berthelier, J.-J., Godefroy, M., Leblanc, F., et al.: ICE, the electric field experiment on Demeter, Planet. Space Sci., 54, 456–471, 2006b.
Galperin, Y. I., Ponomarov, Y. N., and Zosinova, A. G.: Direct mea-surements of ion drift velocity in the upper ionosphere during a magnetic storm, Cosmicheskie Issled., 11, 273–283, 1973. Germany, G. A., Spann, J. F., Parks, G. K., Brittnacher, M. J.,
Elsen, R., Chen, L., Lummerzheim, D., and Rees, M. H.: Au-roral Observations from the POLAR Ultraviolet Imager (UVI), AGU Monograph, “Encounter Between Global Observations and Models in the ISTP Era”, edited by: Horwitz, J., Gallagher, D., and Peterson, B., 1998.
Gurnett, D. A., Shawhan, S. D., and Shaw, R. R.: Auroral hiss, Z mode radiation and auroral kilometric radiation in the polar magnetosphere: DE-1 observations, J. Geophys. Res., 88, 329– 340, 1983.
Hirahara, M., Horwitz, J. L., Moore, T. E., Germany, G. A., Spann, J. F., Peterson, W. K., Shelley, E. G., Chandler,M. O., Giles, B. L., Craven, P. D., Pollock, C. J., Gurnett, D. A., Pickett, J. S., Persoon, A. M., Scudder, J. D., Maynard, N. C., Mozer, F. S., Brittnacher, M. J., and Nagai, T.:Relationship of topside iono-spheric ion outflows to auroral forms and precipitation, plasma waves and convection observed by Polar, J. Geophys. Res., 103, 17 391–17 410, 1998.
Hultqvist, B., Andr´e, M., Christon, S. P., Paschmann, G., and Sibeck,D.G.: Contributions of different source and loss pro-cesses to the plasma content of the magnetosphere, Space Sci. Rev., 88, 355–372, 1999.
Lin, C. S., Burch, J. L., Shawhan, S. D., and Gurnett, D. A.:Correlation of auroral hiss and upward electron beams near the polar cusp, J. Geophys. Res., 89, 925–935, 1984.
Mende, S. B., Heetderks, H., Frey, H., et al.: Far ultraviolet imaging from the IMAGE spacecraft, Space Sci. Rev., 91, 243–270, 2000. Oksavik, K.,Greenwald, R. A , Ruohoniemi, J. M., Hairston, M. R., Paxton, L. J., Baker, J. B. H., Gjerloev, J. W., and Barnes, R. J.: First observations of the temporal/spatial vari-ation of the sub-auroral polarizvari-ation stream from the Super-DARN Wallops HF radar, Geophys. Res. Lett., 33, L12104, doi:10.1029/2006GL026256, 2006.
Peterson, W. K., Abe, T., Fukunishi, H., Greffen,M. J., Hayakawa, H., Kasahara, Y., Kimura, I., Matsuoka, A., Mukai, T., Nagat-suma, T., Tsuruda, K., Whalen, B. A., and Yau, A. W.: On the sources of energization of molecular ions at ionospheric alti-tudes, J. Geophys. Res., 99, 23 257–23 274, 1994.
S´eran, E.: Reconstruction of the ion plasma parameters from the current measurements: Mathematical tool, Ann. Geophys., 21, 1159–1166, 2003,
http://www.ann-geophys.net/21/1159/2003/.
Southwood, D. J. and Wolf, R. A. : An assessment of the role of pre-cipitation in magnetospheric convection, J. Geophys. Res., 83, 5227–5232, 1978.
Tokar, R. L. and Gary, S. P.: Electrostatic hiss and the beam driven electron acoustic instability in the dayside polar cusp, Geophys. Res. Lett., 11, 1180–1183, 1984.
Torr, M. R., Walker, J. C. G., and Torr, D. G.: Escape of fast oxy-gen from the atmosphere during geomagnetic storm, J. Geophys. Res., 79, 5267–5271, 1974.
Torr, M. R., Torr, D. G., Zukic, M., Johnson, R. B., Ajello, J., Banks, P., Clark, K., Cole, K., Keffer, C., Parks, G., Tsurutani, B., and Spann, J.: A far ultraviolet imager for the International Solar-Terrestrial Physics mission, Space Sci. Rev., 71, 329–383, 1995.
Walhund, J. E. and Opgenoorth, H. J.: EISCAT observation of strong ion flows from the F-region ionosphere during auroral ac-tivity, in: Preliminary results, Geophys. Res. Lett., 16, 727–730, 1989.
Wilson, G. R., Ober, D. M., Germany, G. A., and Lund, E. J.: The relationship between suprathermal heavy ion outflow and auroral electron energy deposition: Polar/UVI and FAST, J. Geophys. Res., 106, 18 981–18 994, 2001.
Yamamoto, T., Kaneda, E., Hayakawa, H., Mukai, T., Matsuoka, A., Machida, S., Fukunish, H., Kaya, N., Tsuruda, K., and Nishida, A.: Meridional structures of electric potentials relevant to pre-midnight discrete auroras: A case study from Akebono measure-ments, J. Geophys. Res., 98, 11 135–11 151, 1993.
Yau, A. W., Peterson, W. K., and Shelley, E. G.: Quantitative parametrization of energetic ionospheric ion outflow, in: Mod-eling of Magnetospheric Plasma, edited by: Moore, T. E. and Waite, J., Geophysics Monograph Series, 44, AGU, 211–217, 1988.
Yeh, H.-C. and Foster, J. C.: Storm time ion outflow at mid-latitude, J. Geophys. Res., 95, 7881–7891, 1990.