HAL Id: hal-02871273
https://hal.sorbonne-universite.fr/hal-02871273
Submitted on 17 Jun 2020
HAL is a multi-disciplinary open access
archive for the deposit and dissemination of
sci-entific research documents, whether they are
pub-lished or not. The documents may come from
teaching and research institutions in France or
abroad, or from public or private research centers.
L’archive ouverte pluridisciplinaire HAL, est
destinée au dépôt et à la diffusion de documents
scientifiques de niveau recherche, publiés ou non,
émanant des établissements d’enseignement et de
recherche français ou étrangers, des laboratoires
publics ou privés.
Correlation between UV resilience and wavelength of
narrow diffuse interstellar bands
A. Omont, H. Bettinger
To cite this version:
A. Omont, H. Bettinger. Correlation between UV resilience and wavelength of narrow diffuse
inter-stellar bands. Astronomy and Astrophysics - A&A, EDP Sciences, 2020, 637, pp.A74.
�10.1051/0004-6361/201937071�. �hal-02871273�
Astronomy
&
Astrophysics
https://doi.org/10.1051/0004-6361/201937071© A. Omont and H. F. Bettinger 2020
Correlation between UV resilience and wavelength of narrow
diffuse interstellar bands
A. Omont
1and H. F. Bettinger
21Sorbonne Université, UPMC Université Paris 6 and CNRS, UMR 7095, Institut d’Astrophysique de Paris, France e-mail: [email protected]
2 Institut für Organische Chemie, Universität Tübingen, Auf der Morgenstelle 18, 72076 Tübingen, Germany e-mail: [email protected]
Received 6 November 2019 / Accepted 8 March 2020
ABSTRACT
Carriers of diffuse interstellar bands (DIBs) still need to be identified. In a recent paper, we reported a correlation between the DIB wavelength and the apparent UV resilience (or boost) of their carriers. We proposed that this might be an indication of the important role of conjugated elongated molecules among the DIB carriers. The aim of this paper is to further understand the origin of this correlation. The analysis of 509 optical DIBs on the lines of sight of HD 183143 and/or HD 204827 reported in the literature shows that this correlation mainly implies the 386 narrow DIBs with a band width <1.1 Å, which include most of the identified DIBs of the C2and ζ families, while the majority of the 123 broader DIBs, including the identified σ DIBs, do not display such a correlation. We present a possible origin of this correlation from very strong bands of large conjugated elongated molecules, such as carbon chains, polyacenes, or other catacondensed polycyclic aromatic hydrocarbons. The total amount of carbon contained in all the carriers of these narrow DIBs is a very small fraction of the interstellar carbon if their oscillator strengths are ≥1. The amount of carbon locked in the carriers of the broader DIBs is higher, especially if their oscillator strengths are significantly weaker.
Key words. astrochemistry – ISM: molecules – ISM: lines and bands – dust, extinction – line: identification – line: profiles
1. Introduction
Identification of carriers of the diffuse interstellar bands (DIBs) remains an outstanding problem in astrophysics (see e.g.Herbig 1975,1995; Sarre 2006; Tielens & Snow 1995; and especially
Cami & Cox 2014; see also e.g.Omont 2016; Fan et al. 2017,
2019; Cami et al. 2018for more recent references), and to this day, only five bands have been attributed to an identified carrier, C+60(Foing & Ehrenfreund 1994;Campbell et al. 2015,2016). It is generally agreed that DIB carriers probably are large carbon-based molecules (with ∼10–100 atoms) in the gas phase, such as polycyclic aromatic hydrocarbons (PAHs, e.g.Salama et al. 1996;Salama 2008;Salama & Ehrenfreund 2014), long carbon chains (e.g. Zach & Maier 2014a,b) or fullerenes (e.g. Omont 2016).
In a recent paper (Omont et al. 2019, referred to here-after as OBT19) we investigated more specific possible carriers among PAHs, addressing the case of polyacenes, C4N+2H2N+4,
with N ∼ 10–18 fused rectilinear aligned hexagons. Polyacenes are attractive DIB carrier candidates because their high sym-metry and large linear size allow them to form regular series of bands in the visible range with strengths exceeding that of most other PAHs, as confirmed by recent laboratory results up to undecacene (C46H26); seeShen et al.(2018) and references
therein.
Polyacenes with very strong bands in the DIB spectral domain are just at the limit of stability against UV photodissoci-ation. They are part of the prominent PAH family of interstellar carbon compounds, meaning that only ∼10−5 of the total PAH
abundance is enough to account for a medium-strength DIB. So far, no definite inconsistency has been identified that would pre-clude polyacenes from being the carriers of some DIBs with
medium or weak strength, including the so-called C2 DIBs.
However, additional experimental data about the values of the gas-phase wavelengths of the optical bands of polyacenes are needed for firm conclusions.
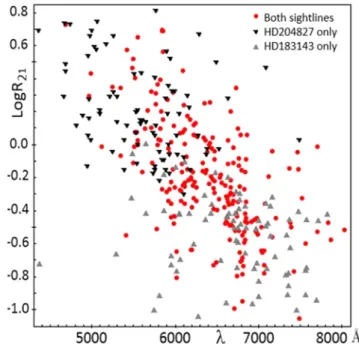
In addition to their very strong optical bands and their high A rotation constant, which could fit the DIB rotation profiles, one of the main arguments supporting such elongated PAHs as DIB carriers is that they fit the general correlation that we found between the DIB wavelength and the apparent UV resilience of their carrier remarkably well (see Fig. 4 of OBT19; this is reproduced here in Fig.5).
This correlation was established by studying the ratio R21of
the equivalent widths of each DIB in two sightlines, HD 183143 and HD 204827, with different UV intensities. It is thought that R21 = EW(204827)/EW(183143) reflects the DIB carrier
sensitivity to destruction (or formation) by interstellar UV radi-ation. Interstellar lines of C2 molecules have not been detected
towards HD 183143, while a very high value of N(C2)/E(B − V)
is observed towards HD 204827, as well as C3 and high
col-umn densities of diatomics (Thorburn et al. 2003;Hobbs et al. 2009,2008). This is suggestive of relatively weak ambient radi-ation fields and/or shielded environments (see e.g.Welty 2014;
Welty et al. 2014). The higher EW(5797)/EW(5780) DIB ratio values, such as are observed towards HD 204827, are found only for lower inferred UV intensities (Welty 2014). This λ/UV cor-relation could be explained by the combined dependence on the wavelength of the strong optical bands of polyacenes and the UV photodissociation on their length.
The aim of this paper is to further explore this correlation for the different classes of DIBs. We more specifically address the dependence on the DIB band width because it was shown that the correlation is well obeyed by the prominent members
A74, page 1 of11
of two main DIB families, ζ and C2, which have
characteris-tic narrow widths. As pointed out in OBT19, various elongated molecules with π electron conjugated systems should display a similar correlation. We here explore this possibility especially for the catacondensed PAHs and the long carbon chains.
The paper is organised as follows. Section2recalls the width distribution of the DIBs and proposes an optimal breakdown into two width classes that are compatible with the established DIB families. Section3analyses the observed λ/UV correlation for the two DIB classes by studying the wavelength dependence of the strength ratio R21of each DIB in HD 183143 and HD 204827.
This section establishes that the λ/UV correlation is dominated by the narrow DIBs, but not the broader ones, including the σ DIBs. The properties of various π electron conjugated systems are recalled in Sect. 4 in order to discuss the likelihood that they might account for the observed correlation. The possible role of the predominance of cationic PAH bands at large λ is also considered, and it is shown that the infrared DIBs do not follow the general λ/UV correlation. Finally, Sect.5summarises the possible amount of interstellar carbon that is locked up in the different classes of DIBs depending on the values of their oscillator strengths. Section6connects the total DIB absorption and the amount of interstellar visible continuum absorption due to PAHs.
2. Narrow and broad DIBs
A key property of the DIBs is their grouping into broad “fam-ilies” whose behaviour depends on the interstellar environment and especially on the UV intensity (Krelowski & Walker 1987;
Herbig 1995). The strengths (equivalent widths) of the three main DIB families, ζ, σ, and C2, are correlated with the amount
in the line of sight of H2(see Fig. 13 ofLan et al. 2015), HI, and
C2, respectively (e.g.Herbig 1995;Cami et al. 1997;Vos et al. 2011;Ensor et al. 2017; Fan et al. 2017;Thorburn et al. 2003;
Ka´zmierczak et al. 2010;Elyajouri et al. 2018).
The general correlation apparent in Fig. 4 of OBT19 (repro-duced in Fig.5) between the UV sensitivity and the wavelength of the DIBs mixes several DIB families, which each have a dif-ferent dependence on the UV intensity. One obvious way to learn more about the origin of this correlation is to determine how it specifically affects the main DIB families. The correlation might be more pronounced for the broad class of narrow DIBs that includes the C2 and ζ DIBs, which both display similar band
profiles (e.g.Elyajouri et al. 2018).
However, the actual classification of most DIBs into such families remains difficult because their correlations are complex and their spectra are noisy. In addition to the specific case of the C2 DIBs, no more than 12 strong DIBs have a well-established
membership in each of the ζ and σ families (Table1). In order to better understand the λ-UV correlation, it is therefore much simpler to address its dependence on the DIB width, which is relatively easy to measure for all DIBs (e.g. Fan et al. 2019) and is related to the families. It is known that most of the ζ DIBs display a structured narrow profile (e.g.Herbig 1995;Sarre 2014 and references therein), similar to that of the C2 DIBs
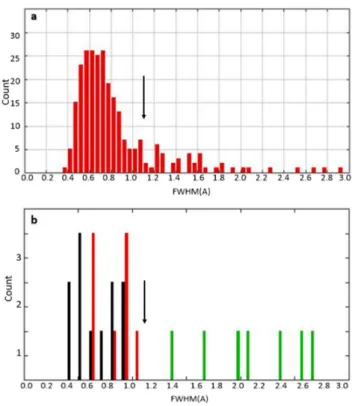
(Elyajouri et al. 2018), while the σ DIBs have a broader profile (Fig.1b).
The histogram of the bandwidth full width at half-maximum (FWHM), taken from the Apache Point catalogue ofFan et al.
(2019), of the 509 DIBs detected in the sightlines of HD 183143 (number 1) or HD 204827 (number 2) by Hobbs et al.(2009,
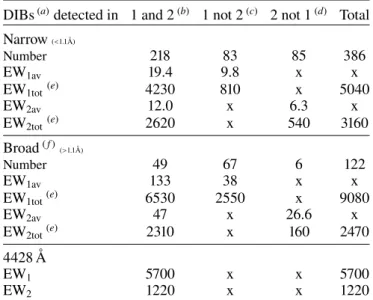
2008) and confirmed in Fan et al. (2019), is displayed in Fig. 1a, while the histograms of their equivalent widths, EW1
Table 1. Some identified DIB family members.
Family DIBs(Å) References
σ 4428 4502 4762 4885 5487 5705 1 5778 5780 5845 6010 6204 6283 ζ 5494 5545 5797 5850 6196 6376 2 6379 6614 C2 4727 4969 4985 5176 5419 5513 3 5542 5546 5763 5793 6729
References. 1.Lan et al.(2015) (Fig. 13; the 5845 Å DIB has been excluded because it is an ill-defined blend) 2. Ensor et al. (2017)
3. Thorburn et al. 2003, DIBs detected in both HD 183143 and
HD 204827 (Hobbs et al. 2009, 2008) and confirmed by Fan et al.
(2019).
Fig. 1.Panel a: histogram of the values of the band width FWHM (Å)
of the DIBs detected in the lines of sight of HD 183143 or HD 204827
(Hobbs et al. 2009, 2008) that have recently been confirmed in the
Apache Point catalogue ofFan et al.(2019) for an FW H M < 3 Å (out of 509 DIBs, there are 19 with FW H M > 3 Å). Panel b: histogram of the values of the band width of the DIBs, identified as C2(black), ζ (red), and σ (green) (Table1), detected in the lines of sight of HD 183143 or HD 204827, for FW H M < 3 Å (out of 12 σ DIBs, there are 4 with FW H M > 3 Å). The vertical arrows show the adopted limit, 1.1 Å, for the separation between “narrow” and “broad” DIBs.
and EW2, respectively, are shown in Fig. 2. The FWHM histogram of Fig. 1a shows an accumulation of narrow DIBs with FW H M <∼ 1 Å. However, there is no clear-cut sharp tran-sition in the histogram between narrow and broad DIBs. In Table2 we therefore chose a somewhat arbitrary definition of “narrow” DIBs, that is, an FW H M < 1.1 Å, because the his-togram (Fig.1a) shows a shallow minimum for this value. Other definitions are possible, with slightly different values of the
Fig. 2. Histograms of the equivalent widths EW1 (top panel) and EW2 (lower panel) (mÅ) of the DIBs detected in the lines of sight of HD 183143 and HD 204827, respectively, fromHobbs et al.(2009,
2008), and confirmed byFan et al.(2019).
Table 2. Properties of narrow and broad DIBs detected in the lines of sight of HD 183143 (1) and HD 204827 (2), derived when adopting a limit of 1.1 Å between both classes.
DIBs(a)detected in 1 and 2(b) 1 not 2(c) 2 not 1(d) Total
Narrow(<1.1Å) Number 218 83 85 386 EW1av 19.4 9.8 x x EW1tot(e) 4230 810 x 5040 EW2av 12.0 x 6.3 x EW2tot(e) 2620 x 540 3160 Broad( f ) (>1.1Å) Number 49 67 6 122 EW1av 133 38 x x EW1tot(e) 6530 2550 x 9080 EW2av 47 x 26.6 x EW2tot(e) 2310 x 160 2470 4428 Å EW1 5700 x x 5700 EW2 1220 x x 1220
Notes. (a)All equivalent widths, EW
i, have mÅ units. (b)Confirmed DIBs detected in both lines of site (Hobbs et al. 2008,2009;Fan et al. 2019),(c)detected only in HD 183143 (1),(d)detected only in HD 204827 (2). (e)Sum of the equivalent widths of all DIBs of the quoted class detected in the quoted sightlines (see Sect. 5). ( f )Not including the 4428 Å DIB.
limit that separates narrow and broad DIBs, such as 1.0 Å (see AppendixA). As shown in Figs. 1b and 3, all ζ and C2 DIBs
listed in Table1are included in the region of the narrow DIBs with an FWHM < 1.1 Å, while those listed as σ are outside and much broader for most of them. We verified that the situation would not have been very different for other definitions of narrow DIBs.
Fig. 3.Wavelength dependence of the ratio R21of the equivalent widths of narrow DIBs (FW H M < 1.1 Å, Table2) in the lines of sight of HD 204827 and HD 183143 (Hobbs et al. 2008,2009) confirmed inFan
et al.(2019). These DIBs are shown by red dots, except for the DIBs
identified in Table 1 as ζ (Ensor et al. 2017; grey diamonds) or C2 (Thorburn et al. 2003; black triangles). The straight full green line displays the linear fit of Eq. (1), and the dashed lines show the ±1σ limits.
Some properties of this set of 386 narrow DIBs (76% of the total, 509) are reported in Table2and discussed in Sect.5, together with the complementary set (123, 24%) that we call “broad” DIBs. With any possible definition of narrow DIBs (e.g. Tables2andA.1), their number is very high, from ∼70 to ∼80% of all DIBs. However, they contribute only a minor fraction to the total strength (equivalent width) of the DIBs: ∼20–27% in the line of sight of HD 183143; ∼40–47% in HD 204827, where the narrow ζ and C2 DIBs are enhanced (see Tables2andA.1
and the discussion in Sect.5).
3. Correlation between the DIB UV sensitivity and their wavelength
3.1. DIBs detected in the lines of sight of HD 204827 and HD 183143
With this definition of narrow and broad DIBs (Table 2), Figs.3and4break down the general correlation shown in Fig. 4 of OBT19 (reproduced in Fig.5) between the DIB intensity ratio, R21, in the sightlines of HD 204827 and HD 183143 for narrow
and broad DIBs separately. Because the UV intensity is attenu-ated in the sightline of HD 204827 but retains the typical high value of diffuse clouds in HD 183143, R21 reflects the DIB
car-rier sensitivity to its destruction (or formation) by interstellar UV. Figure 3 shows that the correlation is significantly higher for narrow DIBs than for all DIBs (Fig.5). A linear fit gives
logR21 = a × 10−4×λ(A) + b ± c (1)
with a = −3.71, b = 2.18, and c = 0.28, with a Pearson cor-relation coefficient P = −0.61 for the narrow DIBs (Fig. 3), instead of a = −2.4, b = 1.3, c = 0.32, and P = −0.45 for all DIBs (Fig. 5). On the other hand, hardly any correlation is visible for the majority of broad DIBs (Fig. 4) (a = −0.85, b = 0.15, c= 0.33, and P = −0.22). These coefficients confirm the sig-nificant correlation for the narrow DIBs, but with a substantial dispersion of the values of R21around this fit by a factor of about
2 (Fig. 3). The large uncertainties on equivalent-width mea-surements, which are particularly significant for the numerous
Fig. 4.Same as Fig.3for broad DIBs (FW H M > 1.1 Å, Table2). These DIBs are shown by blue open squares, except for the DIBs identified in Table1as σ (Lan et al. 2015) which appear as orange full triangles.
Fig. 5.Same as Fig.3for all DIBs (same as Fig. 4 of OBT19), with the same symbols as in Figs.3and4.
weaker DIBs (<10 mÅ), is expected to substantially contribute to this dispersion. However, their effect on the correlation itself is apparently negligible.
We verified that similar λ/UV correlations are obtained for other possible definitions of narrow DIBs, but with a slightly less clear-cut difference between narrow and broad DIBs. For instance, the case of a separation between narrow and broad DIBs of 1.0 Å is discussed in Appendix A and displayed in Fig.A.1. The fit and Pearson coefficients are almost identical to those of Fig.3 (see Eq. (B.1)). We may conclude that the restric-tion to narrow DIBs significantly enhances the λ/UV correlarestric-tion, while the broadest DIBs do not display such a correlation. How-ever, it is not possible to provide a completely clear-cut definition of narrow DIBs.
Fig. 6.Wavelength dependence of the ratio R21of the equivalent widths of narrow DIBs (Table 2) in the lines of sight of HD 204827 and HD 183143 (Hobbs et al. 2008, 2009;Fan et al. 2019), replacing the equivalent widths of undetected DIBs by 3 mÅ in HD 183143 and 2 mÅ in HD 204827.
3.2. DIBs detected on a single sightline
The numerous DIBs detected on only a single sightline, either HD 183143 (Hobbs et al. 2009) or HD 204827 (Hobbs et al. 2008), may provide additional information about the λ/UV cor-relation. As quoted in OBT19, 168 DIBs are tentatively detected only in HD 183143 and 107 in HD 204827 as reported byHobbs et al.(2009,2008). We here retain only those confirmed in the recent Apache Point catalogue ofFan et al. 2019, that is, 150 in HD 183143 and 91 in HD 204827. Their overwhelming presence at short wavelength in HD 204827 (89% at λ < 6200 Å) and at long wavelength in HD 183143 (65% at λ > 6500 Å) additionally supports the correlation of the ratio R21with λ and therefore the
λ/UV correlation.
This point may be illustrated by extending Fig.3to DIBs that are detected on a single sightline. For this purpose, we replace in Fig.6the equivalent widths of undetected DIBs by the somewhat arbitrary values of 3 mÅ in HD 183143 and 2 mÅ in HD 204827, which can be consistent with the low-intensity parts of the his-tograms of the equivalent widths in Fig.2. For narrow and broad DIBs, the agreement with the behaviour of the DIBs detected in the two lines of sight is remarkable. It remains somewhat arti-ficial because it depends on the adopted choice for the intensity of undetected DIBs. Nevertheless, Fig. 6 shows that the λ/UV correlation extends from the 218 narrow DIBs detected in both sightlines to almost 400 detected in at least one of them (the fit and Pearson coefficients are a= −3.88, b = 2.2, c = 0.44, and P= −0.66). Similarly, Fig.7shows that there is no strong cor-relation for the 123 broad DIBs that are detected in at least one sightline (a = −2.1, b = 0.64, c = 0.45, and P= −0.33).
Several tens of DIBs are now detected outside the range of the catalogues of Fan et al.(2019) andHobbs et al. (2008,
2009), in the near-infrared from 0.8 to 2.4 µm (Joblin et al. 1990;Geballe et al. 2011,2014;Cox et al. 2014;Elyajouri et al. 2016,2017;Hamano et al. 2016,2018;Galazutdinov et al. 2017), including the C+60DIBs near 9600 Å and the 8620 Å “Gaia DIB”
Fig. 7.Same as Fig.6, but for broad DIBs.
(e.g. Kos et al. 2013; Puspitarini et al. 2015; Krełowski et al. 2019). Only a few of them have been observed in highly UV-screened lines of sight, such as HD 204827, with the required sensitivity that the λ/UV correlation needs to be determined. However, as discussed in Sect. 4.6, a tight correlation is not expected because the majority of them seems to behave like cationic σ DIBs.
4. Implications for carriers of narrow DIBs
4.1. Large neutral elongated carbonaceous molecules As quoted in OBT19, the series of strong optical bands of families of carbonaceous elongated molecules might fit the cor-relation of R21with λ well under the condition that their carriers
are critically sensitive to interstellar UV photodissociation. The remarkable optical properties of this essential class of organic molecules with conjugated π electron systems, including the lin-ear progression of λ with the number of carbon atoms NC and
f >∼ 1, have been rationalised a long time ago (e.g. Dewar &
Longuet-Higgins 1954; Platt 1956; and the papers of Brooker et al. 1940-1951 quoted by Platt 1956). They include all vari-eties of carbon chains and catacondensed PAHs and their derived compounds, and more generally, most of the organic dyes. This series of strong optical bands can be traced back to the simple free electron model (e.g.Jensen 2013 and historical references therein), but the account of actual values of the band wavelengths and strengths requires various levels of sophistication of quan-tum theory. The interest for DIB carriers of some classes of these compounds have been emphasised for more than 40 yr for long carbon chains (Douglas 1977), more recently for catacondensed PAHs (Ruiterkamp et al. 2002, 2005), and particularly poly-acenes (OBT19). In the following subsections, we summarise the conclusions for each class and try to re-examine them in the context of the λ/UV behaviour of narrow DIBs.
A key interest of compounds such as DIB carriers is the rough proportionality of the wavelength of their strong optical bands with their length. Their interstellar UV photodissocia-tion is also strongly correlated with their length because after the absorption of a UV photon, their vibration temperature Tv
is roughly inversely proportional to NC0.4 (Eq. (B.1)) and simi-larly to their length. Because the probability of photodissociation exponentially varies with Tv, the sensitivity to UV
photodissoci-ation must be correlated with the length and thus with λ. As discussed in OBT19, the dehydrogenation of N-acenes and similar molecules depends very strongly on N around a crit-ical value Ncr. As stressed in Appendix B, Ncr also depends
critically on the effective energy EUV of the
photodissociat-ing photons. This may explain the order of magnitude of the observed R21/λ correlation. In a substantial part of the
sight-line of HD 204827, the UV-shielding is high enough to preserve the hydrogenation down to N ∼ 11, while it is destroyed in HD 183143. This may explain the high values of R21 that are
observed in the range λ ∼ 5000 Å. On the other hand, all acene-like molecules are expected to be fully hydrogenated for N >∼ 15 (λ >∼ 6500 Å), yielding relatively low values of R21.
However, other origins for the correlation of R21 with λ are
possible. It is likely that a similar correlation exists, although less marked, for pericondensed PAHs between the wavelength of the optical bands and NCand hence the probability of
photodissocia-tion. This is in line with the well-known propensity of all neutral PAHs to have narrow bands (e.g.Salama 2008). Alternatively, as quoted in OBT19, the correlation might also partly result from the predominance of cationic bands at large λ (Sect.4.3). 4.2. Carbon chains
The interest of long carbon chains as DIB carriers has been emphasised for more than 40 yr (Douglas 1977; Thaddeus 2013, and especially John Maier’s Basel group, e.g. Rice & Maier 1993; Fischer & Maier 1997; Zack & Maier 2014a,b;
Campbell & Maier 2017). It is generally agreed, however, that chains with NC<∼ 15 are excluded based on laboratory results
(e.g.Zack & Maier 2014a) probably because they are efficiently destroyed by single-photon photodissociation.
For longer chains, the NCstability limit in the diffuse
inter-stellar medium (ISM) might be inferred from an analogy with PAHs. Modelling PAH photodissociation remains difficult (e.g.
Simon et al. 2018and references summarised in OBT19). It is generally agreed that dehydrogenation occurs first for NC<∼ 40–
50, and that the carbon skeleton is efficiently destroyed in typical diffuse clouds for slightly lower values of NC<∼ 30–40 (e.g. Allain et al. 1996a,b;Castellanos et al. 2018a,b and references therein). The case of long chains is expected to be relatively similar, with similar critical values, NCcr, of NC because they
have roughly similar dissociation energies for the ejection of H and carbon clusters (mostly C3 for carbon chains,Chabot et al. 2010).
In typical diffuse clouds, chains with NC>∼ 30–40 might
per-haps survive and grow by C+accretion. They might eventually bear an hetero atom (N, etc.) at their ends, and even a few H atoms for slightly higher values of NC. If their
photodissocia-tion worked like this, it might explain a λ/UV correlaphotodissocia-tion in a similar way as for polyacenes if they display series of strong optical bands and NCcr lies in the visible range. The spectra of
carbon rings present similarities with chains, and rings might spontaneously form from very long chains in the conditions of the ISM.
However, because smaller chains are expected to be destroyed by photolysis, it is generally believed that chain “seeds” would be needed to allow for free very long chains. There is still no evidence of such chains in the diffuse interstellar medium, however, and the proposed processes for their formation from grain shattering (e.g. Duley 2000;
Jones 2016) remain tentative. In addition, the properties of DIB profiles seem incompatible with such long linear chains (Oka et al. 2013; Huang et al. 2013). Nevertheless, we note that a suite of alkyl dicarboxylic acids up to C18chain length is observed in
some meteorites (Pizzarello & Shock 2010). 4.3. Polyacenes
Polyacenes remain the best candidates to contribute to the DIB λ/UV correlation based on the arguments presented in OBT19 especially for narrow C2 and ζ DIBs, namely their high
sym-metry and series of very strong optical bands, combined with the properties of their photodissociation, may fit the λ/UV cor-relation remarkably well; their large A rotational constant may account for the observed narrow profiles of C2and ζ DIBs; and
they are members of the extremely abundant PAH family. In addition to fully hydrogenated polyacenes, partially dehy-drogenated radical states also need to be considered for NCclose
to the critical value for photodissociation NCcr, as discussed
in OBT19. However, a small number of singly dehydrogenated acenes might also be created for NC> NCcr from
photodis-sociation of transient superhydrogenated states producing H2
(Boschman et al. 2015; Castellanos et al. 2018a,b; Sanchez-Sanchez et al. 2019).
If pure acenes were proven to be carriers of strong or medium DIBs, the rich variety of their possible alterations as possible car-riers of weak DIBs need to be considered as well. Many of them are expected to keep the most characteristic band features of acenes into wavelength series and strengths, although predicting precise values is difficult. This could include superhydrogenation (with several H atoms bound to the same edge C atom), methy-lation, C addition, or inclusion of hetero atoms (N, O, etc., e.g.
Hudgins et al. 2005;Tielens 2008).
However, such modifications must be compatible with poly-acene interstellar chemistry and the probability that they can survive in the harsh UV environment of the diffuse ISM to war-rant significant abundances. In contrast, the activation energy of many adducts is not high enough to protect them against photolysis by single UV-photon absorption in the diffuse ISM. This is the case for the H atoms of superhydrogenated states (Castellanos et al. 2018a,b) and for CO ejection from quinones (Chen et al. 2010) in PAHs with NC<∼ 50–70. In addition, in most
cases, including nitrogen atom substitutions in the carbon skele-ton, part of the high symmetry of polyacenes is expected to be broken, and the actual intensity of possible interstellar bands is expected to be reduced by their isomer variety.
As quoted in OBT19, the lower thermodynamic stability of linear polyacenes compared to compact PAHs remains a major question for their abundance in the diffuse ISM. While only ∼10−5 of the total PAH abundance is enough to account for a
medium-strength DIB (or ∼0.3–0.4% of the PAH abundance for the combined strengths of all narrow DIBs, see Sect.5), some processes allowing such an abundance would need to be identi-fied. For instance, the possibility of reactions on grain surfaces leading to the formation of elongated PAHs perhaps through rad-ical and polyacene reactions would need to be identified (e.g.
Johansson et al. 2018,Sanchez-Sanchez et al. 2019,Zuzak et al. 2018). One of the most efficient modes of synthesis of graphene nanoribbons (GNR) similarly uses polymer formation on sur-faces (e.g.Cai et al. 2010,Ruffieux et al. 2016; Nakada et al. 1996). Even oxygen unzip of graphenic interstellar sheets might perhaps be considered, as it is known for laboratory graphene or nanotubes (Li et al. 2006;Ajayan & Yakobson 2006;Kosynkin et al. 2009). Because polyacenes and other catacondensed PAHs
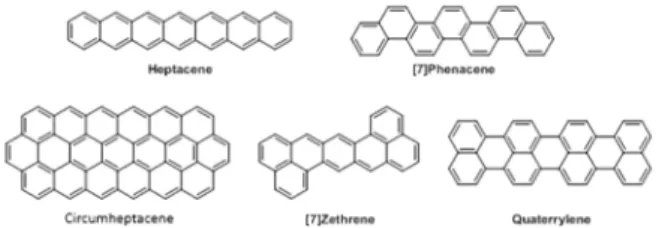
Fig. 8.Examples of elongated PAHs from five different classes: acenes, phenacenes, circumacenes, zethrenes, and rylenes.
discussed below are extreme forms of GNRs, it is not excluded that they from similarly efficiently by carbon chemistry on the surface of interstellar (carbon) grains. The interstellar (photo-) chemistry of dust grains and PAHs is too complex and still too poorly understood to allow any definitive conclusion, however.
4.4. Other catacondensed PAHs
While acenes are the most extreme and symmetric cases, var-ious other elongated or catacondensed PAHs (see e.g. Fig. 8) share many of the polyacene properties. Their conjugated π elec-trons are expected to also yield similar series of strong bands. It is possible that the broader acene family and other polyacene based isomers, such as zethrenes, fit the λ/UV correlation as well as polyacenes because their optical bands and photodisso-ciation versus length share similar properties. Oligorylenes are especially attractive candidates (Ruiterkamp et al. 2002,2005;
Halasinski et al. 2003; Zeng et al. 2018), as are circumacenes (Malloci et al. 2011), because their highest occupied molecular orbital - lowest unoccupied molecular orbital (HOMO-LUMO) gap is small and the f -values of their optical bands are high (Weisman et al. 2003; Zdetsis & Economou 2017). They have other properties similar to acenes, such as diradical structure, but they are expected to be slightly more stable and might intervene in carbon graphitisation (see e.g. the review byZeng et al. 2018and references therein). The discussion ofRuiterkamp et al. (2005) shows that the measured bands of neutral and cation terylene (C30H16) and quaterrylene (C40H20) in a neon
matrix (Ruiterkamp et al. 2002) seem incompatible with strong DIBs. This might be explained by photodissociation, so that heavier rylenes might nevertheless be considered for strong ζ DIBs with λ >∼ 6500 Å and IR σ DIBs. On the other hand, com-pounds such as phenacenes appear less favourable because their HOMO-LUMO gap is larger (e.g.Malloci et al. 2011).
Together with their linear form, the cyclic form of acenes, [N]cyclacenes, C4NH2N, might be present in the interstellar
medium (Jones 2016; OBT19). Theoretical studies of their elec-tronic properties (Wu et al. 2016; Battaglia et al. 2017) have confirmed that the properties of cyclacenes with an even num-ber of benzene rings are similar to linear acenes. We infer that they probably display similar visible spectra of conjugated π electrons, but the wavelengths and strengths remain to be determined.
Cyclacenes could efficiently form in the diffuse ISM from long linear radical acenes (Sect. 4.3) through monomolecu-lar cyclisation reactions. The frequent absorption of a ∼10 eV UV photon could raise the internal temperature to overcome the few eV bending barrier to achieve cyclisation through a monomolecular reaction similar to the radical or superhydro-genation reactions between polyacenes studied by Johansson et al.(2018) orSanchez-Sanchez et al.(2019).
4.5. Cations
As quoted in OBT19, the correlation might also result partly from the predominance of cationic bands at large λ. Cations are expected to dominate the visible absorption of interstellar PAHs (e.g.Salama et al. 1996; Li & Draine 2001 and Sect.6). It is expected that they display many more bands in the range ∼1– 2 eV than their parent closed-shell neutrals because an electron might be promoted from the inner shells into the vacancy of the HOMO shell (see e.g.Salama et al. 1996). However, the actual spectral distribution of their expected interstellar bands remains uncertain because it depends on the nature of the most important PAHs. This may at least partly explain the large number of DIBs with a low R21ratio or those that are undetected on the sightline
of HD 204827 at λ >∼ 6000 Å (Figs.3and6).
Heavy ionised acenes have relatively strong optical and infrared bands, although they remain weaker than the optical bands of neutral polyacenes. They have been measured up to nonacene by Mondal et al. (2009) and Tönshoff & Bettinger
(2010) (see also Malloci et al. 2007). Larger acenes also have lower ionisation potentials. This is expected to further push the charge state balance towards cations and increase the number of cationic DIBs at λ > 6000 Å.
4.6. Infrared DIBs
As shown for the C+60DIBs near 9600 Å, similar cationic bands are expected for all fullerenes and various PAHs in the whole near-infrared range beyond 8000 Å. The detection of more than 60 near-infrared DIBs has been announced by various authors since the first detections (Joblin et al. 1990;Geballe et al. 2011,
2014), (see Sect.3.2and below). However, the data and even the list are not yet public for many of those that were announced by Hamano et al. (2018). For the others, fewer than 12, the strongest, have published observations that are complete enough to precisely determine their width and their dependence on the UV environment. This includes the following DIBs: λλ10780, 10792, 11797, 12623, 13175 (Hamano et al. 2016) and λ152681 (Elyajouri et al. 2017), in addition to the λλ9577 and 9633 C+60 DIBs (Foing & Ehrenfreund 1997; Cox et al. 2014) and the λ8620 “Gaia DIB” (Krełowski et al. 2019). All of them proba-bly form in similar environmental conditions as the optical DIBs at λ5780 or even λ6283, that is, in a relatively strong UV radi-ation field, as quoted by Elyajouri et al. (2017), for example. They may therefore be considered as σ DIBs and their carriers are probably cations, as confirmed for the λ9577 and 9633 C+60 bands. Although only λ8620 and λ15268 seem to have published data in HD 204827 (Krełowski et al. 2019; Galazutdinov et al. 2017), we expect that the intensity ratio, R21, on the sightlines
of HD 204827 and HD 183143 of these 9 DIBs is comparable to those of λ5780 (0.33), λ6283 (0.24), λ8620 (0.30), or λ15268 (0.20). This clearly places them well outside the range of the λ/R21 correlation of Fig.3. This is another example that the σ
DIBs do not follow the λ/UV correlation.
While most prominent near-infrared DIBs are σ-type, no ζ-type has been well identified yet. The possible different case of λ10504 is discussed byHamano et al.(2016). However, the pre-cise determination of the properties of this DIB is made difficult by the presence of stellar features in the spectra of the targets and in those of the comparison stars (R. Lallement, priv. commun.).
1 We give here the value in the air of the wavelength of this DIB to be consistent with the other DIBs, whileElyajouri et al.(2017) used its value in vacuum, λ15273.
When the FWHM values of the detected infrared DIBs (Geballe et al. 2011; Cox et al. 2014; Hamano et al. 2015;
Elyajouri et al. 2017;Galazutdinov et al. 2017;Krełowski et al. 2019) are expressed in Ångströms, they are all above the 1.1 Å limit that separates narrow from broad optical DIBs. However, expressing the FWHM in cm−1(or in km s−1) is certainly more
relevant when infrared and optical DIBs are compared. When the general relation.
FW H M(cm−1)= FWHM(A)/λ(µm)2 (2)
is taken into account, we obtain an FW H M ≈ 3.0 cm−1at about 6000 Å for the narrow or broad limit, FW H M = 1.1 Å, that we assumed. Adopting 3.0 cm−1for the limit regardless of λ would
yield an FW H M(Å) = 3 × λ(µm)2 for this limit. We verified that for the optical DIBs, the R21/λ correlation and the values of
the coefficients for the fit of Eq. (1) are practically unchanged when a 3.0 cm−1limit is adopted. However, most FWHM values of the infrared DIBs are now close to or below this limit value, including all the “σ” infrared DIBs discussed above, except for λ8620. However, the relevance of this limit may be debated. We may conclude that while most prominent near-infrared DIBs are of σ-type, the λ/UV correlation is not relevant for infrared DIBs. The density of DIBs, especially of narrow ones, sharply decreases above 7000 Å, and it decreases still more above 8000 Å, even after correcting the table ofFan et al.(2019) for telluric absorption. This noticeable lack of narrow DIBs above ∼8000 Å (which needs to be confirmed by the analysis of new infrared DIBs, e.g.Hamano et al. 2018) might imply that there is a limit to the size (number of rings) of the carriers that give rise to the λ/UV relation (e.g. for neutral polyacenes, Eq. (B.2) gives a maximum of about 19 rings for a 8000 Å limit). The origin of this size limit might be either a drop in abundance of the carriers or a change in their optical band strength following a structural change of their ground state.
5. Amount of carbon implied in the different DIB classes
It is straightforward to derive the amount of carbon that is locked up in the carriers of a DIB or an ensemble of DIBs of known equivalent width and oscillator strength (e.g.Ruiterkamp et al. 2005;Cami & Cox 2014;Tielens 2014;Omont 2016). For instance, Eq. (1) of OBT19 yields
XCM ≈ 10−7× EW/(r × ¯f), (3)
where XCM denotes the fraction of total interstellar carbon that
is locked up in molecule(s) M assuming NC∼ 60 carbon atoms
in M and ignoring the λ dependence. ¯f is some average of the DIB oscillator strength, EW is its equivalent width in mÅ, and r= E(B − V) is the sightline reddening.
Table2provides a rough statistics of the DIBs detected in the lines of sight of HD 183143 and HD 204827 (Hobbs et al. 2009,
2008;Fan et al. 2019) together with their average and total equiv-alent widths EW1and EW2. From these data it is straightforward
to derive the amount of carbon that is contained in the carriers of each DIB class modulo the mean oscillator strength. For this purpose, with the actual values of r = 1.27 and 1.1 mag, Eq. (1) yields
XCM1≈ 0.8 × 10⁻⁷× EW1/ ¯f (4)
for HD 183143 and HD 204827, respectively. From the values of Table2, we derive the following orders of magnitude of the total percentages of interstellar carbon that is locked up in the different DIB classes (these percentages are slightly but signifi-cantly modified by ∼10–20% when 1.0 Å is assumed for the limit between narrow and broad DIBs, TableA.1).
– Narrow DIBs (<1.1 Å): the 386 narrow DIBs (76% of all 509 DIBs) account for 25% of the total equivalent width in HD 183143) (46% in HD 204827) and 36% (56%) without the 4428 Å DIB. This corresponds to 4 × 10⁻⁴ f¯of interstellar carbon in HD 183143 and 2.8 × 10⁻⁴ f¯in HD 204827. If their
carriers are elongated PAHs with high f -values ∼1, they con-tain only a very small fraction of the interstellar carbon, about 0.3–0.4% of that in all PAHs.
– Broad DIBs (>1.1 Å):The 122 broad DIBs excluding the 4428 Å DIB (24% of all DIBs) account for 46% of the total equivalent width in HD 183143 (36% in HD 204827) and 64% (44%) of the total without the 4428 Å DIB. Together with the 4428 Å DIB, they contain most of the carbon that is included in the DIBs, probably in the form of cations (e.g.Ruiterkamp et al. 2005;Salama 2008). This may be one or two orders of magni-tude more than in all the narrow DIBs if their average f -value were significantly lower. For instance, assuming a low value for
¯
f = 0.06 (0.001 per C atom, see Sect.6) with EW1tot= 0.9 × 10⁴
would yield a significant value for the interstellar carbon fraction X1= 1.2 × 10⁻², that is, ∼10% of that in PAHs in HD 183143.
The great majority of PAHs (cations) cannot contribute to the individually observed DIBs, but they must contribute to the part of the visible interstellar extinction attributed to PAHs (e.g.
Li & Draine 2001) in the form of a continuum background of unresolved undetectable very weak DIBs, as explained in the following section.
6. Background of unresolved very weak PAH DIBs
Because they are a significant component of interstellar dust, PAHs contribute to a few percent of the visible interstellar extinc-tion, as estimated byWeingartner & Draine(2001), for example. In this model, we see from Fig. 16 of Li & Draine(2001) that the PAHs might contribute roughly to ∼6% of the standard total extinction at 6000 Å in the diffuse ISM of the Milky Way. From the uncertain values of the absorption cross section per C atom of ionised PAHs of Fig. 2 ofLi & Draine(2001), we may infer that the average f-value per C-atom in the 5500-7000 Å range could be ∼0.001-0.002, which would yield an average f -value equal to 0.1–0.2 for a typical PAH with NC= 100. This is compatible
with the value of 0.1 proposed bySalama(2001) for the average f-value of PAH cations that must dominate the PAH extinction in the visible range.
Using the corresponding value ¯f = 0.06 for NC= 60 and
XPAH= 0.1 in Eq. (2), we find the formal total equivalent width
EW1≈ 1.3×10⁵mÅ mag−1 for all PAHs in the visible range in
HD 183143. After subtracting the PAH contribution to DIBs, ∼1-2 × 10⁴mÅ mag−1, we see that the total equivalent width of the
PAH unresolved background, ∼105mÅ/mag, might be about five
times that of all DIBs and ten times that of the very broad DIBs (not including the 4428 Å DIB) in Table2. This suggestion is somewhat similar to the so-called grass concept, which is related to the number of unresolved DIBs per equivalent width, and was developed byTielens(2014, Fig. 1; see alsoGredel et al. 2011).
The number of unresolved very weak DIBs that contribute to this background probably is extremely high. First, considering a total spectral range of about 3000 Å, from ∼4500 to ∼7500 Å
and a width ∼0.5–1 Å, there cannot be fewer than about 5000 bands that give an unresolved continuum. However, their equiv-alent width is expected to be smaller than the detection limit of actual DIBs, <∼5 mÅ mag−1. This means that the total equiva-lent width of the PAH unresolved background, ∼105mÅ mag−1, must be shared between more than 20 000 unresolved very weak DIBs, and probably by many more. The rapid multiplication of PAH isomers with their number of carbon atoms NC, plus
hetero atoms, might well explain such large numbers. How-ever, the increase in vibration modes must also play a role. For NC>∼ 200–300, the absorption spectrum of each PAH cation is
itself expected to evolve toward some kind of continuum because a multitude of vibronic lines contribute to it (Salama et al. 1996).
7. Conclusion
The correlation between the wavelength of optical DIBs and the apparent UV resilience of their carriers is remarkable, although it does not apply to infrared DIBs, which seem to be mostly σ-type. As expected, we find that this correlation is based on the narrow DIBs, which form the most numerous DIB class, while it does not apply to the majority of the broader DIBs, although they contribute most of the total DIB absorption. The most promi-nent narrow DIBs belong to one of the two well-studied ζ or C2DIB families that are known to be sensitive to UV quenching
and to present similar characteristic molecular band profiles. It is tempting to surmise that all narrow DIBs display similar profiles, but this requires confirmation by further sensitive DIB observa-tions. It therefore seems likely that these DIBs are carried by molecular compounds that are similar to those that explain the observed λ/UV correlation. These carriers might be elongated systems of π correlated electrons, such as carbon chains or cata-condensed PAHs. These compounds may display series of strong optical bands that tightly depend on their length, as has been found for chains and polyacenes. Their photodissociation also strongly depends on their length, which could explain the λ/UV correlation as proposed for polyacenes by OBT19.
The total amount of carbon contained in all the carriers of these narrow DIBs remains a very small fraction of the inter-stellar carbon if their oscillator strengths are >∼1. The amount of carbon locked in the carriers of the broader DIBs could be much higher, especially if their oscillator strengths are significantly weaker.
The proposed identification of the carriers of significant interstellar absorption through the whole visible range with sim-ple conjugated systems of π electrons that are related to the basis of most of our dyes might appear nice and natural. However, this conjecture remains fragile as long as not a single such DIB has been identified and the presence of such compounds in the diffuse ISM has not been confirmed. Among the variety of pos-sible molecules, carbon chains and catacondensed PAHs with a single-hexagon chain such as polyacenes and derivatives, or polyrylenes seem to be favoured for their simplicity and sym-metry and the presence of related species in the ISM. Smaller chains are well known in dense molecular clouds and the rich PAH family is one of the main interstellar carbon reservoirs in galaxies. Polyacenes and related PAHs seem to better meet the observed λ/UV correlation than chains. However, other origins for this correlation are possible.
The PAH cationic bands might explain part of the correla-tion between the DIB wavelength and the UV strength at large λ. It might seem attractive to link the multiplication of these weak UV-favoured DIBs with the contribution of PAHs to the visi-ble interstellar absorption if both are due to PAH cations with
weak oscillator strengths. However, strong DIBs are much better explained by singular carriers with strong optical bands. Elon-gated PAHs could be appropriate candidates because of their very strong optical bands. Some specific chemical processes are then required to compensate for their lower stability compared to the bulk of other PAHs. It is not excluded that the complex chemistry of grain surface and PAHs could offer such a chemical path similar to the easiness of the synthesis of graphene nanorib-bons on surfaces. The complexity of such processes prevents any definitive conclusion, and further studies would be worthwhile.
Laboratory spectroscopy of long polyacenes (or polyrylenes) in gas phase or helium droplets appears as the best way to try to confirm them as DIB carriers. Despite the problem of their instability, such studies do not appear impossible for already syn-thesised species such as decacene or undecacene, which have been proposed as possible carriers of C2DIBs (OBT19).
Acknowledgements.We thank the referee for his/her very helpful comments and suggestions. We are indebted to the late Sydney Leach and Rosine Lallement for many discussions and important suggestions, and to Pierre Cox for his careful reading of the manuscript and his suggestions for improving it. We would like to thank Olivier Berné, Christine Joblin, Benoit Soep, Elisabetta Micelottta and Christina Tönshoff for discussions and comments on various aspects. We made a high use of “TOPCAT & STIL: Starlink Table/VOTable Processing Software” (Taylor 2005) and thank its developers. This work was supported in part by the German Research Foundation (DFG).
References
Ajayan, P. M., & Yakobson, B. I. 2006,Nature, 441, 818
Allain, T., Leach, S., & Sedlmayr, E. 1996a,A&A, 305, 602
Allain, T., Leach, S., & Sedlmayr, E. 1996b,A&A, 305, 616
Battaglia, S., Faginas-Lago, N., Andrae, D., Evangelisti, S., & Leininger, T. 2017,
J. Phys. Chem. A, 121, 3746
Boschman, L., Cazaux, S., Spaans, M., Hoekstra, R., & Schlathölter, T. 2015,
A&A, 579, A72
Cai, J., Ruffieux, P., Jaafar, R., et al. 2010.Nature 466, 470
Cami, J. 2014,IAU Symp., 297, 370
Cami, J., & Cox, N. L. J. 2014,IAU Symp., 297
Cami, J., Sonnentrucker, P., Ehrenfreund, P., & Foing, B. H. 1997,A&A, 326, 822
Cami, J., Cox, N. L., Farhang, A., et al. 2018,The Messenger, 171, 31
Campbell, E. K., & Maier, J. P., 2017,J. Chem. Phys., 146, 160901
Campbell, E. K., Holz, M., Gerlich, D., & Maier, J. P. 2015,Nature, 523, 322
Campbell, E. K., Holz, M., & Maier, J. P. 2016,ApJ, 826, L4
Castellanos, P., Candian, A., Andrews, H., & Tielens, A. G. G. M. 2018a,A&A, 616, A166
Castellanos, P., Candian, A., Zhen, J., Linnartz, H., & Tielens, A. G. G. M. 2018b,
A&A, 616, A167
Chabot, M., Tuna, T., Béroff, K., et al. 2010,A&A, 524, A39
Chen, T., Zhen, J., Wanga, Y., Linnartz, H., & Tielens, A. G. G. M. 2018,Chem. Phys. Lett., 692, 298
Cox, N. L. J., Cami, J., Kaper, L., et al. 2014,A&A, 569, A117
Dewar, M. J. S., & Longuet-Higgins, H. C. 1954,Proc. Phys. Soc. A, 67, 795
Douglas, A. E. 1977,Nature, 269, 130
Duley, W. W. 2000,ApJ, 528, 841
Elyajouri, M., Monreal-Ibero, A., Remy, Q., et al. 2016,ApJS, 225, 19
Elyajouri, M., Cox, N. L. J., & Lallement, R. 2017,A&A, 605, L10
Elyajouri, M., Lallement, R., Cox, N. L. J., et al. 2018,A&A, 616, A143
Ensor, T., Cami, J., Bhatt, N. H., & Soddu, A. 2017,ApJ, 836, 162
Fan, H., Welty, D. E., York, D. G., et al. 2017,ApJ, 850, 194
Fan, H., Hobbs, L. M., Dahlstrom, J. A., et al. 2019,ApJ, 878, 151
Fischer, G., & Maier, J. P. 1997,Chem. Phys., 223, 149
Foing, B. H., & Ehrenfreund, P. 1994,Nature, 369, 296
Foing, B. H., & Ehrenfreund, P. 1997,A&A, 317, L59
Galazutdinov, G. A., Lee, J.-J., Han, I., et al. 2017,MNRAS, 467, 3099
Geballe, T. R., Najarro, F., Figer, D. F., Schlegelmilch, B. W., & de La Fuente, D. 2011,Nature, 479, 200
Geballe, T. R., Najarro, F., de la Fuente, D., et al. 2014,IAU Symp., 303, 75
Gredel, R., Carpentier, Y., Rouillé, G., et al. 2011,A&A, 530, A26
Halasinski, T. M., Weisman, J. L., Ruiterkamp, R., et al. 2003,J. Phys. Chem. A, 107, 3660
Hamano, S., Kobayashi, N., Kondo, S., et al. 2015,ApJ, 800, 137
Hamano, S., Kobayashi, N., Kondo, S., et al. 2016,ApJ, 821, 42
Hamano, S., Kobayashi, N., Kawakita, H., et al. 2018,Bull. Soc. Roy. Sci. Liége, 87, 276
Herbig, G. H. 1975,ApJ, 196, 129
Herbig, G. H. 1995,ARA&A, 33, 19
Hobbs, L. M., York, D. G., Snow, T. P., et al. 2008,ApJ, 680, 1256
Hobbs, L. M., York, D. G., Thorburn, J. A., et al. 2009,ApJ, 705, 3
Huang, J., & Oka, T. 2015,Mol. Phys., 113, 2159
Hudgins, D. M., Bauschlicher, C. W., Jr., & Allamandola, L. J. 2005,ApJ, 632, 316
Jensen, W. B. 2013, Pioneers of Quantum Chemistry (Washington: ACS Publishing)
Joblin, C., Maillard, J. P., D’Hendecourt, L., et al. 1990,Nature, 346, 729
Johansson, K. O., Head-Gordon, M. P., Schrader, P. E., Wilson, K. R., & Michelsen, H. A. 2018,Science 361, 997
Jones, A. P. 2016,R. Soc. Open Sci., 3, 160223
Ka´zmierczak, M., Schmidt, M. R., Bondar, A., & Krełowski, J. 2010,MNRAS, 402, 2548
Kos, J., Zwitter, T., Grebel, E. K., et al. 2013,ApJ, 778, 86
Kosynkin, D. V., A Higginbotham, A. L., Sinitskii, A., et al. 2009,Nature, 458, 07872
Krelowski, J., & Walker, G. A. H. 1987,ApJ, 312, 860
Krełowski, J., Galazutdinov, G., Godunova, V., et al. 2019,Acta Astron., 69, 159
Lan, T.-W., Ménard, B., & Zhu, G. 2015,MNRAS, 452, 3629
Li, A., & Draine, B. T. 2001,ApJ, 554, 778
Li, J-L., Kudin, K. N., McAllister, M. J., et al. 2006,Phys. Rev. Lett., 96, 176101
Malloci, G., Mulas, G., Cappellini, G., & Joblin, C. 2007,Chem. Phys., 340, 43
Malloci, G., Cappellini, G., Mulas, G., & Mattoni, A. 2011,Chem. Phys., 384, 19
Mondal, R., Tönshoff, C., Khon, D., et al. 2009,J. Am.Chem. Soc., 131, 14281
Nakada, K., Fujita, M., Dresselhaus, G., & Dresselhaus, M. S. 1996,Phys. Rev. B, 54, 17954
Oka, T., Welty, D. E., Johnson, S., et al. 2013,ApJ, 773, 42; 2014, ApJ, 793, 68
Omont, A. 2016,A&A, 590, A52
Omont, A., Bettinger, H. F., & Tönshoff, C. 2019,A&A, 625, A441
Pizzarello, S., & Shock, E. 2010,Perspect. Biol., 2, a002105
Platt, J. R. 1956,J. Chem. Phys., 25, 80
Puspitarini, L., Lallement, R., Babusiaux, C., et al. 2015,A&A, 573, A35
Rice, C. A., & Maier, J. P. 2013,J. Phys. Chem. A, 117, 5559
Ruffieux, P., Wang, S., Yang, B., Sanchez, C., et al. 2016,Nature, 531, 489
Ruiterkamp, R., Halasinski, T., Salama, F., et al. 2002,A&A, 390, 1153
Ruiterkamp, R., Cox, N. L. J., Spaans, M., et al. 2005,A&A, 432, 515
Salama, F. 2001,J. Mol. Struct., 563, 19
Salama, F. 2008,Org. Matter Space, 251, 357
Salama, F., & Ehrenfreund, P. 2014,IAU Symp., 297, 364
Salama, F., Bakes, E. L. O., Allamandola, L. J., & Tielens, A. G. G. M. 1996,
ApJ, 458, 621
Sanchez-Sanchez, C., Martínez, J. I., del Arbol, N. R., et al. 2019J. Am. Chem. Soc., 141, 3550
Sarre, P. J. 2006,J. Mol. Spectr., 238, 1
Sarre, P. J. 2014,IAU Symp., 297, 34
Shen, B., Tatchen, J., Sanchez-Garcia, E., & Bettinger, H. F. 2018,Angew. Chem. Int., 57, 10506
Simon, A., Champeaux, J. P., Rapacioli, M., et al. 2018,Theor. Chem. Acc., 137:106
Taylor, M. B., 2005,ASP Conf. Ser. 347, 29
Thaddeus, P. 2013,The Diffuse Interstellar Bands, eds. Tielens, A. G. G. M., & Snow T. P., Astrophys. Space Sci. Lib. (South Holland: Kluwer), 202 Thorburn, J. A., Hobbs, L. M., McCall, B. J., et al. 2003,ApJ, 584, 339
Tielens, A. G. G. M. 2005,The Physics and Chemistry of the Interstellar Medium
(Cambridge University Press, Cambridge, UK) Tielens, A. G. G. M. 2008,ARA&A, 46, 289
Tielens, A. G. G. M. 2013,Rev. Mod. Phys., 85, 1021
Tielens, A. G. G. M. 2014,IAU Symp., 297, 399
Tielens, A. G. G. M., & Snow, T. P., 1995,The Diffuse Interstellar Bands, Astrophys. Space Sci. Lib. (South Holland: Kluwer), 202
Tönshoff, C., & Bettinger, H. F. 2010,Angew. Chem., Int. Ed., 49, 4125
Vos, D. A. I., Cox, N. L. J., Kaper, L., Spaans, M., & Ehrenfreund, P. 2011,A&A, 533, A129
Weingartner, J. C., & Draine, B. T. 2001,ApJ, 548, 296
Weisman, J. L., Lee, T. J., Salama, F., & Head-Gordon, M. 2003,ApJ, 587, 256
Welty, D. E. 2014,The Diffuse Interstellar Bands, 153
Welty, D. E., Ritchey, A. M., Dahlstrom, J. A., et al. 2014,ApJ, 792, 106
Wu, C., Lee, P., & Chai, J. 2016,Sci. Rep., 6, 37249
Zack, L. N., & Maier, J. P. 2014a,IAU Symp., 297, 237
Zack, L. N., & Maier, J. P. 2014b,Chem. Soc. Rev., 2014, 4602
Zdetsis, A. D., & Economou, E. N. 2017,Carbon, 116, 422
Zeng, W., Qi, Q., & Wu, J. 2018,Eur. J. Org. Chem., 2018, 7
Appendix A: Influence of the definition of “narrow” DIBs
Table A.1. Properties of narrow and broad DIBs detected on the lines of sight of HD 183143 (1) and HD 204827 (2), derived when a limit of 1.0 Å between the two classes is adopted.
1 and 2(a) 1 not 2(b) 2 not 1(c) Total Narrow(<1.0Å) Number 207 67 82 356 EW1av 17.1 9.6 x x EW1tot 3540 640 x 4180 EW2av 11.2 x 6.1 x EW2tot 2320 x 500 2820 Broad(d) (>1.0Å) Number 60 83 9 152 EW1av 120 32.9 x x EW1tot 7200 2700 x 9900 EW2av 43 x 21.7 x EW2tot 2580 x 200 2780 4428 Å EW1 5700 x x 5700 EW2 1220 x x 1220
Notes. See notes of Table2.
Fig. A.1. Wavelength dependence of the ratio R21 of the
equiva-lent widths of narrow DIBs in the lines of sight of HD 204827 and HD 183143 (Hobbs et al. 2008,2009) confirmed inFan et al.(2019), derived when a limit of 1.0 Å between narrow and broad DIBs is adopted (TableA.1). These DIBs are shown by red dots, except for the DIBs identified in Table1as ζ (Ensor et al. 2017; grey diamonds) or C2 (Thorburn et al. 2003; black triangles).
This appendix describes the small differences in the properties of the λ/R21 correlation with an alternative choice of 1.0 Å for
the limit between narrow and broad DIBs. This is expressed in TableA.1and Figs.A.1–A.3, which correspond to Table2and Figs.3–5with this new limit. A linear fit gives
logR21 = − 3.77 × 10⁻⁴×λ(A) + 2.23 ± 0.28 (A.1)
Fig. A.2.Same as Fig.A.1for broad DIBs (FW H M > 1.0 Å, TableA.1). These DIBs are shown by blue open squares, except for the DIBs iden-tified in Table 1as σ (Lan et al. 2015) which appear as orange full triangles.
Fig. A.3.Same as Fig.A.1for all DIBs (same as Fig.4of OBT19 and
Fig.5) with the same symbols as in Figs.A.1andA.2.
with a Pearson-correlation coefficient P = −0.62 for the narrow DIBs (Fig. A.1). These fit and Pearson coefficients are almost identical to those of Fig.3and Eq. (1) for a limit of 1.1 Å.
Appendix B: Expected dependence of R21on λ for
polyacenes
As shown in Sect. 3.1, Eq. (1), the wavelength dependence of the DIB intensity ratio, R21= EW(204827)/EW(183143), in the
sightlines HD 183143 and HD 204827 (Fig.3) may be fitted by the exponential relation
logR21 = − 3.7 × 10⁻⁴×λ(A) + 2.2 ± 0.33. (B.1)
In this appendix we explore the possible origin of this depen-dence in more detail if the DIB carriers are polyacenes or other elongated molecules with a similar series of strong optical bands.
As stated in OBT19 and Sect.1, this dependence may be qualita-tively expected from the strong dependence of the H photolysis of polyacenes on their length, while there is a linear progres-sion of the wavelength of the strong optical band of polyacenes with this length, as shown by Fig. 2 of OBT19, which may be extrapolated as
λ(A) ≈ 100 × NC+ 200 = 400 × N + 400, (B.2)
where the approximate argon-matrix shift, ∼200 Å, used in OBT19 is included and NC = 4 N + 2 is the number of carbon
atoms of the polyacene with N rings.
As recalled in OBT19, H photolysis is thought to be the main destruction process of polyacenes for the relevant range of N ∼ 10–18. Their abundances and the associated DIBs are therefore expected to be determined by the balance between H photol-ysis and H accretion onto their dehydrogenated counterparts, as in the standard theory of PAH photochemistry (e.g.Tielens 2005,2013). The most important parameter for determining the polyacene abundances vs. N or NCand the UV-radiation
proper-ties is the photodissociation probability, following a UV-photon absorption. This probability is proportional to exp(-E0/kTv) (see
e.g. Eq. (45) ofTielens 2013), where E0is related to the H
bind-ing energy and Tvis the internal vibrational temperature. Tv is
related to NC through the approximate relation (Tielens 2005,
Eq. (3))
Tv= 2000 × [EUV(eV)/NC]0.4. (B.3)
For a typical value EUV= 10 eV of the energy of the absorbed
UV photon in unshielded diffuse clouds, this yields Tv= 1130 K
and 940 K for N = 10 and 16 (NC= 42 and 66), respectively.
This corresponds to λ = 4400 Å and 6800 Å from Eq. (B.2), respectively.
When we assume E0= 3.52 eV (∼41 000 K) as in Andrews
et al. (2016), for example, the same values of NC yield
E0/kTv∼ 36 and 44, and exp(E0/kTv) ∼ 6 × 10¹⁵ and 1019,
respectively, which is a variation by a factor ∼1500 through the optical range ∼4400–6800 Å. This is two orders of magni-tude more than the variation by a factor ∼8 of R21 given by Eq.
(1). While it is probable that this exponential dependence of the PAH photodissociation rate is the origin of the observed λ/UV correlation, the latter can therefore not be proportional to this exponential factor.
Like other PAHs, the dehydrogenation of polyacenes varies extremely sharply around a critical value of NC
correspond-ing to a critical value of N, Ncr, so that the number of fully
hydrogenated polyacenes abruptly decreases to zero below Ncr
(OBT19). As seen from Eq. (B.3), the critical parameter for photodissociation is indeed NC/EUV, so that Ncr and the
corre-sponding λcrmust be roughly inversely proportional to EUV.
While the energies of UV photons are always distributed, the PAH photodissociation is dominated by the hardest UV photons around an effective EeUVff. In unshielded diffuse clouds, such as
on the sightline of HD 183143, EeUVff is expected to be ∼10–13 eV. Its value is substantially lower in UV-shielded regions, such as are found on the sightline of HD 204827, possibly by a factor up to ∼1.5. Ncrand λcrare expected to be reduced by a similar
fac-tor. This might explain why the DIBs with short wavelength are stronger and more numerous in HD 204827 than in HD 183143. This explanation seems compatible with the observed variation of R21 with λ (Fig. 3). However, a precise modelling of the
variation of R21 with λ aiming at quantitatively accounting the
observed correlation of Eq. (1) currently appears to be beyond reach because of the various sources of complexity, including (1) the uncertain nature of the possible elongated DIB carriers and their optical spectrum; even the spectrum of neutral poly-acenes is still uncertain for N > 11. (2) The complexity of the photochemistry of PAHs. (3) The complexity of the structure of the interstellar medium along any line of sight, inducing much uncertainty about the properties of the interstellar UV radia-tion field and its radiative transfer. In particular, it is certain that the sightline of HD 204827 is not entirely strongly shielded but has unshielded parts, at least at the boundary of denser clumps. It is also possible that HD 183143 has a few clumps that are significantly denser than the average.
This mixed character of the sightlines might explain a good part of the correlation. We assume, for instance, that (i) the sightline of HD 204827 includes 60% well-shielded regions that allow the inattenuate abundance of fully hydrogenated acenes down to N ∼ 11 (λ ∼ 4800 Å) and 40% unshielded regions sim-ilar to most of the sightline of HD 183143. We also assume that (ii) the sightline of HD 183143 includes 10% well-shielded regions and 90% unshielded regions where polyacenes are fully dehydrogenated for N <∼ 12 (λ <∼ 5500 Å) and fully hydrogenated for N >∼ 15 (λ >∼ 6500 Å). Based on this, we expect for the DIB ratio R21 = EW(204827)/EW(183143)
R21(5000 A) ≈ (60/10) × K × χ2T(N11)/χ1T(N11) (B.4)
R21(7000 A) ≈ K × χ2T(N16)/χ1T(N16), (B.5)
where χ1T(N) (χ2T(N)) is the total abundance of various
hydrogenation states of N-acene in the sightline of HD 183143 (HD 204827) and K is a constant. If the ratio χ2T(N)/χ1T(N) does
not vary strongly with N in this N range, this yields
R21(∼5000 A)/R21(∼7000 A) ≈ 6. (B.6)
This result is very close to the value, 5.5, given by Eq. (1) on the same wavelength interval for the fit of the observed corre-lation. This agreement is not very significant considering the uncertainties on the structure of the lines of sight. It nevertheless appears to confirm that the optical properties of large polyacenes or similar molecules might account for most of the observed R21/λ correlation. Moreover, the large number of cationic bands
expected at high λ may increase the steepness of the R21/λ