HAL Id: hal-00296557
https://hal.archives-ouvertes.fr/hal-00296557
Submitted on 23 May 2008
HAL is a multi-disciplinary open access
archive for the deposit and dissemination of
sci-entific research documents, whether they are
pub-lished or not. The documents may come from
teaching and research institutions in France or
abroad, or from public or private research centers.
L’archive ouverte pluridisciplinaire HAL, est
destinée au dépôt et à la diffusion de documents
scientifiques de niveau recherche, publiés ou non,
émanant des établissements d’enseignement et de
recherche français ou étrangers, des laboratoires
publics ou privés.
Estimation of Asian dust aerosol effect on cloud
radiation forcing using Fu-Liou radiative model and
CERES measurements
Jing Su, Jianping Huang, Qiang Fu, P. Minnis, Jinming Ge, Jianrong Bi
To cite this version:
Jing Su, Jianping Huang, Qiang Fu, P. Minnis, Jinming Ge, et al.. Estimation of Asian dust aerosol
ef-fect on cloud radiation forcing using Fu-Liou radiative model and CERES measurements. Atmospheric
Chemistry and Physics, European Geosciences Union, 2008, 8 (10), pp.2763-2771. �hal-00296557�
© Author(s) 2008. This work is distributed under the Creative Commons Attribution 3.0 License.
Chemistry
and Physics
Estimation of Asian dust aerosol effect on cloud radiation forcing
using Fu-Liou radiative model and CERES measurements
Jing Su1, Jianping Huang1, Qiang Fu1,2, P. Minnis3, Jinming Ge1, and Jianrong Bi1
1College of Atmospheric Science, Lanzhou University, Lanzhou, 730000, People’s Republic of China 2Department of Atmospheric Science, University of Washington, Seattle, WA, 98195, USA
3NASA Langley Research Center, Hampton, VA, 23666, USA
Received: 22 October 2007 – Published in Atmos. Chem. Phys. Discuss.: 5 February 2008 Revised: 10 April 2008 – Accepted: 9 May 2008 – Published: 23 May 2008
Abstract. The impact of Asian dust on cloud radiative forc-ing durforc-ing 2003–2006 is studied by usforc-ing the Clouds and Earth’s Radiant Energy Budget Scanner (CERES) data and the Fu-Liou radiative transfer model. Analysis of satellite data shows that the dust aerosol significantly reduced the cloud cooling effect at TOA. In dust contaminated cloudy regions, the 4-year mean values of the instantaneous short-wave, longwave and net cloud radiative forcing are −138.9, 69.1, and −69.7 Wm−2, which are 57.0, 74.2, and 46.3%, respectively, of the corresponding values in pristine cloudy regions. The satellite-retrieved cloud properties are signif-icantly different in the dusty regions and can influence the radiative forcing indirectly. The contributions to the cloud ra-diation forcing by the dust direct, indirect and semi-direct ef-fects are estimated using combined satellite observations and Fu-Liou model simulation. The 4-year mean value of com-bination of dust indirect and semi-direct shortwave radiative forcing (SWRF) is 82.2 Wm−2, which is 78.4% of the total dust effect. The dust direct effect is only 22.7 Wm−2, which is 21.6% of the total effect. Because both first and second indirect effects enhance cloud cooling, the aerosol-induced cloud warming is mainly the result of the semi-direct effect of dust.
1 Introduction
It is well known that aerosols have a profound impact on the global and regional climate. Determining the radiative effects of aerosols is currently one of the most active search areas in climate study (IPCC, 2007). Aerosols can re-flect and absorb the incoming solar radiation, which is called the aerosol direct radiative effect. They can increase cloud
Correspondence to: Jianping Huang
albedo and suppress precipitation by modifying cloud mi-crophysical properties, phenomena that are defined as the aerosol first and second indirect radiative effects, respec-tively (Twomey, 1977; Albrecht, 1989). Aerosols can also evaporate low-level clouds through so-called aerosol semi-direct effect (Grassl, 1975). Many observational and model-ing studies have focused on the aerosol “direct” radiative ef-fect, but recent research indicates that small changes in cloud microphysical properties (e.g., droplet size, phase) could in-duce large changes in cloud radiative forcing. Therefore, understanding and quantifying both the direct and indirect radiative effects are critically important in climate research (IPCC, 2007).
Dust storms that originate in Taklamakan Desert of China and the Gobi Desert of Mongolia occur frequently in recent years and become one of important aerosol types in East Asia (Huang et al., 2006a). The dust layers associated with these storms often travel thousands of kilometers at high al-titudes moving from the continent to the open sea near Korea and Japan (Haywood et al., 1999; Higurashi and Nakajima, 2002; Takemura et al., 2002). Moreover, Asian dust parti-cles, which could lead to both cooling by reflecting sunlight back to space and warming by absorbing solar and infrared radiation, make the radiative impact of Asian aerosols more complicated (Sokolik and Toon, 1999). Thus, it is impera-tive to examine the aerosol impact on radiaimpera-tive energy budget over East Asia where the aerosol sources are presumed to be much different from those in other regions.
Although there have been numerous studies about the ef-fect of dust aerosols on the radiative energy budget in clear skies, few have investigated the radiative effects of Asian dust in cloudy conditions. Huang et al. (2006a) studied the impacts of dust storms on cloud properties and radiative forcing (RF) using data collected by the Moderate Resolu-tion Imaging Spectroradiometer (MODIS) and Clouds and the Earth’s Radiant Energy System (CERES) instruments on the Aqua and Terra satellites. They found, on average, ice
2764 Jing Su et al.: Estimation of Asian dust effect on cloud radiation forcing
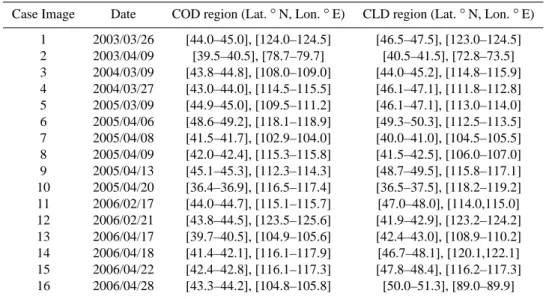
Table 1. Sixteen dust case images used in this study.
Case Image Date COD region (Lat.◦N, Lon.◦E) CLD region (Lat.◦N, Lon.◦E) 1 2003/03/26 [44.0–45.0], [124.0–124.5] [46.5–47.5], [123.0–124.5] 2 2003/04/09 [39.5–40.5], [78.7–79.7] [40.5–41.5], [72.8–73.5] 3 2004/03/09 [43.8–44.8], [108.0–109.0] [44.0–45.2], [114.8–115.9] 4 2004/03/27 [43.0–44.0], [114.5–115.5] [46.1–47.1], [111.8–112.8] 5 2005/03/09 [44.9–45.0], [109.5–111.2] [46.1–47.1], [113.0–114.0] 6 2005/04/06 [48.6–49.2], [118.1–118.9] [49.3–50.3], [112.5–113.5] 7 2005/04/08 [41.5–41.7], [102.9–104.0] [40.0–41.0], [104.5–105.5] 8 2005/04/09 [42.0–42.4], [115.3–115.8] [41.5–42.5], [106.0–107.0] 9 2005/04/13 [45.1–45.3], [112.3–114.3] [48.7–49.5], [115.8–117.1] 10 2005/04/20 [36.4–36.9], [116.5–117.4] [36.5–37.5], [118.2–119.2] 11 2006/02/17 [44.0–44.7], [115.1–115.7] [47.0–48.0], [114.0,115.0] 12 2006/02/21 [43.8–44.5], [123.5–125.6] [41.9–42.9], [123.2–124.2] 13 2006/04/17 [39.7–40.5], [104.9–105.6] [42.4–43.0], [108.9–110.2] 14 2006/04/18 [41.4–42.1], [116.1–117.9] [46.7–48.1], [120.1,122.1] 15 2006/04/22 [42.4–42.8], [116.1–117.3] [47.8–48.4], [116.2–117.3] 16 2006/04/28 [43.3–44.2], [104.8–105.8] [50.0–51.3], [89.0–89.9]
cloud effective particle diameter, optical depth and ice water path of cirrus clouds under dust-polluted conditions are 11%, 32.8%, and 42% less, respectively, than those derived from ice clouds in dust-free atmospheric environments. Due to the altered cloud microphysics, the instantaneous net cloud RF changed from −161.6 W/m2for dust-free conditions to
−118.6 W/m2 for dust-contaminated clouds. However, the above-mentioned results were based on only 10 cases. In this study, we will extend the study of Huang et al. (2006a) by considering more cases, and further separate the dust di-rect effect from the aerosol indidi-rect and semi-didi-rect effects on cloud radiative forcing using a radiative transfer model along with satellite data analysis. By examining the influ-ence of Asian dust aerosols on the radiative forcing both at the TOA and the surface, this study should lead to a better un-derstanding of the interactions among dust aerosols, clouds and radiation.
2 Data and methodology
Four years (June 2003 to June 2006) of CERES Aqua Edi-tion 1B Single Scanner Footprint (SSF; see Geier et al., 2001) data are used here. CERES SSF data sets combine CERES radiation measurements, MODIS cloud microphys-ical retrievals (Minnis et al., 20081) and ancillary meteorol-ogy fields to form a comprehensive, high-quality compilation of satellite-derived cloud, aerosol, and radiation budget infor-1Minnis, P., Sun-Mack, S., Young, D. F., Heck, P. W., Garber,
D. P., Chen, Y., Spangenberg, D. A., Wielicki, B. A., and Geier, E. B.: Cloud property retrievals for CERES using TRMM VIRS and Terra and Aqua MODIS data, IEEE Trans. Geosci. Remote Sens., submitted, 2008.
mation for radiation and climate studies. There are about 140 parameters in the SSF data set. The current analysis uses the following SSF parameters including IWP, LWP, cloud top ef-fective temperature (Te), cloud effective droplet radius (Re),
ice crystal diameter (De) and optical depth, which were de-rived with the Visible-Infrared-Solar-infrared-Split-window Technique (VISST; see Minnis et al., 2004, 20081). Flux measurements from CERES are used to estimate the instan-taneous RF. The CERES instruments measure broadband ra-diances at the top-of-the-atmosphere (TOA) in three spec-tral regions (0.2–5.0 µm; 8–14 µm; 5–100 µm) with a spa-tial resolution of about 20 km at nadir. These radiances are converted to TOA fluxes with angular distribution models selected according to the scene classification (Loeb et al., 2005).
To estimate the impact of Asian dust on both cloud ra-diative forcing and cloud microphysical properties, two re-gions were selected to represent the clouds in different envi-ronments in the data analysis. CLD (pure cloud) represents the area where clouds occurred in a dust-free atmosphere, while COD (cloud-over-dust) denotes the clouds are contam-inated by dust. The CLD and COD regions are determined based on both MODIS images and surface meteorology sta-tion observasta-tions over China and Mongolia (Huang et al., 2006a). The surface stations report dust events in four cate-gories: dust storm, wind-blown sand, floating dust, and no-dust. A cloudy region observed by the satellite is defined as CLD, if the surface observation is no-dust, or as COD, if the surface observation is dust storm, wind-blown sand, float-ing dust. Table 1 shows information for the 16 selected dust cases used in this study. These selected cases occurred dur-ing the 2003–2006 time period. Although the dust events of-ten occur in dry regions, especially over desert region, most
dust events are caused by cold front system or cyclone sys-tem which can carry the cloud to dry region. For example, all dust cases studied in our paper except of the case 2 were associated with the Mongolian cyclone system. In the Mon-golian cyclone system, the clouds formation often occur in warmer and moister air ahead of cold front and dust storms are generally at the edges of cold fronts, thereby the COD re-gions locate in the similar air condition of the ahead of cold front.
Cloud radiative forcing is a parameter that has been used extensively to study cloud-radiation interactions. Here, we use the outgoing short-wave (SW) and long-wave (LW) TOA fluxes to examine the cloud radiative forcing. The cloud radiative forcing is defined as the difference in the fluxes between the clear-sky and actual sky conditions (Charlock and Ramanathan, 1985; Hartmann et al., 1986; Ramanathan, 1987; Cess and Potter, 1987; Ramanathan et al., 1989.).
The SW and LW fluxes are defined at the TOA and surface levels as TSW=FdownSW −FupSW TLW=FdownLW −F up LW (1)
and cloud radiative forcing is given as CSW=TSW−TCLRSW
CLW=TLW−TCLRLW CNET=CSW+CLW
(2)
where FdownSW (FupSW) and FdownLW (FupLW) are downward (upward)
SW and LW fluxes, respectively. The index “CLR” denotes clear-sky scenes: those without clouds and dust aerosols. Thus, the cloud radiative forcing derived in this study for COD conditions includes the radiative effects of both clouds and dust aerosols.
3 Radiation transfer model
The radiation transfer model originally developed by Fu and Liou (1992, 1993) and modified by Rose and Charlock (2002) is used to elucidate the observation results. It is a delta-four stream radiative transfer code with fifteen spec-tral bands from 0.175 to 4.0 µm in the SW and twelve LW spectral bands between 2850 and 0 cm−1. The correlated k-distribution method is used to treat the non-gray gaseous ab-sorption due to H2O, CO2, O3, N2O, and CH4(Fu and Liou, 1992). The surface albedo spectral dependencies are taken into account using a lookup table based on IGBP scene type. The radiation model allows for the input of multiple wave-length aerosol optical depth measurements while the aerosol wavelength-dependent single scatter albedo and asymmetry parameter are determined by choosing an assumed aerosol type or mixture of constituents.
-350 -300 -250 -200 -150 -100 -50 0 2003 2004 2005 2006 C lo u d R a d ia ti v e F o r c in g (W m -2 ) SW RF (COD) SW RF (CLD) 0 20 40 60 80 100 120 140 2003 2004 2005 2006 C lo u d R a d it iv e F o r c in g (W m -2 ) LW RF (COD) LW RF (CLD) -250 -200 -150 -100 -50 0 2003 2004 Year2005 2006 C lo u d R a d ia ti v e F o r c in g (W m -2 ) NET RF (COD) NET RF (CLD)
Fig. 1. Annual mean instantaneous TOA dusty (COD) and dust-free (CLD) cloud Fig. 1. Annual mean instantaneous TOA dusty (COD) and dust-free
(CLD) cloud radiative forcing for (a) SW forcing, (b) LW forcing and (c) Net forcing.
4 Result analysis
Figure 1 shows the histograms of the annual mean instan-taneous TOA CRF for dust-free cloud (CLD) and dusty cloud (COD) regions for 2003–2006. In each of these 4 years, the (absolute) values of SW, LW and Net forcing in COD region are all smaller than those derived from CLD ar-eas. The 4-year average values of SW, LW and Net CRF are −138.9, 69.1, and −69.7 Wm−2, respectively, for COD
2766 Jing Su et al.: Estimation of Asian dust effect on cloud radiation forcing
Fig. 2. Comparison of TOA dusty (COD) and dust-free (CLD) instantaneous cloud Fig. 2. Comparison of TOA dusty (COD) and dust-free (CLD)
in-stantaneous cloud radiative forcing as a function of solar zenith an-gle for (a) SW forcing, (b) LW forcing , and (c) Net forcing.
regions. These values are only 57.0, 74.2, and 46.3% of those in CLD regions, respectively. Figure 1 indicates that the dust reduces the cloud modulation of the radiative energy budget including the cloud albedo (cooling) and greenhouse (warm-ing) effects as well as the total cloud cooling effect. These re-sults are consistent with Huang et al. (2006a) except that the net CRF in the COD regions is 40% lower. It may be due to stronger dust storms during 2005 and 2006 than during 2003 and 2004. Both previous studies (Huang et al., 2006a, b) suggest that the existence of dust under clouds significantly reduces the cooling by clouds. The reduced cooling due to
Fig. 3. Same as Fig. 2 but as a function of cloud optical depth.
dust in the COD regions can be considered as a warming ef-fect of these aerosols. To confirm that the subtle differences in CRF are not caused by the clouds themselves, we compare the CRF in the CLD and COD regions as a function of solar zenith angle (see Fig. 2) and cloud properties, such cloud top temperature, optical depth (see Fig. 3), particle size, and cloud water path.
Figures 2 and 3 compare the instantaneous SW, LW and Net CRF at TOA from the COD and CLD regions as func-tions of solar zenith and cloud optical depth, respectively. The absolute values of SW and Net CRF in Figs. 2a, c and 3a, c in COD regions are significantly smaller than those in CLD areas. However, for LW CRF, as shown in Figs. 2b and
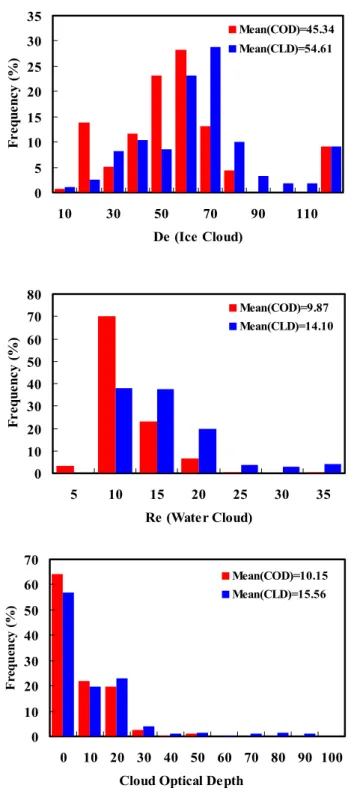
3b, the differences between the COD and CLD CRF values are less distinct, especially in Fig. 3b where the cloud optical depth is smaller than 35. The CRF differences between the COD and CLD conditions depend more on the cloud opti-cal depth than on the solar zenith angles (Figs. 2 and 3). The above analyses clearly show that cloud radiative forcing is in-fluenced by aerosols when dust plumes exist under the cloud. These influences include direct, indirect and semi-direct ef-fects of dust aerosols. Figure 4 shows the frequency distri-butions of ice cloud effective diameter (De), water cloud ef-fective radius (Re) and cloud optical depth for the COD and CLD regions. The mean values of De and Re in the COD regions are 17.0% and 30.0%, respectively, less than those derived from CLD region. In the dust polluted area (COD), the dust may serve as extra condensation nuclei which re-strain cloud particle growth and lead to the smaller values of
De and Re compared to those in CLD regions.
The smaller De/Re associated with the aerosol first and second indirect effects (Twomey, 1977; Albrecht, 1989) would enhance the cloud optical depth and cloud solar albedo. (Note that the cloud optical depth is proportional to the IWP/LWP but inversely proportional to the effective size of cloud particles.) The average COD cloud optical depth, 10.1, is, however, 34% smaller than that, 15.6, for CLD ar-eas. The decrease in the optical depth may be explained by the evaporation of low clouds due to the dust aerosol semi-direct effect that dominates the first and second insemi-direct ef-fects (Huang, et al., 2006b). Such a decrease may be also partly attributed to the aerosol radiative effects on surface fluxes and the hydrological cycle (Jiang and Feingold, 2006), although their relative contributions to the decrease of cloud optical depth remain as an important topic for future investi-gation. It is evident that the dust aerosol can change the cloud micro- and macro-physical properties and, thus, the CRF.
To further elucidate the dust effects, simulations were con-ducted using the Fu-Liou radiative transfer model. In the model calculations, the dust layer was placed below 4 km: the aerosol loading decreases exponentially with height and, at 4 km, it is 1/e of the surface value. The type of dust was selected as coarse mode. The single-scattering albedo and asymmetry factor of coarse mode dust are 0.7266 and 0.8613, respectively. Vertical profiles of temperature, pres-sure, humidity, and gaseous concentrations correspond to the mid-latitude summer (MLS) atmosphere of McClatchey et al. (1971). The cloud was placed between 3.5 and 5.5 km over a desert surface.
The direct effect of dust aerosols consists of scattering and absorption of incoming solar radiation. Because dust is an absorbing aerosol, it can exert different influences on the SW and LW fluxes at both the TOA and the surface. As dust opti-cal depth (τ ) increases (Fig. 5), the cooling resulting from the SW and Net CRFs decreases at the TOA, while it increases significantly at the surface. These differences imply that the dust aerosols decrease the cloud cooling effects at the TOA and increase the cloud cooling effects at surface. The
re-0 5 10 15 20 25 30 35 10 30 50 70 90 110 De (Ice Cloud) F r e q u e n c y ( % ) Mean(COD)=45.34 Mean(CLD)=54.61 0 10 20 30 40 50 60 70 80 5 10 15 20 25 30 35 Re (Water Cloud) F r e q u e n c y ( % ) Mean(COD)=9.87 Mean(CLD)=14.10 0 10 20 30 40 50 60 70 0 10 20 30 40 50 60 70 80 90 100 Cloud Optical Depth
F re q u en cy ( % ) Mean(COD)=10.15 Mean(CLD)=15.56
μ
μ
Fig. 4. Comparison of dusty and dust-free cloud properties for (a)
ice cloud De, (b) water cloud Re and (c) cloud optical depth. The histogram intervals are 5 µm for Re, 20 µm for De and 10 for opti-cal depth.
duced/enhanced cloud cooling effects are actually the direct warming/cooling effects due to dust aerosols. From Fig. 5, it is clear that when the aerosol optical depth increases by 0.1, the value of instantaneous SW CRF will change from 2.7 to
2768 Jing Su et al.: Estimation of Asian dust effect on cloud radiation forcing
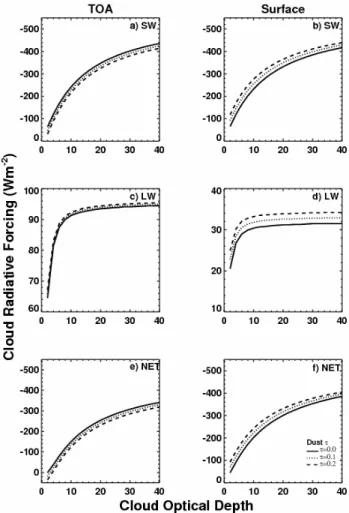
Fig. 5. Model simulated dusty instantaneous cloud radiative forcing as a function of solar
Fig. 5. Model simulated dusty instantaneous cloud radiative forcing
as a function of solar zenith angle for (a) TOA SW forcing, (b) surface SW forcing, (c) TOA LW forcing, (d) surface LW forcing,
(e) TOA net forcing, and (f) surface net forcing. The amount of
aerosol loading is indicated on the plots, and cloud optical depth is 16. The aerosol type is Coarse Mode. The surface type is desert.
15.7 Wm−2at TOA and −1.7 to −29.7 Wm−2at surface, de-pending on the solar zenith angles. When dust aerosols occur under clouds, their SW and Net warming effects at the TOA are due to the dust absorption, while both the absorption and scattering by dust prevent solar energy from reaching the sur-face and cause a cooling there. The difference in LW CRF between dust and dust-free cloudy skies is always positive because of the greenhouse effect of dust aerosols. But it is small because the longwave flux is relatively insensitive to the presence of dust. The impact of these aerosols on LW ra-diation at the TOA is smaller than that at the surface because the clouds above the aerosol layer mask any dust effect.
Figure 6 shows the instantaneous SW, LW and Net cloud radiative forcings at the TOA and surface as functions of cloud optical depth over desert surface. When the cloud op-tical depth changes, the dust still has a warming effect at the TOA and cools the surface. These simulation results suggest
Fig. 6. Same as Fig. 5 but as a function of cloud optical depth.
that as an absorbing aerosol, dust has the direct effect of di-minishing cloud cooling at the TOA, so, i.e., dust has a net warming direct effect at the TOA.
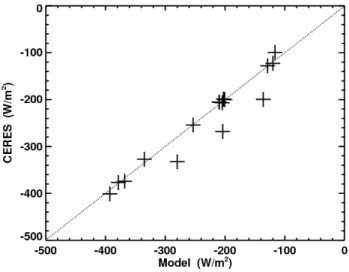
Satellite observations suggest that the total dust aerosol radiative forcing, which includes direct and, through cloud property changes, semi-direct and indirect effects (i.e., the difference in CRF between COD and CLD regions), is pos-itive at TOA. However, it is difficult, using only satellite observations, to separate the dust aerosol direct effect from those caused by altered cloud properties. To estimate the separate effects, we propose a simple method that uses both satellite observations and the model calculations. Figure 7 compares the CERES-measured instantaneous SW CRF val-ues with the Fu-Liou model simulation results for the CLD regions. The comparison shows good agreement between CERES observations and the Fu-Liou model simulation, in-dicating that the Fu-Liou model can reproduce the TOA ra-diation flux for dust-free cloud regions reasonably well. This result suggests that the contribution of dust aerosol direct and indirect/semi-direct effects can be estimated by using the differences between the satellite observations and the model simulations.
Fig. 7. Comparison of the instantaneous dust-free cloud CRF value (in CLD region) of
Fig. 7. Comparison of the instantaneous dust-free cloud CRF value
(in CLD region) of CERES measurements with Fu-Liou model sim-ulation.
The procedure for estimating the contribution of dust indi-rect and semi-diindi-rect effect is as follows:
1. Retrieve the dusty and dust-free cloud properties (i.e. cloud optical depth, Re, De, cloud top pressure) through satellite measurements.
2. Simulate the dusty and dust-free cloud RF using satellite-retrieved cloud properties as input parameters. (Note that the dust optical depth was set to be zero in both simulations, although the cloud properties were changed by dust aerosols in the COD regions).
3. The total dust aerosol radiative forcing including direct and semi-direct and indirect effects is
ARFtotal=FCERES(COD)−FCERES(CLD)
where FCERES(COD) and FCERES(CLD) are the radia-tive energy budgets at the TOA from CERES observa-tions under COD and CLD condiobserva-tions, respectively. 4. The combination of dust aerosol indirect and
semi-direct forcing related to cloud property changes is ARFindirect+semi=Fmodel(COD)−Fmodel(CLD)
where Fmodel is the radiative energy budget at the TOA from the Fu-Liou model computed using satellite-retrieved cloud properties, as in steps 1 and 2.
5. The direct radiative forcing due to dust aerosols is ARFdirect=ARFtotal−ARFindirect+semi
In other words, dust direct radiative forcing is the total dust radiative forcing in clear sky conditions.
Fig. 8. The mean values of direct and combination of indirect and
semi-direct instantaneous SWRF at TOA for 16 cases. The numbers represent the percentage of direct (direct/total).
The averaged dust aerosol direct and combination of indi-rect and semi-diindi-rect effects on the instantaneous SW RF at TOA for the selected cases are shown in Table 2. The aver-aged direct, and combined indirect and semi-direct instanta-neous SW RF are 22.7 and 82.2 Wm−2, respectively, which correspond, respectively, to 21.6 and 78.4% of the total RF value. The dust aerosol direct effect of 22.7 Wm−2as derived from the satellite-measured radiation and cloud properties here is within the range of those from the model computa-tions as shown in Figs. 5 and 6 (where the dust aerosol direct radiative forcing is the difference between the dashed/dotted line and solid line). The percentages of direct and combined indirect and semi-direct RF at TOA for the 16 selected cases are shown in Fig. 8. It is obvious from Table 2 and Fig. 8 that the combination of dust indirect and semi-direct effects is the primary contributor to the dusty cloud warming effect.
5 Conclusion and discussion
Asian dust aerosols have important influences on the radia-tive energy budget through both the direct effect and effects on the cloud microphysical properties. Most previous analy-ses of aerosol radiative forcing were limited to clear sky only (direct forcing). Recent studies have found that dust plays an important role in modulating climate through the indirect aerosol effect on cloud properties (Sassen et al., 2003). Our analyses of satellite observations show that the absolute val-ues of instantaneous TOA CRF in COD regions are signif-icantly smaller than those derived from CLD regions. This implies that when dust exists under a cloud it has a warm-ing influence at TOA. It is clearly evident from analysis of satellite data that dust aerosols can change cloud microphys-ical properties, such as water droplet radius or effective ice particle diameter and cloud optical depth. These properties consistently yield smaller values when derived from COD
2770 Jing Su et al.: Estimation of Asian dust effect on cloud radiation forcing
Table 2. Comparison of the averaged instantaneous RF effect at TOA.
Mean SWRF Standard Deviation Mean Percentage Standard Deviation Wm−2 (direct/total)
Direct effect 22.7 44.45 19.21% 9.80% Indirect effect 82.2 41.15
regions as compared to those derived over CLD regions. The results presented here are consistent with our previous study (Huang et al., 2006a). The warming effects of dust aerosols at TOA through dust aerosol direct effects in COD regions were also indicated by Fu-Liou model simulation.
Although the impact of the indirect/semi-direct effect of dust aerosols can be seen from the satellite-retrieved cloud microphysical properties, it is difficult to separate those ef-fects on the radiative energy budget from their direct effect using satellite observations alone. This study has proposed a new approach by combining observation and simulation re-sults to quantify the indirect and semi-direct effects of dust aerosols as well as their direct effect. Satellite observations along with the radiative transfer calculations show that the dust aerosol indirect and semi-direct effects dominate the dust aerosol total RF. The four-year (2002–2006) combined average indirect and semi-direct instantaneous shortwave ra-diative forcing (SWRF) is 82.2 Wm−2, a value that accounts for 78.4% of the total RF value. The dust aerosol direct effect of 22.7 Wm−2 as derived from satellite radiation and cloud observations here is within the range of those determined from the model simulations. Because both the first and sec-ond indirect effects cause cooling at TOA, the warming ef-fect of dust aerosols in cloud-over-dust systems is due to the semi-direct effect of dust aerosols (Huang et al., 2006b). Al-though this paper is only a preliminary study of Asian dust effects in cloudy conditions, it sets the stage for more in-depth analyses by providing a method to separate the various types of aerosol effects. The use of other datasets in combi-nation with the model and CERES data will further enhance the quantification of the different effects.
Acknowledgements. This research is supported by the National
Sci-ence Foundation of China under grant (40628005 and 40633017), and National Basic Research Program of China (2006CB400501). Qiang Fu is also supported by the NASA Grant NNG04GM23G. Additional support was provided by the NASA Science Mission through the CERES Project. The CERES SSF data were obtained from the NASA Earth Observing System Data and Information System, Distributed Active Archive Center (DAAC) at the Langley Research Center.
Edited by: J. Quaas
References
Albrecht, B. A.: Aerosols, cloud microphysics, and fractional cloudiness, Science, 245, 1227–1230, 1989.
Cess, R. D. and Potter, G. L.: Exploratory studies of cloud radiative forcing with a general circulation model, Tellus, 39A, 460–473, 1987.
Charlock, T. P. and Ramanathan, V.: The albedo field and cloud radiative forcing produced by general circulation model with in-ternally generated cloud optics, J. Atmos. Sci., 42, 1408–1429, 1985.
Cook, J. and Highwood, E. J.: Climate response to tropospheric ab-sorbing aerosol in an intermediate general-circulation model, Q. J. Roy. Meteor. Soc., 130, 175–191, doi:10.1256/qj.03.64, 2003. Forster, P., Ramaswamy, V., Artaxo, P., Berntsen, T., Betts, R., Fa-hey, D. W., Haywood, J., Lean, J., Lowe, D. C., Myhre, G., Nganga, J., Prinn, R., Raga, G., Schulz, M., and Van Dorland, R.: Changes in Atmospheric Constituents and in Radiative Forc-ing, in: Climate Change 2007: The Physical Science Basis. Con-tribution of Working Group I to the Fourth Assessment Report of the Intergovernmental Panel on Climate Change, edited by: Solomon, S., Qin, D., Manning, M., Chen, Z., Marquis, M., Av-eryt, K. B., Tignor, M., and Miller, H. L., Cambridge University Press, Cambridge, United Kingdom and New York, NY, USA, 131–217, 2007.
Fu, Q. and Liou, K. N.: On the correlated k-distribution method for radiative transfer in nonhomogenous atmospheres, J. Atmos. Sci., 49, 2139–2156, 1992.
Fu, Q. and Liou, K. N.: Parameterization of the radiative properties of cirrus clouds, J. Atmos. Sci., 50, 2008–2025, 1993.
Geier, E. B., Green, R. N., Kratz, D. P., Minnis, P., Miller, W. F., Nolan, S. K., and Franklin, C. B.: Single satellite foot-print TOA/surface fluxes and clouds (SSF) collection document, available at: http://asd-www.larc.nasa.gov/ceres/ASDceres.html, 2001.
Grassl, H.: Albedo Reduction and Radiative Heating of Clouds by Absorbing Aerosol Particles, Contrib. Atmos. Phys., 48, 199– 210, 1975.
Haywood, J. M., Ramaswamy, V., and Soden, B. J.: Tropospheric aerosol climate forcing in clear-sky satellite observations over the oceans, Science, 283, 1299–1305, 1999.
Hartman, D. L., Ramanathan, V., Berroir, A., and Hunt, G. E.: Earth radiation budget data and climate research, Rev. Geophys. Space Phys., 24, 439–468, 1986
Higurashi, A. and Nakajima, T.: Detection of aerosol types over the East China Sea near Japan from four-channel satellite data, Geo-phys. Res. Lett., 29, 1836, doi:10.1029/2002GL015357, 2002. Huang, J. P., Minnis, P., Lin, B., Wang, T., Yi, Y., Hu, Y.,
Sun-Mack, S., and Ayers, K.: Possible influences of Asian
dust aerosols on cloud properties and radiative forcing ob-served from MODIS and CERES, Geophys. Res. Lett., 30, 6824, doi:10.1029/2005GL024724, 2006a.
Huang, J. P., Lin, B., Minnis, P., Wang, T., Wang, X., Hu, Y., Yi, Y., and Ayers, J. K.: Satellite-based assessment of possible dust aerosols semi-direct effect on cloud water path over east Asia, Geophys. Res. Lett., 33, L19802, doi:10.1029/2006GL026561, 2006b.
McClatchey, R. A., Fenn, R. W., Selby, J. E. A., Volz, F. E., and Gar-ing, J. S.: Optical properties of the atmosphere, Rep. AFCRL-71-0279, Air Force Cambridge Res. Lab., Bedford, Massachusetts, 85 pp., 1971.
Parry, M. L., Canziani, O. F., Palutikof, J. P., van der Linden, P.J., and Hanson, C. E. (Eds.): Climate Change 2007 (IPCC2007): Impacts, Adaptation and Vulnerability, Cambridge University Press, Cambridge, UK, 2007.
Jiang, H. and Feingold, G.: Effect of aerosol on warm convec-tive clouds: Aerosol-cloud-surface flux feedbacks in a new coupled large eddy model, J. Geophys. Res., 111, D01202, doi:10.1029/2005JD006138, 2006.
Loeb, N. G., Kato, S., Loukachine, K., and Manalo-Smith, N.: An-gular distribution models for top-of-atmosphere radiative flux es-timation from the Clouds and Earth’s Radiant Energy System instrument on the Terra satellite. Part 1 methodogy., J. Atmos. Ocean. Tech., 22, 338–351, 2005.
Minnis, P., Young, D. F., Sun-Mack, S., Trepte, Q., Chen, Y., Brown, R. R., Gibson, S. L., and Heck, P. W.: Diurnal, seasonal, and interannual variations of cloud properties derived for CERES from imager data, 13th Conference on Satellite Oceanography and Meteorology, Norfolk, VA, 20–24 September, CD-ROM, P6.10, 2004.
Ramanathan, V.: The role of Earth radiation budget studies in cli-mate and general circulation Research, J. Atmos. Sci., 37, 447– 454, 1987.
Ramanathan, V., Cess, R. D., Harrison, E. F., Minnis, P., Barkstrom, B. R., Ahmad, E., and Hartmann, D.: Cloud-radiative forcing and climate: results from the Earth Radiation Budget Experiment, Science, 243, 57–63, 1989.
Rose, F. G. and Charlock, T. P.: New Fu-Liou Code Tested with ARM Raman Lidar and CERES in pre-CALIPSO Exercise, Ex-tended abstract for 11th Conference on Atmospheric Radiation (AMS), Ogden, Utah, 3–7 June 2002, 2002.
Sassen, K., Zhu, J., and Benson, S.: A midlatitude cirrus cloud climatology from the Facility for Atmospheric Remote Sensing: IV. Optical displays, Appl. Opt., 42, 332–341, 2003.
Sokolik, I. N. and Toon, O. B.: Incorporation of mineralogical com-position into models of the radiative properties of mineral aerosol from UV to IR wavelengths, J. Geophys. Res., 104, 9423–9444, 1999.
Takemura, T., Uno, I., Nakajima, T., Higurashi, A., and Sano I.: Modeling study of long-range transport of Asian dust and an-thropogenic aerosols from East Asia, Geophys. Res. Lett., 29, 2158, doi:10.1029/2002GL016251, 2002.
Twomey, S.: Developments in Atmospheric Science, Atmospheric Aerosols: Elsevier, Elsevier Scientific Publications, New York, USA, 1977.