HAL Id: hal-03004908
https://hal.archives-ouvertes.fr/hal-03004908
Submitted on 13 Nov 2020HAL is a multi-disciplinary open access archive for the deposit and dissemination of sci-entific research documents, whether they are pub-lished or not. The documents may come from teaching and research institutions in France or abroad, or from public or private research centers.
L’archive ouverte pluridisciplinaire HAL, est destinée au dépôt et à la diffusion de documents scientifiques de niveau recherche, publiés ou non, émanant des établissements d’enseignement et de recherche français ou étrangers, des laboratoires publics ou privés.
The Complex Vertical Motion of Intraplate Oceanic
Islands Assessed in Santiago Island, Cape Verde
F. o. Marques, A. Hildenbrand, H. Zeyen, C. Cunha, S. s. Victória
To cite this version:
F. o. Marques, A. Hildenbrand, H. Zeyen, C. Cunha, S. s. Victória. The Complex Vertical Motion of Intraplate Oceanic Islands Assessed in Santiago Island, Cape Verde. Geochemistry, Geophysics, Geosystems, AGU and the Geochemical Society, 2020, 21 (3), �10.1029/2019GC008754�. �hal-03004908�
This is the peer reviewed version of the following article:
Marques, F. O., Hildenbrand, A., Zeyen, H., Cunha, C., & Victória, S. S. (2020). The complex vertical motion of intraplate oceanic islands assessed in Santiago Island,
Cape Verde. Geochemistry, Geophysics, Geosystems, 21, e2019GC008754. https://doi.org/10.1029/2019GC008754, which has been published in final form at
https://doi.org/10.1029/2019GC008754.
This article may be used for non-commercial purposes in accordance with Wiley Terms and Conditions for Use of Self-Archived Versions
The complex vertical motion of intraplate oceanic islands
1assessed in Santiago Island, Cape Verde
2F.O. Marques
a*, A. Hildenbrand
b, H. Zeyen
b, C. Cunha
c, S.S. Victória
d3
a Universidade de Lisboa, Lisboa, Portugal
4
b GEOPS, Université Paris-Sud, CNRS, Université Paris-Saclay, 91405 Orsay, France
5
c Instituto Politécnico de Coimbra, Escola Superior Agrária, Coimbra, Portugal
6
d Universidade de Cabo Verde, Praia, Cabo Verde
7 8
*Corresponding author. Tel.: +351 217500000; Fax: +351 217500064
9
E-mail address: [email protected]
10 11
Abstract
12
Dated paleo-sea level markers and eustatic sea level changes are necessary but not sufficient
13
information to calculate vertical motion rates on oceanic islands. Therefore, we use a procedure in 14
which we work progressively back in time to incorporate the more recent vertical motion rates 15
implied by the youngest paleoshorelines into the vertical motion history of all older shorelines. 16
Specifically, we calculate the time-averaged vertical motion rates required to explain the present-17
day elevations of the dated sequence of paleoshorelines on Santiago volcanic island (Cape Verde). 18
We thus obtain a vertical motion history consisting of time-averaged vertical motion rates spanning 19
the five intervening periods between paleoshoreline formation and the present day: (1) 5.06 to 3.29
20
Ma – seamount growth or island subsidence because all the rocks in this period are submarine; (2)
21
fast uplift (ca. 0.96 mm/a) from 3.29 to 2.87 Ma, mostly responsible for putting submarine lavas
currently close to 410 m altitude; (3) relatively fast subsidence (ca. -0.11 mm/a) between 2.87 and
23
2.18 Ma; (4) stagnation from 2.18 to 0.811 Ma; (5) relatively fast uplift (ca. 0.14 mm/a) between
24
0.811 and 0 Ma. We numerically tested top-down (volcanic loading) and bottom-up (lithosphere
25
thinning, underplating and mantle plume) mechanisms to explain the inferred vertical movements,
26
and we conclude that volcanic loading and crustal underplating are capable of producing the
27
observed subsidence and uplift, respectively.
28 29
Plain Language Summary
30
Oceanic volcanic islands experience vertical movements during their lifetime, which can be
31
the consequence of several mechanisms like bending of the lithosphere due to the island’s weight
32
(subsidence), or horizontal intrusion of magma below the volcanic edifice (uplift). In order to
33
discriminate among the possible mechanisms, we must correctly estimate the successive vertical
34
displacements and motion rates. We account for eustatic sea level change and use dated
35
paleoshorelines, working progressively back in time to incorporate the more recent vertical motion
36
rates implied by the youngest paleoshorelines into the vertical motion history of all older
37
shorelines, to obtain a step-by-step vertical motion history:: (1) 5.06 to 3.29 Ma – seamount growth
38
or island subsidence because all the rocks in this period of time are submarine; (2) fast uplift (ca.
39
0.96 mm/a) from 3.29 to 2.87 Ma mostly responsible for putting submarine lavas currently close to
40
410 m altitude; (3) relatively fast subsidence (ca. -0.11 mm/a) between 2.87 and 2.18 Ma; (4)
41
stagnation from 2.18 to 0.811 Ma; (5) relatively fast uplift (ca. 0.14 mm/a) between 0.811 and 0
42
Ma. From analytical and numerical modeling we conclude that volcanic loading and crustal
43
underplating are likely mechanisms to explain the observed vertical displacements.
44 45
Keywords: uplift and subsidence rates of oceanic islands; vertical displacement in Santiago Island,
46
Cape Verde; sea level changes; paleoshorelines; passage zones; topography response to isostasy
47 48
1. Introduction
49
The vertical motion of oceanic islands records the interactions between volcanic load,
50
mantle flow and lithospheric reaction to both. An important step toward understanding the
51
mechanisms responsible for the vertical motions in volcanic ocean islands is therefore the
52
estimation of rates of vertical displacement. When one finds a submarine lava flow currently at 400
53
m altitude on an island, it means that the island was uplifted, because no specific eustatic sea level
54
change can, by itself, explain such position. The problem is that we do not know when and how the
55
uplift took place. As an end member, one can assume that the uplift was linear from the time of
56
formation of the rock to present day (e.g. Ramalho et al., 2010a, c). If the rock is 4 Ma old, then
57
400 000 mm divided by 4,000,000 a equals 0.1 mm/a. But this assumption can be grossly wrong if
58
geological evidence indicates that the uplift is much younger or in a much shorter period of time. If
59
the rock is 4 Ma but uplift occurred only in the last 1Ma, then the uplift rate is 0.4 mm/a, i.e. 4
60
times greater than the linear estimate. If uplift occurred at 4 Ma but over a short period of time of
61
0.4 Ma, then the uplift rate would be 1 mm/a, i.e. one order of magnitude greater than the linear
62
estimate. Finally, we also do not know how the submarine rock currently observed at 400 m altitude
63
got there: was it by jerks? Or was it intercalated with periods of subsidence and/or quiescence? The
64
unravelling of these problems is the main objective of this work. In the end, we use analytical
65
solutions and numerical modeling to find likely mechanisms capable of explaining such vertical
66
displacements, based on the case of Santiago Island in Cape Verde.
67
The calculation of vertical motion rates in an oceanic island depends critically on two
parameters: position of a paleosealevel marker at a given time. Therefore, determining the current
69
elevation as well as the age and depth of formation of a paleoshoreline indicator are required to
70
calculate vertical motion rates. To accomplish this fundamental objective, we looked for field
71
evidence that allows us to determine the position of a given rock in space and time: lavas in a
72
passage zone (transition from subaerial to submarine flow defining the paleoshoreline), preferably
73
with in situ shallow water fossils, and which are most suitable for K-Ar dating.
74
Paleoshorelines record relative sea level, therefore their elevation above or below current
75
sea level results from changes in both land and/or glacio-eustatic sea level, which has changed over
76
time (e.g. Bintanja et al., 2005; De Boer et al., 2010; Hansen et al., 2013; Miller et al., 2005, 2011).
77
Therefore, when analyzing vertical motions in a volcanic island, the eustatic variations of sea level
78
must be considered.
79
The use of paleoshorelines and glacio-eustatic sea level curves has been used in previous
80
works, as the methodology to assess an island’s vertical motion rate (e.g. Cas and Wright, 1987;
81
Jones, 1969; Jones and Nelson, 1970; Porebski and Gradzinski, 1990; Ramalho et al., 2013).
83
Figure 1. Annotated Google Earth image showing geographic location and tectonic setting of the
84
Cape Verde archipelago.
85
86
The Cape Verde Archipelago comprises ten islands located about 700 km west of Dakar in
87
Senegal (Fig. 1). They lie on Jurassic-Cretaceous seafloor, which is the basement above which the
88
Cape Verde Rise and islands rise 2 to 8 km, respectively. Santiago Island, the target of the study
89
reported here, is one of the islands where evidence for large vertical motion can be found. Previous
90
work (Ramalho et al. 2010a, c) deduced a linear relationship between the vertical displacement and
91
age of paleoshorelines on the island, implying a constant uplift rate over the past ~4 Ma. Such a
92
relation seems incompatible with the isostatic response of the lithosphere to the complex evolution
93
of an ocean volcanic island, which encompasses major episodes of construction and
94
erosion/destruction (top-down forcing) as well as mantle/crustal processes like crustal underplating
95
(bottom-up forcing).
The main objective was to introduce a new methodology to estimate rates of vertical motion
97
at time intervals between paleoshoreline formation, and discuss possible mechanisms responsible
98
for vertical displacement. To accomplish these objectives, we used the following methodology:
99
analysis of aerial imagery for geomorphological and geological interpretation; fieldwork to
100
recognize the major unconformities and volcanic units, to unravel the geometry and position of
101
main volcanoes, and to find the critical paleodepth markers (paleoshorelines); sampling for
high-102
precision K-Ar dating, used to calibrate the volcanic stratigraphy and to obtain the ages of the
103
critical paleodepth markers.
104 105
2. Geological setting
106
Santiago is the largest of the ten inhabited islands in Cape Verde. It is elongated NNW-SSE,
107
it shows rugged topography with large (km wide) and deep (up to 1 km) canyons (Fig. 2A), and
108
peaks at 1394 m at Pico da Antónia, in the center-south of the island. The northern two thirds of the
109
island are cut by deep valleys, but, in places (e.g. west of Assomada village, center of the island),
110
rugged paleotopographies can still be recognized comprising major unconformities filled with
111
younger lavas (Fig. 3).
112 113
114
Figure 2. A – digital elevation model showing the main morphological features of Santiago, and
115
relevant ages (in Ma) from previous studies. B – geological map of study region, (Serralheiro,
116
1976) with simplified volcanic stratigraphy, sample locations (green stars), sample references, and
117
ages obtained in the present work.
The volcanic stratigraphy of the island, based on unconformity bounded stratigraphic units,
119
is well established (Serralheiro, 1976). (Fig. 2). However, the geological map shows important
120
inconsistencies, as suggested previously by Holm et al. (2008) and indicated here for, at least, the
121
Porto Rincão and Águas Belas creeks. The volcanic stratigraphy of the island comprises five main
122
volcanic complexes (Serralheiro (1976), the local names of which have no meaning to the common
123
reader. Therefore, we introduce here more intuitive names for the different volcanic complexes,
124
which are from bottom to top (Fig. 2B):
125
(1) the Basement Complex (former Complexo Antigo of Serralheiro, 1976) – deeply eroded unit
126
mostly composed of intensely altered igneous rocks pervasively intruded by dykes and small
127
pockets of plutonic rocks. The Basement Complex may represent an early submarine edifice
128
(Serralheiro, 1976), but its original setting (submarine or sub-aerial) is still disputed. Biotite
129
from a foidal gabbro, and biotite/phlogopite from carbonatites in the Basement Complex were
130
dated at ca. 10 Ma (Bernard-Griffiths et al., 1975), which can be regarded as the minimum age
131
for the Basement Complex because the dated rocks occur high in this unit.
132
(2) Lower Volcanic Complex (former Flamengos Formation) – this unit lies on the Basement
133
Complex through a major unconformity, and is, according to current knowledge, exclusively
134
composed of submarine lavas that outcrop from current sea level to an altitude of c. 410 m.
135
According to Holm et al. (2008), this major submarine complex formed in a few hundred
136
thousand years around 4.6 Ma.
137
(3) Intermediate Volcanic Complex (former Pico da Antónia Formation) – this unit overlies the
138
Basement Complex and the Lower Volcanic Complex through a major unconformity, in places
139
with a thick conglomerate, and is composed of subaerial flows that pass into submarine flows
140
close to the current coast. This unit outcrops from current sea level to an altitude of c. 1394 m at
Pico da Antónia, and was dated in the range 3.3 to 2.2 Ma (Holm et al., 2008).
142
(4) Upper Volcanic Complex (former Assomada Formation) – this unit is mostly composed of thick
143
subaerial lava flows unconformably overlying all previous units. The volcanic products of this
144
unit fill valleys deeply carved in the Lower and Intermediate Volcanic Complexes, in places
145
putting the Upper Volcanic Complex directly in contact with the Basement Complex (e.g. Águas
146
Belas Creek). According to all previous work (e.g. Serralheiro, 1976; Holm et al., 2008;
147
Ramalho et al., 2010a, c), the lava flows of this later volcanic period apparently did not reach the
148
sea (no pillow lavas recognized in this unit), as can be confirmed on the geological map
149
(Serralheiro, 1976).
150
(5) Young Volcanic Complex (former Monte das Vacas Formation of Serralheiro, 1976) – this unit
151
is made of Strombolian cones lying unconformably on all previous units, and it represents the
152
latest episode of volcanism. Holm et al. (2008) considered these two younger units (UVC and
153
YVC) together as “late volcanism”, for which they attributed an age between 1.1 and 0.7 Ma.
154 155
3. Field data
156
Field work carried out in the critical areas of the Flamengos (east Santiago), Porto Rincão
157
and Águas Belas (west Santiago) creeks revealed the existence of major unconformities, which
158
helped us better constrain the volcanic stratigraphy. We also found the critical outcrops comprising
159
passage zones, locally with in situ shallow water fossils (mouth of the Porto Rincão Creek), with
160
very fresh rock appropriate for reliable and precise dating by K-Ar.
162
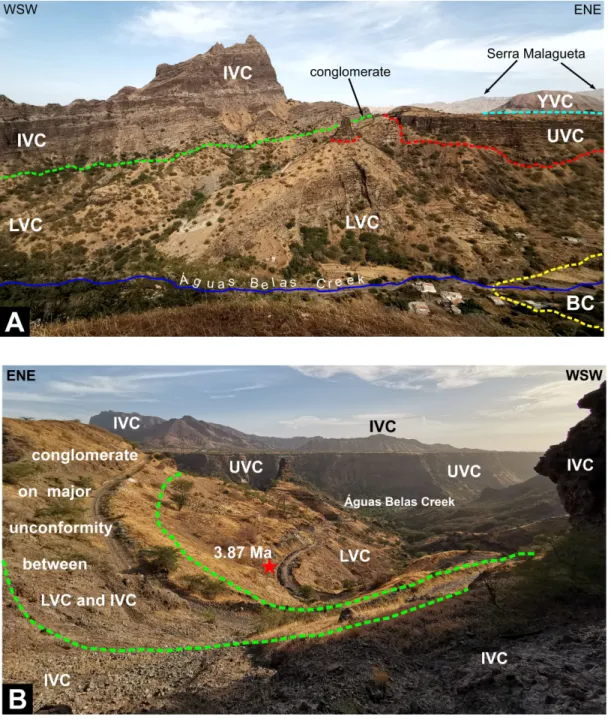
Figure 3. Annotated photographs taken to north (A) and south (B) of the Águas Belas creek with
163
volcanic stratigraphy based on main unconformities and calibrated by K-Ar dating. In both images,
164
especially in B, it is clear that the lava flows of the UVC fill deep valleys carved in both IVC and
165
LVC, which stand higher than the UVC despite being older. From bottom to top: BC – Basement
166
Complex unconformably overlain by LVC (yellow dashed line) and by UVC (out of the image);
167
LVC – Lower Volcanic Complex (submarine flows) unconformably overlain by IVC (green dashed
168
line) and by UVC (red dashed line); IVC – Intermediate Volcanic Complex (subaerial in the image)
169
unconformably overlying the LVC through a thick conglomerate, and unconformably overlain by
170
UVC; UVC – Upper Volcanic Complex made of subaerial flows filling a rugged topography carved
171
in BC, LVC and IVC, and passing into submarine flows close to the coast (west, out of the image).
The main geology in the deep Águas Belas valley (Fig. 3) shows a major unconformity,
173
filled with a very thick conglomerate, between the Intermediate Volcanic Complex and the
174
underlying Lower Volcanic Complex. This is not consistent with the geological map where the
175
underlying lavas are mapped as the submarine equivalent of the overlying Intermediate Volcanic
176
Complex.
177
The critical outcrops at the mouth of the Porto Rincão Creek show clear examples of
178
passage zones currently at ca. 43 m altitude (Supp. Fig. 1). Further upstream in the creek, we could
179
distinguish a different unit, still made of subaerial lavas passing into submarine, but with many
180
dykes cutting through the unit. The new ages confirmed that it is actually a different unit (cf. Fig.
181
4).
182
In the Flamengos valley, east Santiago, opposite to the Águas Belas valley, we can observe
183
two different sequences of submarine lava flows: (1) at the mouth of the Flamengos Creek, a well
184
preserved passage zone, ca. 20 m above current sea level, dated by Holm et al. (2008) at ca. 2.85
185
Ma (their samples 121367 and 121371), so confirming the geological map of Serralheiro (1976);
186
(2) a very thick sequence (Lower Volcanic Complex, former Flamengos Formation) of gently east
187
dipping submarine lava flows and pyroclasts up to ca. 420 m altitude, where we can observe the
188
unconformable contact with the overlying Upper Volcanic Complex (former Assomada Formation).
189
We could not find a passage zone in this unit, neither here nor in the Águas Belas valley, so we just
190
collected the uppermost submarine rocks just below the conglomerates making up the major
191
unconformity.
193
Supplementary Figure 1. Images from the Porto Rincão creek: A – passage zone with subaerial
194
flows passing into submarine, with in situ shallow water oyster fossils, as shown in B, and
195
sampled for geochronology; C – passage zone observed and sampled on the coast immediately
196
south of Porto Rincão. Location of samples given in Fig. 4.
198
Figure 4. A – geological map of study region (Serralheiro, 1976) annotated with ages reported
199
here. B – Perspective view of the topography, distribution of volcanic units, and their
200
geomorphological expression. From the new ages and geomorphology, we infer that the mapped
201
volcanic units are wrongly placed: (1) the Lower Volcanic Complex (LVC, former Flamengos
202
Formation, orange in the geological map) in the Porto Rincão creek is actually the submarine part
203
of the Intermediate Volcanic Complex (IVC, former Pico da Antónia Formation); (2) the submarine
204
IVC in the Porto Rincão creek (blue horizontal stripes in the geological map) is actually the
205
submarine part of the Upper Volcanic Complex (UVC, former Assomada Formation), which is
206
recognized here for the first time; (3) part of the subaerial IVC (PA and peach colour in the
207
geological map) is actually UVC, which form quite well preserved lava deltas; (4) the submarine
208
IVC in the Águas Belas creek (blue horizontal stripes in the geological map) is actually the entirely
209
submarine LVC.
4. K-Ar dating
211
4.1. Sampling strategy
212
We looked for passage zones and in situ shallow water fossils on pillow lavas (the critical
213
sea level markers) and collected samples in both submarine and subaerial lavas in the Porto Rincão
214
creek. In the absence of these ideal markers, we looked for submarine lavas and collected samples
215
from the base (oldest) and top (youngest) of the lava pile, which was the case in the Águas Belas
216
(western Santiago, immediately north of Porto Rincão creek) and Flamengos (eastern Santiago)
217
creeks.
218
Sampling was systematically carried out on well-identified lava flows. The central massive
219
part of the lava was extracted by means of hammers and chisels, and broken in-situ with a
sledge-220
hammer to reach the freshest, bubble-free core of the flow and reject any vesicle-rich part. We
221
carefully examined the rock in the field and discarded samples showing traces of weathering.
222 223
4.2. Analytical techniques – K-Ar dating on fresh separated groundmass 224
Thin sections of all samples were scrutinized to characterize the texture, and ensure the
225
freshness of samples. Most samples are mafic in composition, so the volcanic groundmass was
226
chosen for subsequent geochronological analyses. After crushing and sieving at an adequate grain
227
size (typically 63-125 µm or 125 - 250 µm), samples were washed in dilute nitric acid and rinsed
228
with deionized water. Magnetic separator and heavy liquids were systematically used to eliminate
229
phenocrysts (olivine, pyroxene, plagioclase), which may carry unsuitable excess-argon, and to
230
extract the unaltered and homogeneous fraction of the groundmass to obtain a meaningful eruption
231
age.
232 233
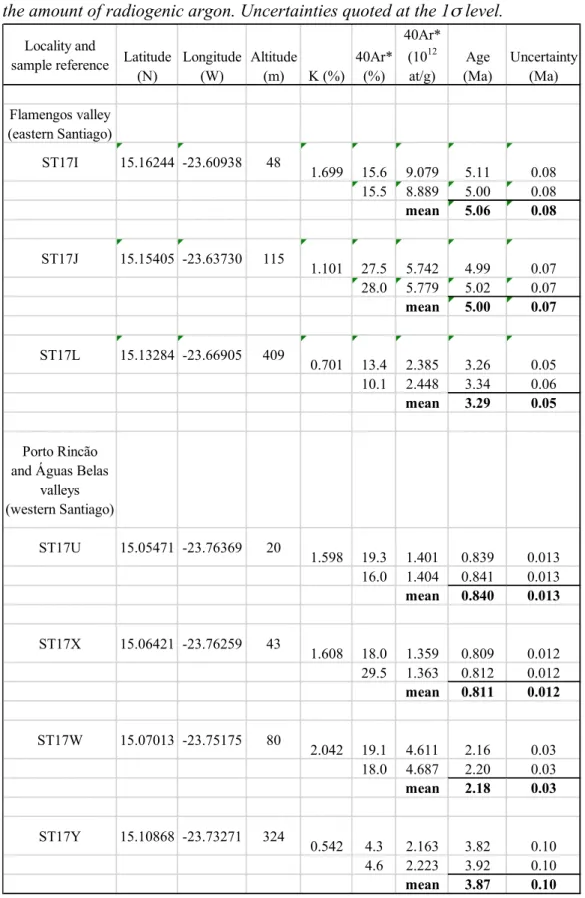
Table 1. Summary of the isotopic ages reported here, with sample locations and references,
234
geographical coordinates, and altitudes. For each sample, the mean age is obtained by weighing by
235
the amount of radiogenic argon. Uncertainties quoted at the 1σ level.
236
237
Locality and
sample reference Latitude (N) Longitude (W) Altitude (m) K (%) 40Ar* (%) 40Ar* (1012 at/g) Age (Ma) Uncertainty (Ma) Flamengos valley (eastern Santiago) ST17I 15.16244 -23.60938 48 1.699 15.6 9.079 5.11 0.08 15.5 8.889 5.00 0.08 mean 5.06 0.08 ST17J 15.15405 -23.63730 115 1.101 27.5 5.742 4.99 0.07 28.0 5.779 5.02 0.07 mean 5.00 0.07 ST17L 15.13284 -23.66905 409 0.701 13.4 2.385 3.26 0.05 10.1 2.448 3.34 0.06 mean 3.29 0.05 Porto Rincão and Águas Belas
valleys (western Santiago) ST17U 15.05471 -23.76369 20 1.598 19.3 1.401 0.839 0.013 16.0 1.404 0.841 0.013 mean 0.840 0.013 ST17X 15.06421 -23.76259 43 1.608 18.0 1.359 0.809 0.012 29.5 1.363 0.812 0.012 mean 0.811 0.012 ST17W 15.07013 -23.75175 80 2.042 19.1 4.611 2.16 0.03 18.0 4.687 2.20 0.03 mean 2.18 0.03 ST17Y 15.10868 -23.73271 324 0.542 4.3 2.163 3.82 0.10 4.6 2.223 3.92 0.10 mean 3.87 0.10
The samples were dated in Laboratory GEOPS (Univ. Paris-Sud, Orsay, France) with the
238
unspiked K-Ar Cassignol-Gillot technique (Gillot and Cornette, 1986; Gillot et al., 2006), which
239
allows the precise determination of small amounts of radiogenic argon (40Ar*) and is particularly
240
appropriate to date young volcanic rocks, including late quaternary low-K basalts and andesites
241
(e.g., Hildenbrand and Gillot, 2006; Hildenbrand et al, 2003; 2004; 2008; 2012; 2014; 2018;
242
Salvany et al., 2012; Germa et al., 2010, 2011; Quidelleur et al., 2008; Boulesteix et al., 2012;
243
2013, Costa et al., 2014; 2015; Sibrant et al., 2014, 2015a,b; Ricci et al., 2015, 2018; Silva et al.,
244
2012, 2018; Marques et al., 2015, 2018; Bablon et al., 2018, 2019). The technique has even been
245
extended to the last millennium with an uncertainty of only a few centuries in the case of high-K
246
lavas (Quidelleur et al., 2001). In oceanic environments, it has also been successfully applied to
247
date precisely submarine flows of various ages (Bonneville et al., 2006; Sibrant et al., 2015;
248
Marques et al., 2019).
249
The analytical data and the new K-Ar ages are presented in Table 1, Supp. Table 1, and
250
Figs. 2 to 5. Decay constants of Steiger and Jäger (1977) were used. Full details on the analytical
251
procedure and performances are given elsewhere (Gillot et al., 2006). The relative uncertainty (σage)
252
on each individual age determination is obtained as follows: , from the
253
quadratic sum of all three independent sources of uncertainty involved in the calculation: (1) the
254
relative uncertainty on the K-content determination ( ), (2) the relative uncertainty on the
255
calibration of the 40Ar signal ( ), and (3) the relative uncertainty on the correction of the
256
atmospheric contamination ( = 0.1 / 40Ar* × 100), 40Ar* being the radiogenic content.
257
(1) The relative uncertainty on K-content measurement is about 1%, from repeated measurements
258
on standards MDO-G and ISH-G (Gillot and Cornette, 1992), and BCR-2 (Rackzec et al., 2001).
259
For a given sample, repeated K measurements (usually twice) on distinct aliquots are achieved
260
σage=(σK)2+(σcal)2+(σAr*)2
σK σcal
until reaching an average value with a relative standard deviation (RSD) better than 1% (see
261
supplementary Table 1).
262
(2) The calibration of the 40Ar signal on our mass-spectrometer is obtained by systematic
263
measurements of an air pipette, which is routinely compared to the HD-B1 biotite international
264
standard with its recommended age of 24.21 Ma (Hess and Lippolt, 1994), recently confirmed at
265
24.18 ± 0.09 Ma (Schwarz and Trieloff, 2007). The relative uncertainty on the calibration,
266
including the standard uncertainty, is 1%.
267
(3) The radiogenic argon content (%40Ar*) is measured by comparison of the 40Ar/36Ar ratio of the
268
sample with an air-pipette, measured under strictly similar Ar pressure conditions. This can be
269
achieved because of the very stable analytic conditions of our mass spectrometer. The limit of
270
detection of the radiogenic Ar content is presently of 0.1%, which allows ages as young as 2 ka
271
to be obtained with only a few centuries uncertainty in favorable cases (Gillot et al., 2006).
272
For samples with low radiogenic yield (<10%), the uncertainty on the age is dominated by
273
the uncertainty on the atmospheric contamination, and can reach several tens of %. For 40Ar*
274
higher than 10%, the uncertainty on the correction of atmospheric contamination becomes
275
negligible, and the total age uncertainty rapidly converges towards 1.4% (i.e. ).
276
When the individual ages overlap within their range of uncertainties, the mean age is calculated
277
by weighting each individual age with the amount of radiogenic argon. This method is
278
conservative, as we apply the typical relative uncertainty on K (1%) and 40Ar (1%), rather than
279
calculating the age uncertainty from duplicates of each sample, as two or three measurements are
280
not statistically representative. Note that such approach prevents the systematic underestimation
281
of uncertainties when duplicates yield strictly identical values.
282
Nine independent measurements on HD-B1 standard (Hess and Lippolt, 1994) as an
283
unknown in the course of the present study yielded a mean age of 24.18 ± 0.11 Ma (RSD = 0.46%,
284
1σ), in full agreement with the recommended value of 24.21 Ma (Hess and Lippolt, 1994), ruling
285
out a significant potential bias linked with calibration of our mass spectrometer.
286 287
Supplementary Table 1. K-content of our samples measured by flame absorption photometry in
288
GEOPS Laboratory (Univ. Paris-Sud, Orsay, France). For each sample, the mean is used as the
289
final K-content for age calculation when the relative standard deviation (numbers into brackets) is
290
better than 1%, in order to account for the total uncertainty including K-solution content and the
291
uncertainty on BCR2 and MDO-G standards (see text).
292 293 Sample K (%) ST17i 1.694 1.704 Mean: 1.699 ± 0.007 (0.42%) ST17J 1.099 1.104 Mean: 1.101 ± 0.004 (0.32%) ST17L 0.702 0.700 Mean: 0.701 ± 0.001 (0.16%) ST17U 1.598 1.600 1.595 Mean: 1.598 ± 0.003 (0.17%) ST17X 1.612 1.599 1.612 Mean: 1.608 ± 0.007 (0.45%) ST17W 2.062 2.037 2.026 Mean: 2.042 ± 0.018 (0.91%) ST17Y 0.544 0.541 0.542 ± 0.02 (0.40%)
Supplementary Table 2. Data necessary to calculate the rates of vertical motion. Sea level data
294
from Miller et al. (2011).
295
296 297
5. Rates of vertical motion
298
Assuming the uncertainties in both sea level and age, it is possible to estimate a mean rate of
299
vertical movement (and its uncertainty) for each period between the age of the sample and
present-300
day, as follows (see Supp. Table 2):
301
(1) From the mean K-Ar age of a sample emplaced at sea level (or close), and the available sea
302
level dataset (Miller et al., 2011, based on δ 18O for the period analyzed here), we can estimate
303
maximal, minimal and median sea levels over the period of interest. For instance, our sample
304
ST17X yields a mean age of 811 ± 12 ka, i.e. an age in the interval 799 - 823 ka. From the
305
dataset of Miller et al. (2011), the median sea level during this period was between 100 m and
-306
45 m, i.e. a sea level value of -72 ± 28 m.
307
(2) This sea level value is subtracted from the present altitude of the sample to calculate a mean
308
amount of vertical displacement, i.e. uplift (if positive) or subsidence (if negative). In the case of
309 Sample Altitude (m) Age (Ma) Age uncertainty (Ma) Relative age uncertainty (%) Lowest sea level (m) Highest sea level (m) Median sea level (m) Uncertainty on sea level (m) Vertical displacement (m) Uncertainty vertical displacement (m) Relative uncertainty vertical displacement (%) Rate vertical motion (mm/y) ST17X 43 0.811 0.012 1.5 -100 -44.67 -72 28 115 28 24 0.14 ST17U 20 0.840 0.013 1.5 -59 -18 -38 20 58 20 35 0.07 ST17W 80 2.18 0.03 1.5 -67 -9 -38 29 118 29 25 0.05 121367* 20 2.87 0.11 3.7 -33 6 -13 19 33 19 57 0.01 ST17Y 324 3.87 0.10 2.7 -35 -7 -21 14 345 14 4 0.09 ST17L 409 3.29 0.05 1.6 -61 -12 -36 24 445 24 5 0.14 ST17I 48 5.06 0.08 1.6 -29 5 -12 17 60 17 29 0.01 ST17J 115 5.00 0.07 1.5 -29 2.67 -13 16 128 16 12 0.03 * age data from Holm et al. (2008), with uncertainty quoted at 1s
our sample ST17X, presently at an altitude of 43 m (uncertainty on present altitude is here
310
neglected), the estimated mean amount of uplift is thus 43-(-72) ± 28 m = 115 ± 28 m. The
311
relative uncertainty on the amount of vertical motion is thus (28/115)*100 = 24%.
312
(3) The rate of vertical motion is then simply calculated by dividing the amount of vertical
313
displacement by the mean age of the sample. The relative uncertainty on the rate of vertical
314
motion (in %) is obtained as the sum of the relative uncertainty on the vertical displacement and
315
the relative uncertainty on the age (very small compared to the former). For our sample ST17X,
316
a total relative uncertainty on the rate of uplift of 25% is thus obtained. A (conservative) mean
317
rate of uplift 0.14 ± 0.04 mm/a is thus estimated for the period between 811 ± 12 ka and
present-318
day.
319
The same approach for each sample gives rates of vertical displacement over different
320
periods and for different sectors of the island (Suppl. Table 2). The rates thus obtained are all
321
positive suggesting at first examination that there has been only uplift during the last 5 Ma.
322
However, a closer examination shows that the vertical motion history can be more complex. For
323
instance, the rates obtained over the last 5 Ma (samples ST17 I and J) are one order of magnitude
324
lower than rates obtained on the period 3.3 – 0 Ma (sample ST17L) in the same sector. This
325
suggests a more complex history, where fast uplift may have been followed/preceded by periods
326
with either no uplift at all, or even subsidence. It is thus necessary to use a step-by-step
327
reconstruction to elucidate the more complex history. The new method introduced here works as
328
follows (Figs. 5 and 6): we calculate the original position of the youngest rock unit (UVC, former
329
Assomada), and use it to estimate the vertical displacement and the rate of vertical motion in the
330
most recent period of time. Given that the rock is the youngest, all older rocks must follow the same
331
motion path, which we call the anchor path (Figs. 5 and 6). Following this stage, the number of
rock units is reduced by one. And then we repeat the process using the second youngest rock unit,
333
until we reach the oldest unit, which must follow all vertical motions of the younger units. More
334
critically, we used paleo-shorelines (inferred from passage zones) at different age and altitude to set
335
anchor points (Fig. 5). Given that all older rocks should show the same rate (assuming only pure
336
vertical motion, i.e no differential movement/tilting), then the calculated path becomes an anchor
337
path, which should be identical to all rocks (cf. blue, black and red dash-dot lines drawn parallel to
338
the anchor green dashed line in Fig. 5). From this step onwards, all rates for older time intervals
339
must be consistent with the anchor points and paths.
340
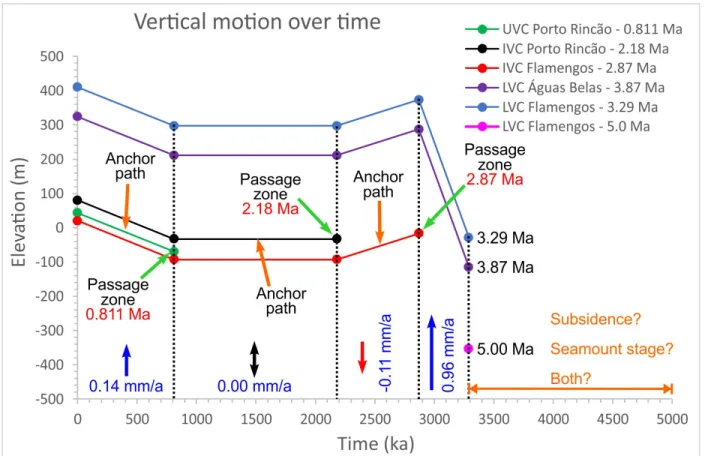
341
Figure 5. Sketch to show the use of anchor points (passage zones) to construct anchor paths
342
(marked with blue arrows), which must ultimately converge to a check point. The first anchor path
343
calculated to constrain the rates of vertical motion is the youngest (green line), because the most
344
recent vertical motion must be identical to all units in the case of vertical motion alone. By going
345
back in time, we obtain the paleo-positions and vertical motion rates. Note that older rocks follow a
346
path identical to the younger rocks to guarantee that the whole island follows anchor paths. All
347
ages were obtained in the present work, except the 2.87 Ma age reported in Holm et al. (2008).
349
Figure 6. Sketch to illustrate the methodology introduced here to estimate vertical motion rates.
350
The blue dashed lines represent current sea level. The sums (black bold numbers) represent vertical
351
displacement (positive for uplift and negative for subsidence). The blue numbers represent the
352
corresponding vertical motion rates.
Given that the effect of eustatic sea level uncertainty (in the considered time periods) on rate
354
calculations is much greater than the effect of age error, we only consider the former in the
355
calculations. For each period, we can use average or median sea level calculated from the dataset of
356
Miller et al. (2011), which differ at most by only a few meters. Positive and negative vertical
357
motion rates denote uplift and subsidence, respectively.
358
359
Supplementary Figure 2. Sea level curves from Miller et al. (2011) for the periods indicated in the
360
plots. Mean sea level for each period represented by blue dashed line with respective value.
361 362
The detailed description of the procedure we used to constrauct Figures 5 and 6 can be
363
found in the supplementary material.
364
Given that we could not find passage zones in the Lower Volcanic Complex at Águas Belas
365
and Flamengos creeks, the estimated uplift rate is a minimum. At ca. 3.29 Ma, the rocks dated at
366
3.29, 3.87 and 5.00 Ma were at -29, -115 and -354 m depth, respectively (cf. Figs. 5 and 7), because
they belong to the same volcanic unit and so had to undergo the same vertical displacement, which
368
is that of the youngest rock (ca. 3.29 Ma). The highest submarine rocks of Águas Belas (ca. 324 m)
369
are not as high as the highest in the opposing Flamengos valley (ca. 410 m), but the age of the two
370
rocks is also not the same – greater in the Águas Belas valley (ca. 3.87 Ma) than in the Flamengos
371
valley (ca. 3.29 Ma), which, together with differential erosion, could justify the current difference
372
in altitude (410 -324 = 86 m).
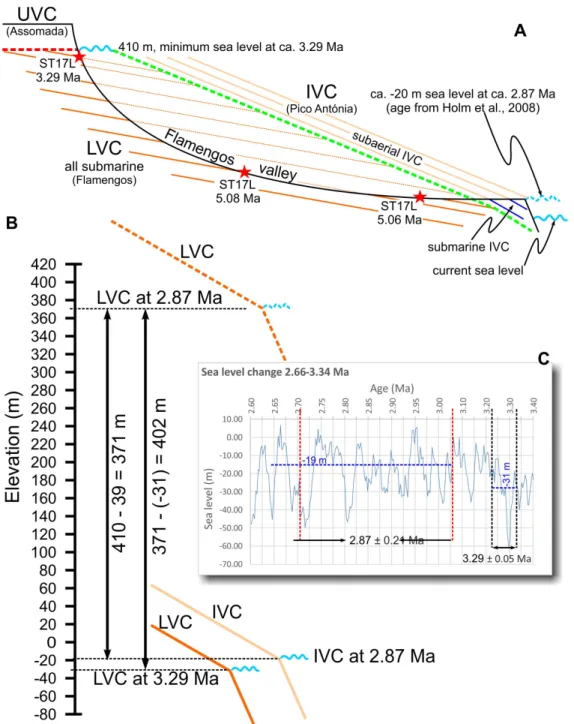
374
Figure 7. Sketch of the geological setting in the Flamengos valley (A) and graph (C) to
375
illustrate how the minimum uplift rate between 3.29 and 2.87 Ma can be estimated. B – sea
376
level curve between 2.6 and 3.2 Ma (Miller et al., 2011) to show sea level variation in the
377
interval of the 2.87 ± 0.21 Ma age (Holm et al., 2008). The average sea level in the period is ca.
378
-20 m, which means that the current altitude of ca. 20 m of the passage zone corresponds to sea
379
level. LVC – Lower Volcanic Complex (former Flamengos Formation of Serralheiro, 1976);
380
IVC – Intermediate Volcanic Complex (former Pico da Antónia Formation, which can be
381
subaerial – pink lines, and pass into submarine – blue lines); UVC – subaerial Upper Volcanic
382
Complex (former Assomada Formation). Red dashed line – major unconformity between LVC
383
and UVC; green dashed line – major unconformity between LVC and IVC.
6. Discussion
385
6.1. New ages
386
From field work in the target area, geomorphological analysis and the new ages reported
387
here (Fig. 4), we have updated and improved previous mapping of the volcanic units: (1) the Lower
388
Volcanic Complex (former Flamengos Formation, orange in the geological map) in the Porto
389
Rincão creek is actually the submarine part of the Intermediate Volcanic Complex (former Pico da
390
Antónia Formation); (2) the submarine Intermediate Volcanic Complex in the Porto Rincão creek
391
(blue horizontal stripes in the geological map) is actually the submarine part of the Upper Volcanic
392
Complex (former Assomada Formation), which is recognized here for the first time; (3) part of the
393
subaerial Intermediate Volcanic Complex (former Pico da Antónia, peach color in the geological
394
map) is actually Upper Volcanic Complex, which form quite well preserved lava deltas; (4) the
395
submarine Intermediate Volcanic Complex in the Águas Belas creek (blue horizontal stripes in the
396
geological map) is actually the entirely submarine Lower Volcanic Complex. The recognition that
397
the geological map is incorrect in critical places suggests that previous work based on the
398
geological map may be erroneous.
399 400
6.2. Rates of vertical motion
401
We present a new methodology to deduce vertical motion histories, which can be applied to
402
any island or coastline hosting sequences of paleoshorelines of determinate age. Here we use this
403
methodology and new K-Ar chronostratigraphy to infer the vertical motion history of Santiago
404
Island. We complemented the new methodology with an exercise based on state-of-the-art
405
geochronology and a paleo sea level curve (Miller et al., 2005, 2011). Sensitivity tests indicate that
406
the vertical displacement rates we deduce in a given interval are relatively insensitive to our choice
of eustatic sea level curve (Bintanja et al., 2005; De Boer et al., 2010; Hansen et al., 2013), and
408
came to the conclusion that none can change our results significantly, i.e. none can change
409
subsidence into uplift or vice-versa. In fact, we already show this when we estimate vertical
410
displacement rates using the end-member values in a given interval.
411
Using the geological map of Serralheiro (1976), Ramalho et al. (2010a, c) estimated vertical
412
motion in Santiago, but were unable to find and date passage zones, the critical criterion for an
413
ideal marker of paleo sea level (cf. Table 4 of Ramalho et al., 2010c). They used submarine lavas at
414
ca. 270 m altitude in the Águas Belas Valley to estimate paleo sea level at ca. 2.8 Ma, because the
415
geological map attributes these rocks to the submarine Intermediate Volcanic Complex (former
416
Pico da Antónia Formation). However, those submarine lavas are dated here about 1 Ma older (ca.
417
3.87 Ma – cf. Fig. 4), which means that they belong to the Lower Volcanic Complex (former
418
Flamengos). Moreover, the new stratigraphy calibrated by isotopic ages indicates that the passage
419
zone within the Intermediate Volcanic Complex (former Pico da Antónia) lies at ca. 80 m altitude
420
in the Porto Rincão valley (immediately to the south of the Águas Belas valley), which is
421
significantly lower than the 270 m used by Ramalho et al. (2010a, c). Therefore, the rates estimated
422
by Ramalho et al. (2010a, c) are incorrect. Because they were unable to find passage zones,
423
Ramalho et al. (2010a,b,c) dated outcrops of subaerial volcanic units and assumed that underlying
424
submarine units formed at the same time and at a minimum depth below sea level equivalent to the
425
thickness of the submarine unit. However, our fieldwork and dating show that the contact between
426
the subaerial and submarine units is an erosional unconformity and that the subaerial volcanics are
427
at least 2 Ma younger than the underlying submarine rocks. The rates calculated by Ramalho et al.
428
(2010a,b,c) therefore underestimate both the minimum paleodepth (since the thickness of the
429
eroded submarine volcanics is unknown) and the age of the paleoshoreline indicator. Given that the
whole unit is made up of submarine flows, the Lower Volcanic Complex (former Flamengos) can
431
be interpreted in two contrasting ways: (1) the edifice was in a seamount stage, i.e. volcanic growth
432
under sea level, therefore there is no argument in favor of any vertical motion – the older lavas
433
simply formed deeper in the ocean; (2) the edifice was on a subaerial building stage, so that the
434
subaerial lavas at the rim of the proto-island passed into submarine; this means that the submarine
435
lavas formed all at similar depth in the ocean, but were gradually carried to depth by island
436
subsidence between ca. 5 and 3.3 Ma. We do not have an answer to this question because we could
437
neither find passage zones in the LVC, nor fossils on the pillows that could indicate depth.
438
Ramalho et al. (2010a, b, c) concluded for a “general uplift trend over the last 5 Ma” for
439
Santiago. The use of precisely dated passage zones, at different ages (0.811, 2.18 and 2.87 Ma) and
440
in different places on the island led us to a contrasting conclusion: instead of general uplift at a
441
constant rate of ca. 0.092 mm/a (Ramalho et al., 2010a, b, c), our new data and procedure indicate
442
that Santiago experienced periods of uplift, at different rates (0.95 to 0.14 mm/a), intercalated with
443
at least one period of subsidence (-0.11 mm/a), so improving the temporal resolution of Santiago's
444
vertical motion history.
445
The subsidence period here recognized corresponds to major volcanic construction, i.e. the
446
construction of the most widespread unit in Santiago – the Intermediate Volcanic Complex (former
447
Pico da Antónia). Subsidence may also have occurred during the deposition of the Lower Volcanic
448
Complex, so explaining why this unit is entirely made of submarine lavas.
449 450
6.3. Mechanisms responsible for the vertical displacements of Santiago Island
451
Having estimated displacements and rates, we now discuss the possible mechanisms
452
responsible for the vertical motions of Santiago Island. Here we will concentrate on two main
mechanisms, one top-down (island loading and unloading) and the other bottom-up (lithosphere
454
thinning, underplating, thermal mantle plume), both directly related to isostasy.
455 456
6.3.1. Top-down: insights from isostatic calculation
457
For the top-down mechanism, we do not have enough unloading (erosion in all its forms)
458
data to quantitatively justify the inferred uplifts. However, we have geological information enough
459
to quantitatively explain the subsidence episode in Santiago between ca. 2.9 and 2.2 Ma, which
460
corresponds to the time when the voluminous IVC was being deposited on top of a major
461
unconformity affecting both BC and LVC. These complexes underwent major erosion prior to the
462
deposition of the IVC, thus comprising one of the main unconformities whose topography peaks at
463
ca. 500 m altitude (cf. Fig. 2B). Given that the IVC peaks currently at ca. 1400 m, we can use a
464
thickness of 900 m to calculate the maximum subsidence due to loading. We can estimate the
465
isostatic effect of constructional loading by assuming Airy isostasy (i.e. the lithosphere has zero
466
strength and all loads are locally compensated) and a maximum 900 m thickness of the IVC:
467
ε = 900 – (900*ρl/ρa) = 900 – 900*2800/3200 = 900 – 788 = 112 m
468
where ε is the topography, ρl is the density of the lavas, and ρa is the density of the asthenosphere.
469
112 m is an upper bound calculation of the isostatic response to constructional loading, therefore
470
indicating that loading by the IVC could potentially account for the inferred ca. 80 m of subsidence
471
in this period.
472
6.3.2. Bottom-up: insights from numerical modeling
Different bottom-up mechanisms can be responsible for the inferred vertical movements (up
474
to 400 m): thinning of the lithosphere by basal erosion, and/or crustal underplating, and/or arrival of
475
a hot, low-density material at the base of the lithosphere (thermal mantle plume). We performed a
476
set of 1-D numerical modeling tests to simulate these bottom-up mechanisms by solving the 1-D
477
heat transport equation and calculating the uplift resulting from density variations following crustal
478
thickening or temperature changes. We designed these modeling experiments to best reproduce the
479
observed uplift of Santiago, assuming reasonable input parameters, to assess the viability of each
480
mechanism.
481
The heat equation to be solved is the following:
482 𝜌𝑐!" !" = 𝐴 + 𝑘 !!! !!! Eq. 1 483
where T is the temperature [ºC], t the time [s], z the depth [m], ρ the density [kg/m3], c the mass
484
heat capacity [J/(kg*K)], and k the thermal conductivity [W/(m*K)]. The boundary conditions are
485
fixed temperatures at the top and bottom of the model domain, respectively 0 ºC and 1300 ºC
486
(considered to be the normal asthenospheric temperature). We used standard values of k = 2.2
487
W/(m*K) and c = 1000 J/(kg*K) for the crust (gabbro), and k = 3 W/(m*K) and c = 1000 J/(kg*K)
488
for the mantle (peridotite) (Robertson, 1988). Heat production was 0.2 µW/m3 for the crust and
489
0.02 µW/m3 for the mantle.
490
Density is related to temperature through the following equation:
491
𝜌 𝑇 = 𝜌 𝑇! ∙ 1 − 𝛼 𝑇 − 𝑇! Eq. 2 492
where ρ is density [kg/m3], α the thermal expansion coefficient [1/K], and T0 a reference
493
temperature at which density is ρ0. This reference temperature is taken as 0 ºC for crustal materials
and 1300 ºC for the mantle. The thermal expansion coefficient is taken as 3.5∗10-5 K-1 for all
495
materials (Afonso et al., 2005). As reference density we used ρ0 =2800 kg/m3 for the crust and 3200
496
kg/m3 for the mantle.
497
Several works have investigated the nature and properties of the lithosphere in the Cape
498
Verde Swell (Ali et al., 2013; Carvalho et al., 2019; Dash et al., 1976; Hellfrich et al., 2010; Lodge
499
and Helffrich, 2006; McNuttt, 1988; Pim et al., 2008; Vinnik et al., 2012; Wilson et al., 2010,
500
2013). Fundamental for the modeling are the thicknesses suggested in those works for the
501
lithosphere and the oceanic crust, which vary from 60 km (Carvalho et al. (2019) to 100 km (Lodge
502
and Helffrich, 2006) for the former, and from 7 km (e.g. Pim et al., 2008; Wilson et al., 2010) to 15
503
km for the latter (Dash et al., 1976). Therefore, we tested initial lithosphere configurations with
504
crustal thicknesses of 7 km and 15 km, and lithosphere thickness of 80 and 100 km. Topography
505
was calculated assuming local isostatic equilibrium using the following equation (Lachenbruch and
506 Morgan, 1990): 507 𝜀 = !! !!!!! !!!!! !! 𝐻 + 𝜀! Eq. 3 508
where ε is the topography [m], ρa the asthenospheric density (3200 kg/m3), ρL the average
509
lithospheric density, ρW the density of sea water (1030 kg/m3), H the thickness of the lithosphere
510
[m], and ε0 the reference topography of an unloaded asthenosphere (-2400 m).
511
In the results presented below, the beginning of the calculations corresponds to 3.3 Ma ago,
512
because this is the age of the first recognized major uplift. We present for the different models 2 to
513
3 calculations in order to show that different initial configurations combined with different
514
structural modifications can explain the uplift.
516
Model 1: Lithospheric thinning
517
The temperature at the initial depth (80 or100 km) is maintained constant at 1300 ºC during
518
the whole calculation. Between 0 and 0.4 Ma in the simulation (3.3 to 2.9 Ma in nature), the base of
519
the lithosphere rises from 100 km to 60 km in steps of 5 km/0.05 Ma (blue line in Fig. 8A) or from
520
80 to 44 km in steps of 4 km/0.05 Ma (orange line in Fig. 8A), resulting in a total topographic uplift
521
of ca. 470 m. From 0.4 to 2.5 Ma (2.9 to 0.8 Ma in nature), the temperature relaxes, and the
522
lithosphere thickens slowly, resulting in a subsidence of 50 m. At 2.5 Ma (0.8 Ma in nature), a new
523
pulse of lithosphere heating is simulated by thinning the lithosphere again to 60 km / 44 km, and
524
maintaining the base of the lithosphere (i.e. a temperature of 1300 ºC) at this depth until 3.3 Ma (0
525
Ma in nature), which results in another uplift of ca. 200 m. The topography rises higher than at 0.4
526
Ma because the crust has meanwhile been heated as well. Both models give very similar results.
527 528
529
Figure 8. Numerical modeling of the topography variation over time resulting from the Airy
530
isostatic response to (A) lithospheric thinning as specified in Model 1, (B) underplating as specified
531
in Model 2, and (C) excess buoyancy associated with a mantle plume as specified in Model 3.
Model 2: Crustal thickening (underplating)
533
The crust thickens by a total of 800 m (from 7 to 7.8 km, blue line in Fig. 8B, and from 15
534
to 15.8 km, orange line in Fig. 8B) between 0 and 0.4 Ma (3.3 to 2.9 Ma in nature). Material arrives
535
at 1100 °C, the typical temperature of a basaltic magma, its temperature is maintained constant until
536
0.4 Ma (2.9 Ma in nature) to simulate a constant supply and heating of the surrounding layers
537
during the whole process. This results in a topographic uplift of 460 m. After 0.4 Ma (2.9 Ma in
538
nature), the temperature relaxes and topography decreases slightly. At 2.5 Ma (0.8 Ma in nature),
539
another pulse of thickening of 100 m (7.8 to 7.9 km) is simulated, again with a temperature of 1100
540
°C that is maintained during 0.1 Ma. After 0.8 Ma (at 3.3 Ma = 0 Ma in nature), it results in an
541
uplift of 100 m, including the partial temperature relaxation between 2.6 and 3.3 Ma (0.7 to 0 Ma in
542
nature). The effect of relaxation is stronger for the initially thinner crust, which, when taking into
543
account the observation of roughly stable topography during this period, would give a preference
544
for the model with thicker initial crust.
545 546
Model 3: Rise of a thermal plume
547
In this model, hot material (thermal mantle plume) arrives at the base of the lithosphere and
548
replaces it in a variable thickness depending on plume temperature. We modeled temperature
549
differences between 100 and 300 ºC, i.e. plume material at 1400 to 1600 °C. The temperature is
550
maintained identical until 0.4 Ma (2.9 Ma in nature), then it relaxes. In order to achieve the desired
551
total topographic uplift of about 400 m, the thickness of the plume material layer must vary
552
between 25 km for a 1400 °C plume and 16 km for a 1600 °C plume. The effect is thus nearly
553
linear with the temperature difference. However, subsidence is much more important for hotter
material. A simple model as presented here would therefore not be compatible with the
555
observations. Nevertheless, a continuous supply of hot material between 2.9 and 0.8 Ma ago would
556
maintain the topography at the observed height. We did not model the second pulse at 2.5 Ma (0.8
557
Ma in nature), since the other models show that the necessary topography variation can be easily
558
achieved.
559
For the quantitative interpretation, a critical condition is the one of local isostasy.
560
Significant elastic strength would reduce the topographic response. However, on the one hand, the
561
volcanism in Cape Verde indicates a locally hot and therefore weaker lithosphere. On the other
562
hand, especially for models 2 and 3, the structural variations used for the models are quite modest:
563
doubling crustal thickening or the thickness of the hot plume layer would certainly not be
564
exaggerated. It would be more difficult to consider much stronger thinning of the lithosphere in
565
Model 1 without the additional effect of hot rising plume material. Anyhow, also a combination of
566
all models would be able to explain the inferred uplift. The question now is application of the
567
model results to Santiago in the context of the archipelago and the Cape Verde Rise. Most
large-568
scale geophysical studies carried out in the Cape Verde Swell suggest that upwelling within the
569
asthenosphere supports the anomalous topography of the Cape Verde Swell, with minor
570
contributions from local thickened oceanic crust and, perhaps, partial thermal rejuvenation of the
571
lithospheric mantle. If large-scale swelling (dynamic uplift at the scale of the whole archipelago;
572
e.g. Huppert et al., 2020) were the mechanism responsible for island uplift , then one would expect
573
to find similar uplift in islands with similar age, which is not the case (e.g. Ramalho et al., 2010a, b,
574
c). Therefore, the solution to explain geological evidence should come from local mechanisms.
575
Model 1 is intended to simulate extension, which does not seem a sensible option in the
576
geodynamic setting of Cape Verde where rifting has never been recognized. In contrast, Model 3
looks like a good option, because this model simulates the scenario whereby the mantle plume
578
dynamically uplifts the lithosphere underlying the Cape Verde Islands during Santiago's evolution,
579
but is inconsistent with what is known about the differential vertical motion among the Cape Verde
580
islands (e.g. Ramalho et al., 2010a, b, c), because some islands show large uplifts (e.g. Santiago and
581
S. Nicolau), but other islands do not record uplift (e.g. Santo Antão and Fogo). Therefore, the
large-582
scale plume (regional mechanism) cannot explain the differential uplift. The solution is therefore to
583
look for a local mechanism, which is the case of magma underplating (Model 2), as already
584
suggested to exist beneath the islands (e.g. Lodge and Helffrich, 2006; Ramalho et al., 2010b;
585
Vinnik et al., 2012; Wilson et al., 2010).
586 587
7. Conclusions
588
We use paleoshorelines at different altitude and age to constrain the vertical motion history 589
of Santiago Island. Specifically, we calculate the time-averaged vertical motion rates required to 590
explain the present-day elevations of the dated sequence of paleoshorelines. We account for eustatic 591
sea level changes and work progressively back in time to incorporate the more recent vertical 592
motion rates implied by the youngest paleoshorelines into the vertical motion history of all older 593
shorelines. We thus obtain a vertical motion history consisting of time-averaged vertical motion 594
rates spanning the five intervening time periods between paleoshoreline formation and the present 595
day: (1) > 6 Ma – this stage is certainly mostly submarine (seamount growth), but there is no
596
consensus regarding the submarine or subaerial nature of the rocks of the Basement Complex
597
currently cropping out onshore: all submarine, or subaerial in part? Did the seamount grow into an
598
island with subaerial volcanism? (2) 5.06 to 3.29 Ma – given that all known rocks in this period are
599
submarine, they can represent seamount growth or island subsidence. (3) 3.29 to 2.87 Ma – fast
uplift (0.96 mm/a) mostly responsible for putting submarine lavas currently close to 410 m altitude.
601
(4) 2.87 to 2.18 Ma – relatively fast subsidence (-0.11 mm/a), most likely due to the fast volcanic
602
growth of the most voluminous volcanic unit on the island, the Intermediate Volcanic Complex
603
(former Pico da Antónia Formation). (5) 2.18 to 0.811 Ma – stationary island (0.00 mm/a). (6)
604
0.811 to 0 Ma – relatively fast uplift (0.14 mm/a).
605
The advantage of using dated passage zones, at different ages (0.811, 2.18 and 2.87 Ma) and
606
in different places on the island, and a different procedure is that we find a more detailed history of
607
vertical motion consistent with geological observation. Instead of a simple general uplift at a
608
constant rate of ca. 0.092 mm/a (Ramalho et al., 2010a, b, c), our new data and methodology
609
indicate that Santiago experienced several periods of uplift, at different rates (0.95 to 0.14 mm/a),
610
intercalated with at least one period of subsidence (-0.11 mm/a).
611
We numerically tested top-down (volcanic loading) and bottom-up (lithosphere thinning,
612
underplating and mantle plume) mechanisms to explain the inferred vertical movements, and we
613
conclude that volcanic loading and crustal underplating are capable of producing the observed
614
subsidence and uplift, respectively.
615 616
Acknowledgments
617
This is a contribution to Project MEGAHazards2 (PTDC/GEO-GEO/0946/2014), funded by
618
FCT, Portugal. The sea level data used in this study was kindly supplied by Kenneth Miller, and
619
can be found here: https://www.ncdc.noaa.gov/paleo-search/study/13947. Thorough and
620
constructive reviews by five anonymous Reviewers helped to clarify and improve the quality of this
621
manuscript.
622 623
References
624
Afonso, J.C., Ranalli, G., Fernàndez, M., 2005. Thermal expansivity and elastic properties of the
625
lithospheric mantle: results from mineral physics of composites. Phys. Earth Planet. Int. 149,
626
279-306. Doi: 10.1016/j.pepi.2004.10.003.
627
Ali, M. Y., A. B. Watts, & I. Hill, 2003. A seismic reflection profile study of lithospheric flexure in
628
the vicinity of the Cape Verde Islands. J. Geophys. Res. 108, 2239, doi:10.1029/2002JB002155.
629
Bernard-Griffiths, J., Cantagrel, J.-M., Alves, C., Mendes, F., Serralheiro, A. & Macedo, J., 1975.
630
Geochronologie: Donnés radiometriques potassium/argon sur quelques formations magmatiques
631
des îlles de l’archipel du Cap Vert. Comptes Rendus des Seances de l’Academie des Sciences
632
D280, 2429–2432.
633
Bintanja, R., van de Wal, R.S.W., Oerlemans, J., 2005. Modelled atmospheric temperatures and
634
global sea levels over the past million years. Nature 437 (7055), 125–128.
635
Bonneville, A., Dosso, L., Hildenbrand, A., 2006. Temporal evolution and geochemical variability
636
of the South Pacific superplume activity. Earth and Planetary Science Letters, 244(1-2):251-269.
637
Boulesteix, T., Hildenbrand, A., Gillot, P.Y., Soler, V., 2012. Eruptive response of oceanic islands
638
to giant landslides: New insights from the geomorphologic evolution of the Teide–Pico Viejo
639
volcanic complex (Tenerife, Canary). Geomorphology, 138 (1), 61-73.
640
Boulesteix, T., Hildenbrand, A., Soler, V., Quidelleur, X., Gillot, P.Y., 2013. Coeval giant
641
landslides in the Canary Islands: Implications for global, regional and local triggers of giant
642
flank collapses on oceanic volcanoes. Journal of Volcanology and Geothermal Research, 257,
643
90-98.
644
Carvalho, J., Bonadio, R., Silveira, G., Lebedev, S., Mata, J., Arroucau, P., s Meier, T., Celli, N.L.,
645
2019. Evidence for high temperature in the upper mantle beneath Cape Verde archipelago from
Rayleigh-wave phase-velocity measurements. Tectonophysics 770, 228225.
647
Cas, R., & Wright, J., 1987. Volcanic successions. modern and ancient: a geological approach to
648
processes, products and successions. London, UK: Chapman & Hall.
649
Costa, A.C.G., Marques, F.O., Hildenbrand, A., Sibrant, A.L.R., Catita, C.M.S., 2014. Large-scale
650
catastrophic flank collapses in a steep volcanic ridge: the Pico-Faial Ridge, Azores Triple
651
Junction. Journal of Volcanology and Geothermal Research, 272, 111-125.
652
Costa, A.C.G., Hildenbrand, A., Marques, F.O., Sibrant, A.L.R., Santos de Campos, A., 2015.
653
Catastrophic flank collapses and slumping in Pico Island during the last 130 kyr (Pico-Faial
654
ridge, Azores Triple Junction). J. Volcanol. Geotherm. Res., 302, 33-46.
655
Dash, B.P., Ball, M.M., King, G.A., Butler, L.W., Rona, P.A., 1976. Geophysical investigation of
656
the Cape Verde archipelago. J. Geophys. Re. 81, 5249-5259.
657
de Boer, B., Van de Wal, R.S.W., Bintanja, R., Lourens, L.J., Tuetter, E., 2010. Cenozoic global
658
ice-volume and temperature simulations with 1-D ice-sheet models forced by benthic δ18O
659
records. Ann. Glaciol. 51, 23–33. Doi:10.3189/172756410791392736.
660
Germa, A., Quidelleur, X., Gillot, PY., Tchilinguirian, P., 2010. Volcanic evolution of the back-arc
661
Pleistocene Payun Matru volcanic field (Argentina). Journal of South American Earth Sciences
662
29, 717-730.
663
Germa, A., Quidelleur, X., Lahitte, P., Labanieh, S. & Chauvel, C., 2011. The K–Ar Cassignol–
664
Gillot technique applied to western Martinique lavas: a record of Lesser Antilles arc activity
665
from 2 Ma to Mount Pelée volcanism. Quat. Geochronol. 6, 341–355.
666
Gillot, P. Y., Cornette, Y., 1986. The Cassignol technique for potassium–argon dating, precision
667
and accuracy – examples from the Late Pleistocene to recent volcanics from southern
668
Italy. Chem. Geol. 59, 205–222.